Note
Access to this page requires authorization. You can try signing in or changing directories.
Access to this page requires authorization. You can try changing directories.
To ensure complete and uninterrupted data ingestion in your Microsoft Sentinel service, keep track of your data connectors' health, connectivity, and performance.
The following features allow you to perform this monitoring from within Microsoft Sentinel:
Data collection health monitoring workbook: This workbook provides additional monitors, detects anomalies, and gives insight regarding the workspace’s data ingestion status. You can use the workbook’s logic to monitor the general health of the ingested data, and to build custom views and rule-based alerts.
SentinelHealth data table (Preview): Querying this table provides insights on health drifts, such as latest failure events per connector, or connectors with changes from success to failure states, which you can use to create alerts and other automated actions. The SentinelHealth data table is currently supported only for selected data connectors.
Important
The SentinelHealth data table is currently in PREVIEW. See the Supplemental Terms of Use for Microsoft Azure Previews for additional legal terms that apply to Azure features that are in beta, preview, or otherwise not yet released into general availability.
View the health and status of your connected SAP systems: Review health information for your SAP systems under the SAP data connector, and use an alert rule template to get information about the health of the SAP agent's data collection.
Use the health monitoring workbook
To get started, install the Data collection health monitoring workbook from the Content hub and view or create a copy of the template from the Workbooks section of Microsoft Sentinel.
For Microsoft Sentinel in the Azure portal, under Content management, select Content hub.
For Microsoft Sentinel in the Defender portal, select Microsoft Sentinel > Content management > Content hub.In the Content hub, enter health in the search bar, and select Data collection health monitoring from among the results.
Select Install from the details pane. When you see a notification message that the workbook is installed, or if instead of Install, you see Configuration, proceed to the next step.
In Microsoft Sentinel, under Threat management, select Workbooks.
In the Workbooks page, select the Templates tab, enter health in the search bar, and select Data collection health monitoring from among the results.
Select View template to use the workbook as is, or select Save to create an editable copy of the workbook. When the copy is created, select View saved workbook.
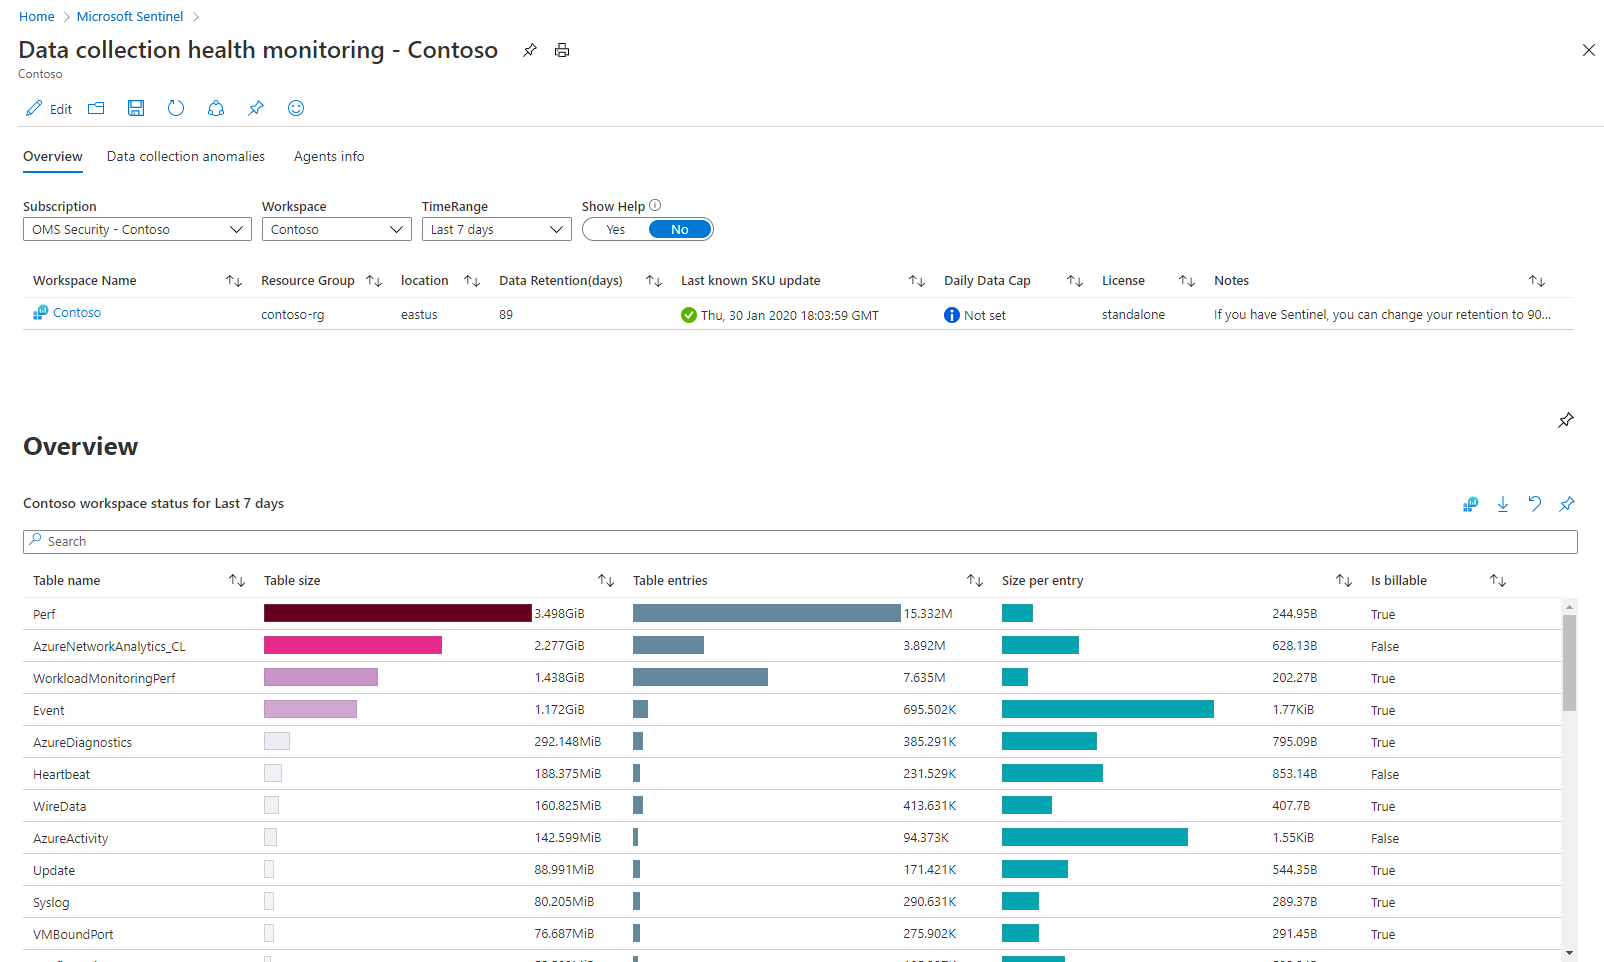
Once in the workbook, first select the subscription and workspace you wish to view, then define the TimeRange to filter the data according to your needs. Use the Show help toggle to display in-place explanation of the workbook.
There are three tabbed sections in this workbook:
The Overview tab shows the general status of data ingestion in the selected workspace: volume measures, EPS rates, and time last log received.
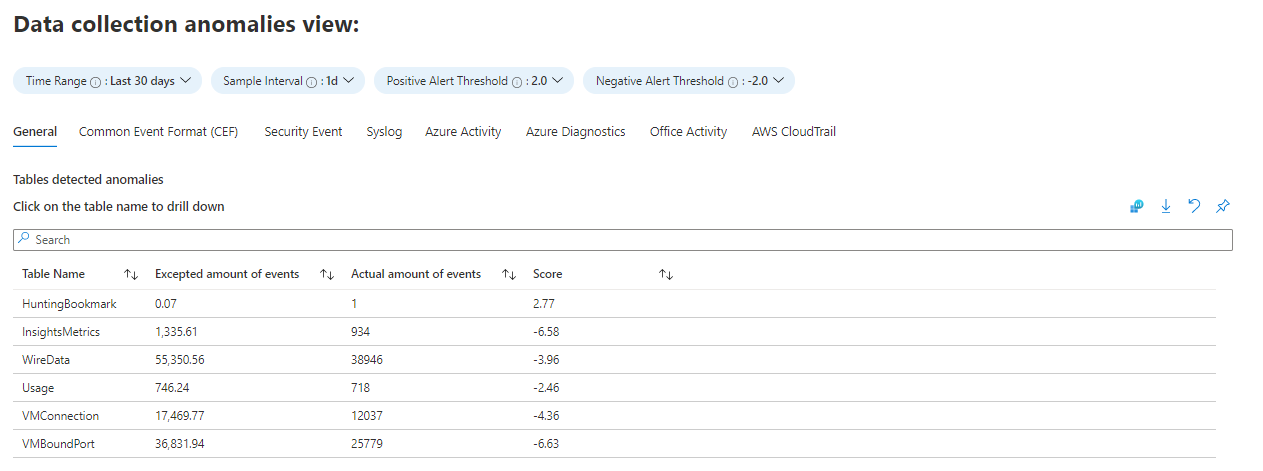
The Data collection anomalies tab will help you to detect anomalies in the data collection process, by table and data source. Each tab presents anomalies for a particular table (the General tab includes a collection of tables). The anomalies are calculated using the series_decompose_anomalies() function that returns an anomaly score. Learn more about this function. Set the following parameters for the function to evaluate:
AnomaliesTimeRange: This time picker applies only to the data collection anomalies view.
SampleInterval: The time interval in which data is sampled in the given time range. The anomaly score is calculated only on the last interval's data.
PositiveAlertThreshold: This value defines the positive anomaly score threshold. It accepts decimal values.
NegativeAlertThreshold: This value defines the negative anomaly score threshold. It accepts decimal values.
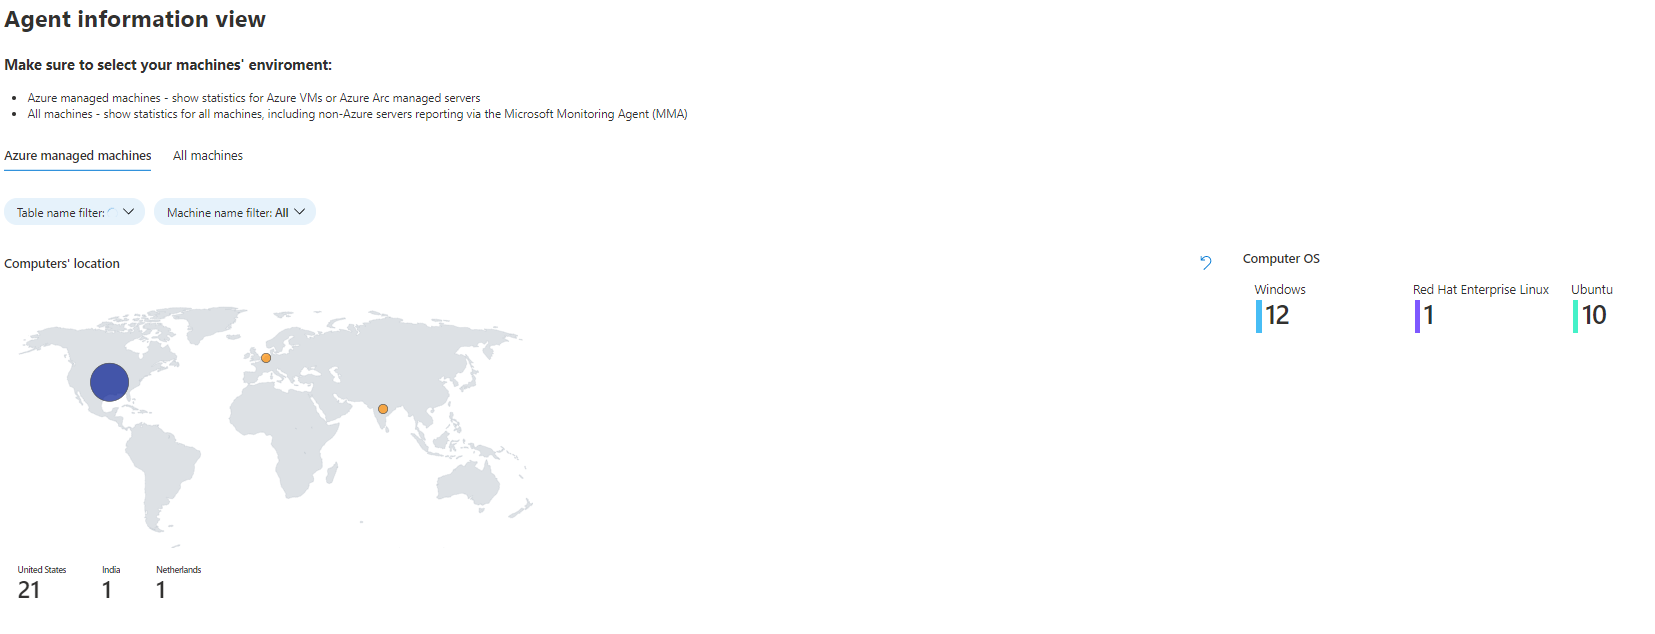
The Agent info tab shows you information about the health of the agents installed on your various machines, whether Azure VM, other cloud VM, on-premises VM, or physical. Monitor system location, heartbeat status and latency, available memory and disk space, and agent operations.
In this section you must select the tab that describes your machines’ environment: choose the Azure-managed machines tab if you want to view only the Azure Arc-managed machines; choose the All machines tab to view both managed and non-Azure machines with the Azure Monitor Agent installed.
Use the SentinelHealth data table (Public preview)
To get data connector health data from the SentinelHealth data table, you must first turn on the Microsoft Sentinel health feature for your workspace. For more information, see Turn on health monitoring for Microsoft Sentinel.
Once the health feature is turned on, the SentinelHealth data table is created at the first success or failure event generated for your data connectors.
Supported data connectors
The SentinelHealth data table is currently supported only for the following data connectors:
- Amazon Web Services (CloudTrail and S3)
- Dynamics 365
- Office 365
- Microsoft Defender for Endpoint
- Threat Intelligence - TAXII
- Threat Intelligence Platforms
- Any connector based on Codeless Connector Framework
Understanding SentinelHealth table events
The following types of health events are logged in the SentinelHealth table:
Data fetch status change. Logged once an hour as long as a data connector status remains stable, with either continuous success or failure events. For as long as a data connector's status does not change, monitoring only hourly works to prevent redundant auditing and reduce table size. If the data connector's status has continuous failures, additional details about the failures are included in the ExtendedProperties column.
If the data connector's status changes, either from a success to failure, from failure to success, or has changes in failure reasons, the event is logged immediately to allow your team to take proactive and immediate action.
Potentially transient errors, such as source service throttling, are logged only after they've continued for more than 60 minutes. These 60 minutes allow Microsoft Sentinel to overcome a transient issue in the backend and catch up with the data, without requiring any user action. Errors that are definitely not transient are logged immediately.
Failure summary. Logged once an hour, per connector, per workspace, with an aggregated failure summary. Failure summary events are created only when the connector has experienced polling errors during the given hour. They contain any extra details provided in the ExtendedProperties column, such as the time period for which the connector's source platform was queried, and a distinct list of failures encountered during the time period.
For more information, see SentinelHealth table columns schema.
Run queries to detect health drifts
Create queries on the SentinelHealth table to help you detect health drifts in your data connectors. For example:
Detect latest failure events per connector:
SentinelHealth
| where TimeGenerated > ago(3d)
| where OperationName == 'Data fetch status change'
| where Status in ('Success', 'Failure')
| summarize TimeGenerated = arg_max(TimeGenerated,*) by SentinelResourceName, SentinelResourceId
| where Status == 'Failure'
Detect connectors with changes from fail to success state:
let latestStatus = SentinelHealth
| where TimeGenerated > ago(12h)
| where OperationName == 'Data fetch status change'
| where Status in ('Success', 'Failure')
| project TimeGenerated, SentinelResourceName, SentinelResourceId, LastStatus = Status
| summarize TimeGenerated = arg_max(TimeGenerated,*) by SentinelResourceName, SentinelResourceId;
let nextTolatestStatus = SentinelHealth
| where TimeGenerated > ago(12h)
| where OperationName == 'Data fetch status change'
| where Status in ('Success', 'Failure')
| join kind = leftanti (latestStatus) on SentinelResourceName, SentinelResourceId, TimeGenerated
| project TimeGenerated, SentinelResourceName, SentinelResourceId, NextToLastStatus = Status
| summarize TimeGenerated = arg_max(TimeGenerated,*) by SentinelResourceName, SentinelResourceId;
latestStatus
| join kind=inner (nextTolatestStatus) on SentinelResourceName, SentinelResourceId
| where NextToLastStatus == 'Failure' and LastStatus == 'Success'
Detect connectors with changes from success to fail state:
let latestStatus = SentinelHealth
| where TimeGenerated > ago(12h)
| where OperationName == 'Data fetch status change'
| where Status in ('Success', 'Failure')
| project TimeGenerated, SentinelResourceName, SentinelResourceId, LastStatus = Status
| summarize TimeGenerated = arg_max(TimeGenerated,*) by SentinelResourceName, SentinelResourceId;
let nextTolatestStatus = SentinelHealth
| where TimeGenerated > ago(12h)
| where OperationName == 'Data fetch status change'
| where Status in ('Success', 'Failure')
| join kind = leftanti (latestStatus) on SentinelResourceName, SentinelResourceId, TimeGenerated
| project TimeGenerated, SentinelResourceName, SentinelResourceId, NextToLastStatus = Status
| summarize TimeGenerated = arg_max(TimeGenerated,*) by SentinelResourceName, SentinelResourceId;
latestStatus
| join kind=inner (nextTolatestStatus) on SentinelResourceName, SentinelResourceId
| where NextToLastStatus == 'Success' and LastStatus == 'Failure'
See more information on the following items used in the preceding examples, in the Kusto documentation:
- let statement
- where operator
- project operator
- summarize operator
- join operator
- ago() function
- arg_max() aggregation function
For more information on KQL, see Kusto Query Language (KQL) overview.
Other resources:
Configure alerts and automated actions for health issues
While you can use the Microsoft Sentinel analytics rules to configure automation in Microsoft Sentinel logs, if you want to be notified and take immediate action for health drifts in your data connectors, we recommend that you use Azure Monitor alert rules.
For example:
In an Azure Monitor alert rule, select your Microsoft Sentinel workspace as the rule scope, and Custom log search as the first condition.
Customize the alert logic as needed, such as frequency or lookback duration, and then use queries to search for health drifts.
For the rule actions, select an existing action group or create a new one as needed to configure push notifications or other automated actions such as triggering a Logic App, Webhook, or Azure Function in your system.
For more information, see Azure Monitor alerts overview and Azure Monitor alerts log.
Next steps
- Learn about auditing and health monitoring in Microsoft Sentinel.
- Turn on auditing and health monitoring in Microsoft Sentinel.
- Monitor the health of your automation rules and playbooks.
- Monitor the health and integrity of your analytics rules.
- See more information about the SentinelHealth and SentinelAudit table schemas.


