Note
Access to this page requires authorization. You can try signing in or changing directories.
Access to this page requires authorization. You can try changing directories.
A Microsoft Sentinel custom graph solution is a notebook-based solution that defines nodes and edges from Microsoft Sentinel data lake tables, builds a graph, and lets users query that graph with Graph Query Language (GQL).
Use this guide to build, test, materialize, package, and publish a custom graph solution as a SaaS offer in Microsoft Partner Center so customers can discover it in Microsoft Security Store.
Prerequisites
You must be onboarded to the data lake to create Custom Graph solutions. For more information, see How to onboard to the Microsoft Sentinel data lake.
Permissions
The following table lists the required permissions for each operation or scope in this guide.
| Operation | Required role |
|---|---|
| Onboarding to the Sentinel data lake | Microsoft Entra ID - Security Administrator or Global Administrator |
| Onboard Sentinel workspace to Defender portal | Subscription Owner, or User Access Administrator at subscription scope and Microsoft Sentinel Contributor at subscription or resource group scope |
| Onboard Sentinel workspace to Data Lake | Subscription Owner or Microsoft Sentinel Contributor at subscription or resource group scope |
| Model and build a notebook graph | Custom Microsoft Defender XDR unified RBAC role with data (manage) permission over the Microsoft Sentinel data collection |
| Persist (materialize) a graph | Security Operator, Security Administrator, or Global Administrator |
| Query a persisted graph | Custom Microsoft Defender XDR unified RBAC role with security data basics (read) over the Microsoft Sentinel data collection |
| Publishing Custom Graph solution | Marketplace Publisher account on Microsoft Partner Center |
Tools
The following tools are required to build and publish a custom graph solution:
- Visual Studio Code.
- Microsoft Sentinel extension for Visual Studio Code. For more information, see Install Visual Studio Code and the Microsoft Sentinel extension
- Jupyter extension for Visual Studio Code.
- GitHub Copilot extension and a GitHub Copilot Business or Enterprise plan.
- Python 3.10 or later on your local machine.
Tip
Reuse an existing data lake if your tenant is already onboarded for KQL queries, notebooks, or a Security Copilot agent. There is one data lake per tenant. In the Defender portal, go to System > Settings > Microsoft Sentinel > Data lake. If status is Provisioned, skip task 1.
Build workflow
The following workflow outlines the steps to build and publish a custom graph solution.
- Ingest sample data to the tables that your graph models.
- Validate connectivity with a simple notebook.
- Author the custom graph.
- Test the graph notebook.
- Schedule a graph job to materialize the graph.
- Query and visualize the graph from Graph explorer.
- Package and publish the custom graph solution.
Ingest sample data
This task ingests Microsoft Entra ID asset tables used by the sample graph in this guide: EntraUsers, EntraGroups, EntraServicePrincipals, and EntraMembers.
- In the Defender portal, go to System > Settings > Microsoft Sentinel > Data connectors.
- Enable the Microsoft Entra ID connector so Entra asset tables are ingested into the data lake. For more information, see Asset data ingestion in the Microsoft Sentinel data lake
- Confirm these tables appear in the data lake explorer:
EntraUsersEntraGroupsEntraServicePrincipalsEntraMembers
- These tables land in the System tables workspace.
- Optional: ingest other connectors and replace table names in later steps if your scenario uses different data.
Note
If a table doesn't appear in the data lake explorer, you can't use it for graph authoring, and AI assistance won't reference it.
Validate connectivity with a simple notebook
Create and run a minimal notebook to verify data lake connectivity before graph authoring.
Open Visual Studio Code and sign in to the Microsoft Sentinel extension with the same account that has access to the data lake.
In Visual Studio Code, under Sentinel Extension–Graphs select Create new notebook.
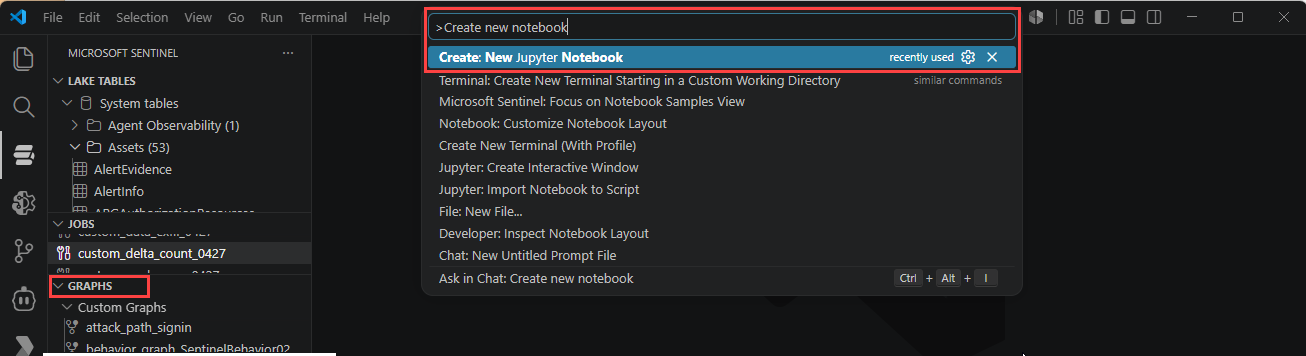
Save the notebook, for example
hello-world-show-tables.ipynb.Select Select kernel, select Microsoft Sentinel and select an available spark pool.
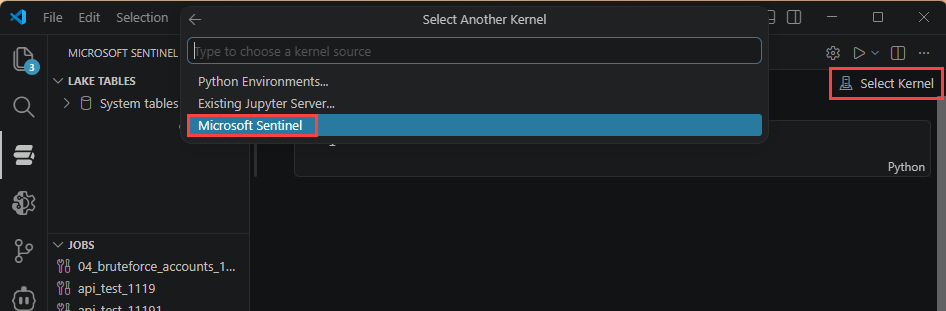
Add the following cells in order.
Cell 1 - Markdown:
# Hello World: Show Tables
A minimal connectivity test for the Microsoft Sentinel data lake.
If every cell below runs without error, your environment is ready
to author custom graphs.
Steps:
1. Connect to the data lake with the Microsoft Sentinel provider
2. Point at your workspace
3. Read a table and show a few rows
Cell 2 - Code (connect and set your workspace):
from sentinel_lake.providers import MicrosoftSentinelProvider
# The provider gives the notebook access to data lake tables.
lake_provider = MicrosoftSentinelProvider(spark=spark)
# >>> ADD YOUR WORKSPACE HERE <<<
# Replace with the Log Analytics workspace that holds your tables.
# Entra asset tables (EntraUsers, EntraGroups, ...) live in "System tables".
LOG_ANALYTICS_WORKSPACE = "System tables"
print(f"Using workspace: {LOG_ANALYTICS_WORKSPACE}")
Cell 3 - Markdown:
## Read a table and show rows
Reading a known table is the fastest way to confirm the extension
can reach the lake with your permissions. Swap EntraGroups for any
table that exists in your workspace.
Cell 4 - Code (read a table and show rows):
# Read a table from the data lake into a Spark DataFrame.
df_groups = lake_provider.read_table("EntraGroups", LOG_ANALYTICS_WORKSPACE)
# Show a sample. .df exposes the underlying Spark DataFrame.
df_groups.df.select("id", "displayName", "mailEnabled").show(20, truncate=False)
Cell 5 - Code (optional sanity counts):
# Confirm the read returned data and inspect the schema.
print("Row count:", df_groups.df.count())
df_groups.df.printSchema()
- Run all cells top to bottom.
- Confirm every cell completes without a red traceback, table preview data appears, and row count is non-zero.
Note
If reads fail or return no rows, confirm the connector from the Ingest sample data section has completed its first snapshot, LOG_ANALYTICS_WORKSPACE matches a real workspace, and your account has read access. Check table contents with KQL in the Defender portal to confirm data is present. For more information, see Run KQL queries on the Microsoft Sentinel data lake.
Author the custom graph
Author in one of these ways:
- AI-assisted graph authoring.
- Author by hand.
AI-assisted graph authoring
To author a graph with AI assistance, follow these steps:
In Visual Studio Code, open GitHub Copilot Chat.
Start your prompt with the graph-authoring helper
@sentinel /graph-authoringand describe your graph in plain language:@sentinel /graph-authoring Create a graph that maps Entra groups to their member users, groups, and service principals using EntraGroups, EntraUsers, EntraServicePrincipals, and EntraMembers from the "System tables" workspace.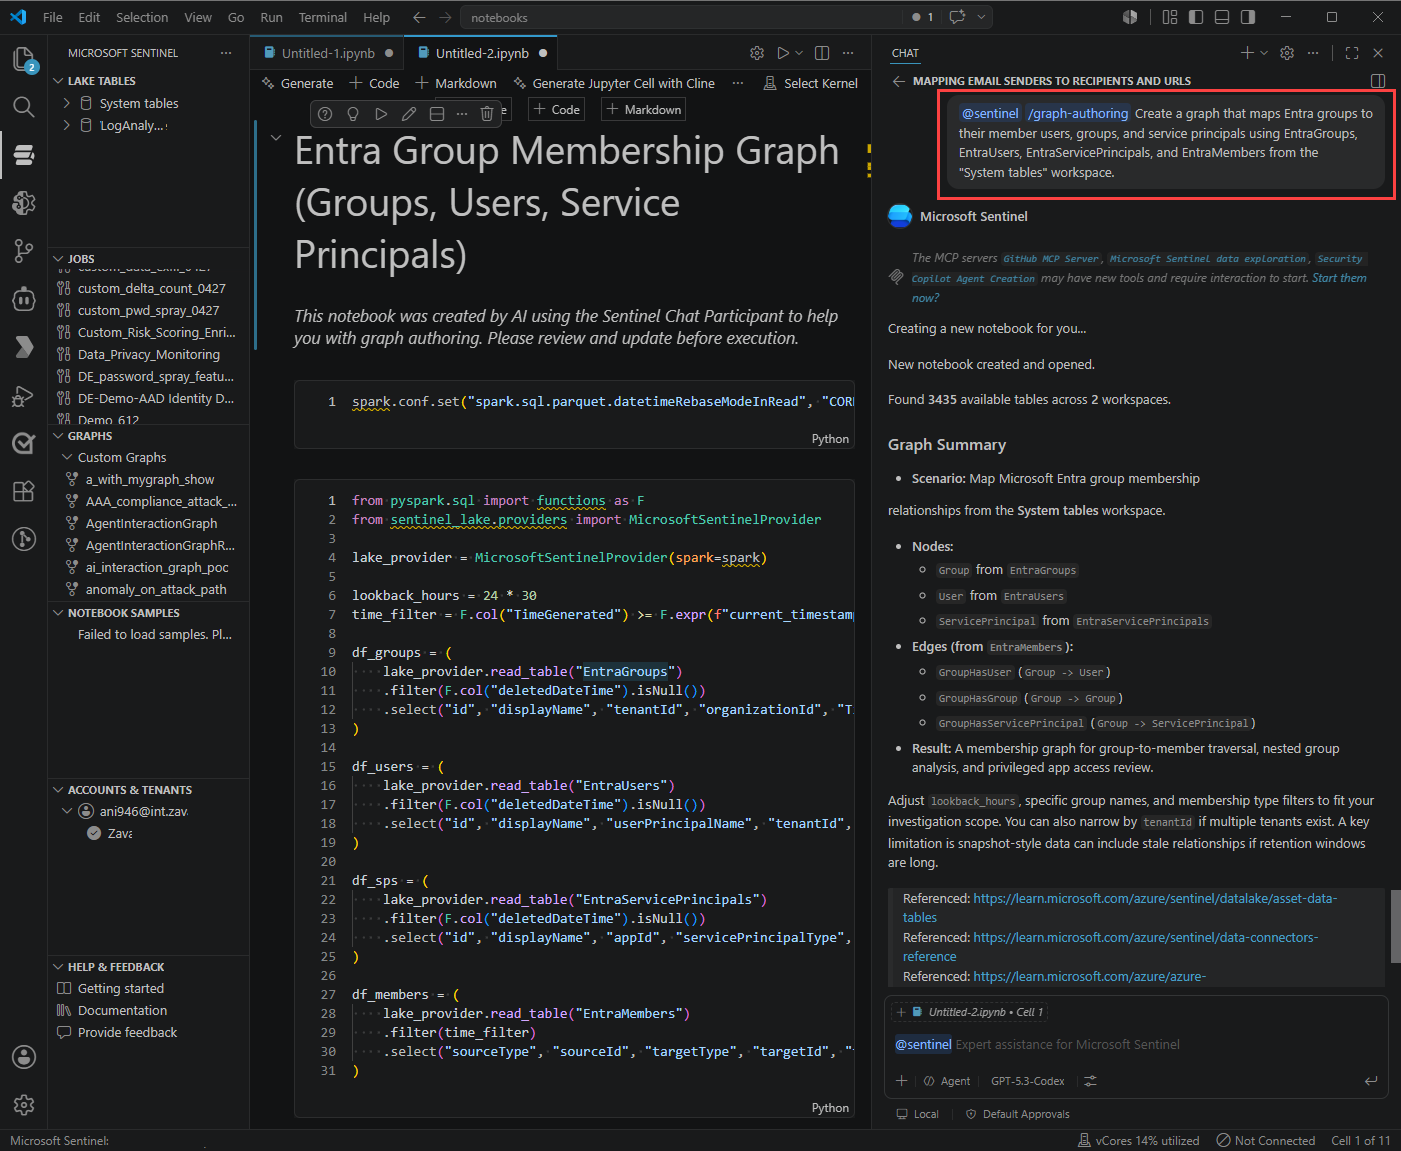
Copilot generates the following cells for the graph authoring lifecycle:
Lifecycle stage Generated output Environment setup Verifies required packages and connection information Data loading Reads named tables from Sentinel data lake Data transformation Prepares node and edge data Graph schema Defines nodes and edges Schema validation Validates the graph definition Graph build Materializes the graph for the session Graph query Runs a sample GQL query and visualizes the result Continue refining the notebook with prompts like these:
Goal Prompt Add a relationship @sentinel Add an edge from User to IPAddressFilter data @sentinel Filter the data to show only failed sign-insChange time range @sentinel Change the time range to the last 7 daysFix build error @sentinel Fix the error in the graph build stepUnderstand code @sentinel Explain how edge keys are definedLook up an API without editing What parameters does build_graph_with_data() accept? #sentinel
Tip
Use @sentinel /graph-authoring to create or modify notebook cells. If you need API explanations or sample queries, ask Copilot and include #Sentinel for Sentinel-specific answers.
Author by hand
To author a graph manually, follow these steps:
Connect and read asset tables.
from pyspark.sql import functions as F
from sentinel_lake.providers import MicrosoftSentinelProvider
lake_provider = MicrosoftSentinelProvider(spark=spark)
# Entra asset tables live in the "System tables" workspace.
# If your data is elsewhere, update this and ensure the tables exist.
LOG_ANALYTICS_WORKSPACE = "System tables"
# Use the latest snapshot of EntraUsers as the point-in-time for all tables.
snapshot_time = (
    lake_provider.read_table("EntraUsers", LOG_ANALYTICS_WORKSPACE)
    .df.agg(F.max("_SnapshotTime").alias("max_snapshot"))
    .collect()[0]["max_snapshot"]
    .strftime("%Y-%m-%dT%H:%M:%SZ")
)
print(f"Using snapshot_time: {snapshot_time}")
snapshot_filter = (F.col("_SnapshotTime") == F.lit(snapshot_time).cast("timestamp"))
# Edges: group contains user / group / servicePrincipal
df_members = (
    lake_provider.read_table("EntraMembers", LOG_ANALYTICS_WORKSPACE)
    .filter(
        snapshot_filter
        & (F.col("sourceType") == "group")
        & (F.col("targetType").isin("user", "group", "servicePrincipal"))
    )
)
# Nodes
df_groups = (
    lake_provider.read_table("EntraGroups", LOG_ANALYTICS_WORKSPACE)
    .filter(snapshot_filter)
    .select("id", "displayName", "mailEnabled")
)
df_users = (
    lake_provider.read_table("EntraUsers", LOG_ANALYTICS_WORKSPACE)
    .filter(snapshot_filter)
    .select("id", "accountEnabled", "displayName", "department",
            "userPrincipalName", "usageLocation")
)
Prepare node and edge DataFrames.
# NODES
user_nodes = df_users.df.select(
    "id", "displayName", "accountEnabled", "department",
    "userPrincipalName", "usageLocation")
group_nodes = df_groups.df.select("id", "displayName", "mailEnabled")
# EDGES
edge_group_contains_user = (
    df_members.df.filter(F.col("targetType") == "user")
    .select(F.col("sourceId").alias("SourceGroupId"),
            F.col("targetId").alias("TargetUserId"))
    .distinct()
    .withColumn("EdgeKey", F.concat_ws("_", F.col("SourceGroupId"), F.col("TargetUserId")))
)
edge_group_contains_group = (
    df_members.df.filter(F.col("targetType") == "group")
    .select(F.col("sourceId").alias("SourceGroupId"),
            F.col("targetId").alias("TargetGroupId"))
    .distinct()
    .withColumn("EdgeKey", F.concat_ws("_", F.col("SourceGroupId"), F.col("TargetGroupId")))
)
Define graph schema and bind DataFrames.
from sentinel_graph import GraphSpecBuilder, Graph
entra_group_graph_spec = (
    GraphSpecBuilder.start()
    # === NODES ===
    .add_node("EntraUser").from_dataframe(user_nodes)
    .with_columns("id", "displayName", "accountEnabled", "department",
                  "userPrincipalName", "usageLocation",
                  key="id", display="displayName")
    .add_node("EntraGroup").from_dataframe(group_nodes)
    .with_columns("id", "displayName", "mailEnabled",
                  key="id", display="displayName")
    # === EDGES ===
    .add_edge("ContainsUser").from_dataframe(edge_group_contains_user)
    .source(id_column="SourceGroupId", node_type="EntraGroup")
    .target(id_column="TargetUserId", node_type="EntraUser")
    .with_columns("SourceGroupId", "TargetUserId", "EdgeKey",
                  key="EdgeKey", display="EdgeKey")
    .add_edge("ContainsGroup").from_dataframe(edge_group_contains_group)
    .source(id_column="SourceGroupId", node_type="EntraGroup")
    .target(id_column="TargetGroupId", node_type="EntraGroup")
    .with_columns("SourceGroupId", "TargetGroupId", "EdgeKey",
                  key="EdgeKey", display="EdgeKey")
).done()
# Validate the schema before building.
entra_group_graph_spec.show_schema()
Build the graph.
# Build = prepare data + publish for the session.
entra_group_graph = Graph.build(entra_group_graph_spec)
print(entra_group_graph.build_status.status)   # "published" or "prepared"
Note
Graph.build()prepares data and publishes in one call. To inspect prepared nodes and edges before publish, callGraph.prepare(spec), reviewgraph.nodesandgraph.edges, then callgraph.publish().Run a GQL query.
# Find nested group relationships up to 8 levels deep.
# Update the Entra Group name that you want to traverse from

query_nested_groups = """
MATCH p=(g1:EntraGroup)-[cg]->{1,8}(g2)
WHERE g1.displayName = 'tmplevel3'
RETURN *
"""
entra_group_graph.query(query_nested_groups).show()
Test the graph notebook
Test the notebook to ensure it produces the expected graph output:
Restart the kernel and run all cells top to bottom.
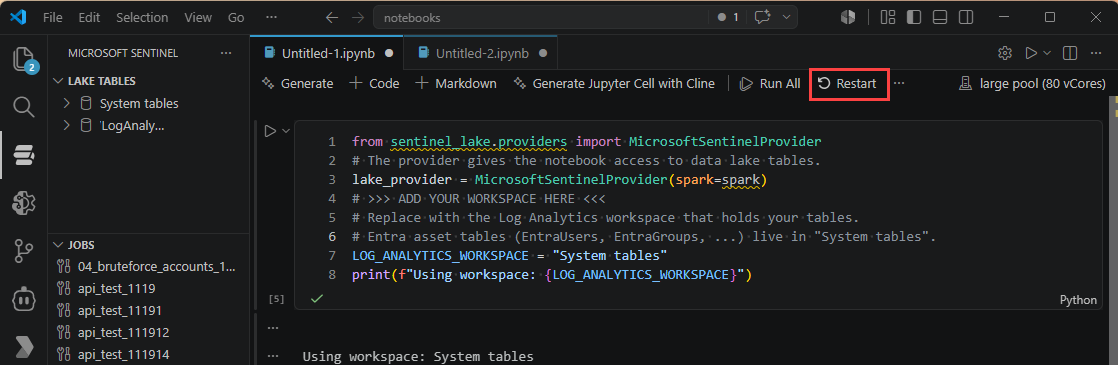
Confirm each cell completes successfully.
If transform cells run longer than 5 minutes on a small pool, tighten snapshot filters and column projection before scaling up.
Confirm
show_schema()returns expected nodes and edges.Run a sample GQL query and verify visualization and tabular output.
Validate edge cases:
- Empty input.
- Schema drift.
- Missing table access.
Tip
Add markdown cells above each code section to document purpose, inputs, outputs, and the nodes or edges produced.
Schedule a graph job to materialize the graph
Graphs created in an interactive session are ephemeral. Schedule a graph job to persist and refresh the graph. For more information, see Schedule and manage Microsoft Sentinel graph jobs.
In your graph notebook, select Create Scheduled Job > Create a graph job.
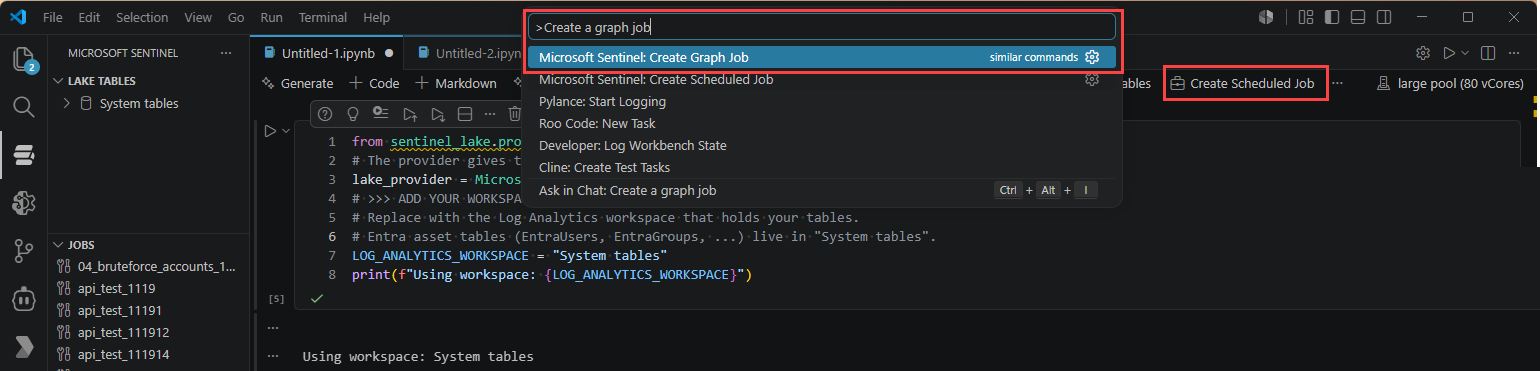
Enter graph Name and Description, and verify the notebook path.
Select a schedule:
- On demand: builds once, with a default 30-day retention.
- Scheduled: select repeat cadence and start/end times.
Select Submit.
Open the graph in the Sentinel extension and monitor Job Details.
Use Run Now to run outside schedule as needed.
Confirm status progression from
QueuedtoIn ProgresstoReady.
Important
Submitted jobs are decoupled from your local notebook. Editing the local .ipynb doesn't update the scheduled job. To update a job notebook, download it from the Graphs panel, edit it, then use Edit job > Submit.
Query and visualize from Graph explorer
After the graph job status is Ready, query and visualize in the Defender portal, notebooks, and REST APIs.
- In the Defender portal under Microsoft Sentinel, open graph experience and select your materialized graph.
- Run GQL queries, inspect schema, switch visual and tabular outputs, and traverse next hop.
- Use this GQL quick reference:
| Pattern or clause | Example |
|---|---|
| Node with label | (g:EntraGroup) |
| Typed, directed edge | -[c:ContainsUser]-> |
| Variable-length path (1 to 8 hops) | (a)-[e]->{1,8}(b) |
| Filter | WHERE g.displayName = 'Finance Admins' |
| Project, sort, limit | RETURN g.displayName ORDER BY g.displayName LIMIT 10 |
| Label expressions | (:EntraUser \| EntraServicePrincipal) |
Note
Every GQL query starts with MATCH. The engine operates in UTC. Use ZONED_DATETIME(...) for datetime literals. INSERT and CREATE aren't supported. Graphs are read-only.
Query from a notebook.
from sentinel_graph import Graph
# Attach to an already-materialized graph by name.
graph = Graph.get("entra_group_membership")
graph.query("MATCH (g:EntraGroup)-[c:ContainsUser]->(u:EntraUser) RETURN g, c, u").show()
# Purpose-built security algorithms are available too:
graph.blast_radius(source_property_value="Finance Admins", min_hop_count=1).show()
Query by using Graph REST APIs.
GET https://api.securityplatform.microsoft.com/graphs/graph-instances?graphTypes=Custom
Authorization: Bearer <access_token>
POST https://api.securityplatform.microsoft.com/graphs/graph-instances/{graphName}/query Authorization: Bearer <access_token> Content-Type: application/json { "query": "MATCH (g:EntraGroup)-[c:ContainsUser]->(u) RETURN g, c, u LIMIT 100", "responseFormats": ["Table", "Graph"], "queryLanguage": "GQL" }
responseFormats controls output shape. "Table" returns rows, "Graph" returns nodes and edges, and ["Table", "Graph"] returns both.
For more information, see Graph REST APIs for custom graphs.
Package and publish your graph solution
Once your graph is tested and materialized, package it for deployment to customers. For detailed packaging instructions, see Package and publish Microsoft Sentinel graph and notebook solutions.
Troubleshooting
Use the following tables to diagnose common issues by symptom.
Graph authoring
| Symptom | Likely cause and fix |
|---|---|
MicrosoftSentinelProvider or sentinel_graph not found |
Sign in again to the extension and confirm a Microsoft Sentinel kernel is selected. |
| Cell hangs at "Starting Spark session" | First startup can take 3 to 5 minutes. If it exceeds 6 minutes, check pool capacity and retry. |
show_schema() is empty or Graph.build() fails |
Confirm key and display columns exist and are non-null, and source and target node_type values match node aliases. |
| GQL query returns no rows | Confirm filter values exist in the selected snapshot and verify snapshot filtering. |
publish() fails with permission denied |
Confirm you have Security Operator, Security Administrator, or Global Administrator role. |
AI-assisted authoring
| Symptom | Likely cause and fix |
|---|---|
@sentinel /graph-authoring does nothing |
Confirm GitHub Copilot and Jupyter extensions are installed and active, and you have a Copilot Business or Enterprise plan. |
| Generated code references a missing table | Confirm connector setup and verify the table appears in the data lake explorer. |
Job scheduling
| Symptom | Likely cause and fix |
|---|---|
| Local notebook edits aren't reflected in the job | Download the job notebook from Graphs panel, edit it, then use Edit job > Submit. |
| Materialized graph disappeared | On-demand graphs have 30-day retention. Schedule a recurring job or run a new build. |
Related content
- Custom graphs in Microsoft Sentinel overview
- Get started with custom graphs
- AI-assisted custom graph authoring
- Microsoft Sentinel graph provider reference
- GQL reference for Sentinel custom graph
- Graph REST APIs for custom graphs
- Onboard to Microsoft Sentinel data lake
- Run notebooks on Microsoft Sentinel data lake
- Publish a Security Copilot agent or analytics solution in Security Store
- Microsoft Partner Center