Monitor the health of your automation rules and playbooks
To ensure proper functioning and performance of your security orchestration, automation, and response operations in your Microsoft Sentinel service, keep track of the health of your automation rules and playbooks by monitoring their execution logs.
Set up notifications of health events for relevant stakeholders, who can then take action. For example, define and send email or Microsoft Teams messages, create new tickets in your ticketing system, and so on.
This article describes how to use Microsoft Sentinel's health monitoring features to keep track of your automation rules and playbooks's health from within Microsoft Sentinel. For more information, see Auditing and health monitoring in Microsoft Sentinel.
Use the SentinelHealth data table (Public preview)
To get automation health data from the SentinelHealth data table, first turn on the Microsoft Sentinel health feature for your workspace. For more information, see Turn on health monitoring for Microsoft Sentinel.
Once the health feature is turned on, the SentinelHealth data table is created at the first success or failure event generated for your automation rules and playbooks.
Understanding SentinelHealth table events
The following types of automation health events are logged in the SentinelHealth table:
Automation rule run. Logged whenever an automation rule's conditions are met, causing it to run. Besides the fields in the basic SentinelHealth table, these events will include extended properties unique to the running of automation rules, including a list of the playbooks called by the rule. The following sample query will display these events:
SentinelHealth
| where OperationName == "Automation rule run"
Playbook was triggered. Logged whenever a playbook is triggered on an incident manually from the portal or through the API. Besides the fields in the basic SentinelHealth table, these events will include extended properties unique to the manual triggering of playbooks. The following sample query will display these events:
SentinelHealth
| where OperationName == "Playbook was triggered"
For more information, see SentinelHealth table columns schema.
Statuses, errors and suggested steps
For the Automation rule run status, you may see the following statuses:
Success: rule executed successfully, triggering all actions.
Partial success: rule executed and triggered at least one action, but some actions failed.
Failure: automation rule did not run any action due to one of the following reasons:
- Conditions evaluation failed.
- Conditions met, but the first action failed.
For the Playbook was triggered status, you may see the following statuses:
Success: playbook was triggered successfully.
Failure: playbook could not be triggered.
Note
Success means only that the automation rule successfully triggered a playbook. It doesn't tell you when the playbook started or ended, the results of the actions in the playbook, or the final result of the playbook.
To find this information, query the Logic Apps diagnostics logs. For more information, see Get the complete automation picture.
Error descriptions and suggested actions
| Error description | Suggested actions |
|---|---|
| Could not add task: <TaskName>. Incident/alert was not found. |
Make sure the incident/alert exists and try again. |
| Could not modify property: <PropertyName>. Incident/alert was not found. |
Make sure the incident/alert exists and try again. |
| Could not modify property: <PropertyName>. Too many requests, exceeding throttling limits. |
|
| Could not trigger playbook: <PlaybookName>. Incident/alert was not found. |
If the error occurred when trying to trigger a playbook on demand, make sure the incident/alert exists and try again. |
| Could not trigger playbook: <PlaybookName>. Either the playbook was not found, or Microsoft Sentinel was missing permissions on it. |
Edit the automation rule, find and select the playbook in its new location, and save. Make sure Microsoft Sentinel has permission to run this playbook. |
| Could not trigger playbook: <PlaybookName>. Contains an unsupported trigger type. |
Make sure your playbook starts with the correct Logic Apps trigger: Microsoft Sentinel Incident or Microsoft Sentinel Alert. |
| Could not trigger playbook: <PlaybookName>. The subscription is disabled and marked as read-only. Playbooks in this subscription cannot be run until the subscription is re-enabled. |
Re-enable the Azure subscription in which the playbook is located. |
| Could not trigger playbook: <PlaybookName>. The playbook was disabled. |
Enable your playbook, in Microsoft Sentinel in the Active Playbooks tab under Automation, or in the Logic Apps resource page. |
| Could not trigger playbook: <PlaybookName>. Invalid template definition. |
There is an error in the playbook definition. Go to the Logic Apps designer to fix the issues and save the playbook. |
| Could not trigger playbook: <PlaybookName>. Access control configuration restricts Microsoft Sentinel. |
Logic Apps configurations allow restricting access to trigger the playbook. This restriction is in effect for this playbook. Remove this restriction so Microsoft Sentinel is not blocked. Learn more |
| Could not trigger playbook: <PlaybookName>. Microsoft Sentinel is missing permissions to run it. |
Microsoft Sentinel requires permissions to run playbooks. |
| Could not trigger playbook: <PlaybookName>. Playbook wasn’t migrated to new permissions model. Grant Microsoft Sentinel permissions to run this playbook and resave the rule. |
Grant Microsoft Sentinel permissions to run this playbook and resave the rule. |
| Could not trigger playbook: <PlaybookName>. Too many requests, exceeding workflow throttling limits. |
The number of waiting workflow runs has exceeded the maximum allowed limit. Try increasing the value of 'maximumWaitingRuns' in trigger concurrency configuration. |
| Could not trigger playbook: <PlaybookName>. Too many requests, exceeding throttling limits. |
Learn more about subscription and tenant limits. |
| Could not trigger playbook: <PlaybookName>. Access was forbidden. Managed identity is missing configuration or Logic Apps network restriction has been set. |
If the playbook uses managed identity, make sure the managed identity was assigned with permissions. The playbook may have network restriction rules preventing it from being triggered as they block Microsoft Sentinel service. |
| Could not trigger playbook: <PlaybookName>. The subscription or resource group was locked. |
Remove the lock to allow Microsoft Sentinel trigger playbooks in the locked scope. Learn more about locked resources. |
| Could not trigger playbook: <PlaybookName>. Caller is missing required playbook-triggering permissions on playbook, or Microsoft Sentinel is missing permissions on it. |
The user trying to trigger the playbook on demand is missing Logic Apps Contributor role on the playbook or to trigger the playbook. Learn more |
| Could not trigger playbook: <PlaybookName>. Invalid credentials in connection. |
Check the credentials your connection is using in the API connections service in the Azure portal. |
| Could not trigger playbook: <PlaybookName>. Playbook ARM ID is not valid. |
Get the complete automation picture
Microsoft Sentinel's health monitoring table allows you to track when playbooks are triggered, but to monitor what happens inside your playbooks and their results when they're run, you must also turn on diagnostics in Azure Logic Apps to ingest the following events to the AzureDiagnostics table:
- {Action name} started
- {Action name} ended
- Workflow (playbook) started
- Workflow (playbook) ended
These added events provide additional insights into the actions being taken in your playbooks.
Turn on Azure Logic Apps diagnostics
For each playbook you are interested in monitoring, enable Log Analytics for your logic app. Make sure to select Send to Log Analytics workspace as your log destination, and choose your Microsoft Sentinel workspace.
Correlate Microsoft Sentinel and Azure Logic Apps logs
Now that you have logs for your automation rules and playbooks and logs for your individual Logic Apps workflows in your workspace, you can correlate them to get the complete picture. Consider the following sample query:
SentinelHealth
| where SentinelResourceType == "Automation rule"
| mv-expand TriggeredPlaybooks = ExtendedProperties.TriggeredPlaybooks
| extend runId = tostring(TriggeredPlaybooks.RunId)
| join (AzureDiagnostics
    | where OperationName == "Microsoft.Logic/workflows/workflowRunCompleted"
    | project
        resource_runId_s,
        playbookName = resource_workflowName_s,
        playbookRunStatus = status_s)
    on $left.runId == $right.resource_runId_s
| project
    RecordId,
    TimeGenerated,
    AutomationRuleName= SentinelResourceName,
    AutomationRuleStatus = Status,
    Description,
    workflowRunId = runId,
    playbookName,
    playbookRunStatus
Use the health monitoring workbook
The Automation health workbook helps you visualize your health data, as well as the correlation between the two types of logs that we just mentioned. The workbook includes the following displays:
- Automation rule health and details
- Playbook trigger health and details
- Playbook runs health and details (requires Azure Diagnostic enabled on the Playbook level)
- Automation details per incident
For example:

Select the Playbooks run by Automation Rules tab to see playbook activity.
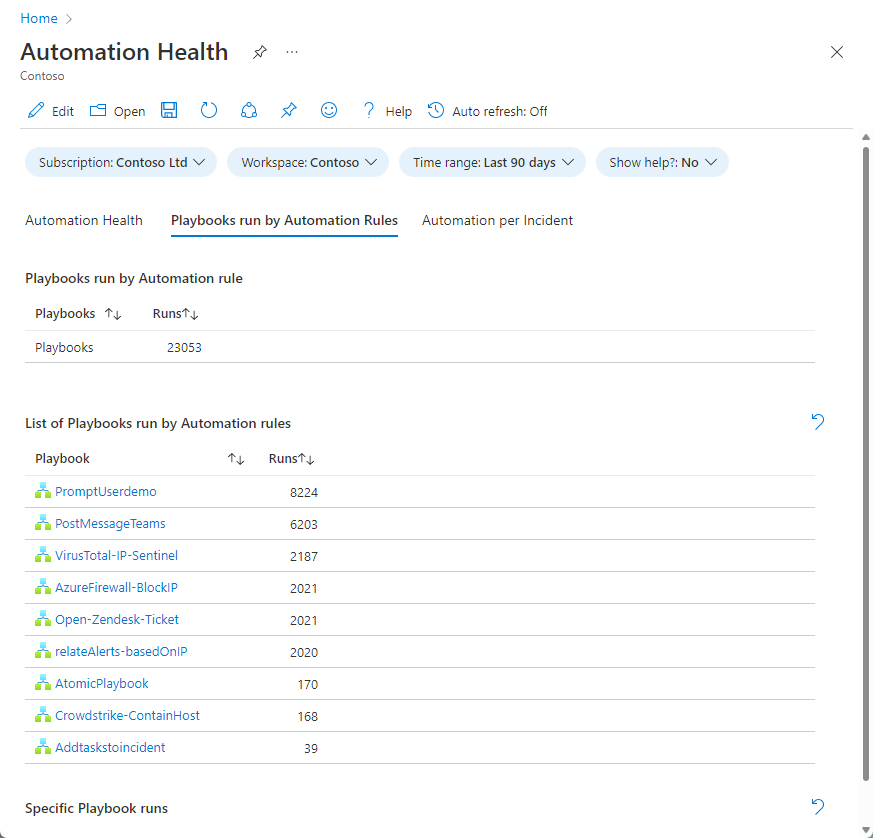
Select a playbook to see the list of its runs in the drill-down chart below.

Select a particular run to see the results of the actions in the playbook.

Next steps
- Learn about auditing and health monitoring in Microsoft Sentinel.
- Turn on auditing and health monitoring in Microsoft Sentinel.
- Monitor the health of your data connectors.
- Monitor the health and integrity of your analytics rules.
- See more information about the SentinelHealth and SentinelAudit table schemas.
Feedback
Coming soon: Throughout 2024 we will be phasing out GitHub Issues as the feedback mechanism for content and replacing it with a new feedback system. For more information see: https://aka.ms/ContentUserFeedback.
Submit and view feedback for