Optimize application observability for Azure Spring Apps
Note
The Basic, Standard, and Enterprise plans will be deprecated starting from mid-March, 2025, with a 3 year retirement period. We recommend transitioning to Azure Container Apps. For more information, see the Azure Spring Apps retirement announcement.
The Standard consumption and dedicated plan will be deprecated starting September 30, 2024, with a complete shutdown after six months. We recommend transitioning to Azure Container Apps. For more information, see Migrate Azure Spring Apps Standard consumption and dedicated plan to Azure Container Apps.
This article applies to: ✅ Java ❎ C#
This article applies to:
❎ Standard consumption and dedicated (Preview) ✅ Basic/Standard ❎ Enterprise
This article shows you how to observe your production applications deployed on Azure Spring Apps and diagnose and investigate production issues. Observability is the ability to collect insights, analytics, and actionable intelligence through the logs, metrics, traces, and alerts.
To find out if your applications meet expectations and to discover and predict issues in all applications, focus on the following areas:
- Availability: Check that the application is available and accessible to the user.
- Reliability: Check that the application is reliable and can be used normally.
- Failure: Understand that the application isn't working properly and further fixes are required.
- Performance: Understand which performance issues the application encounters that need further attention and find out the root cause of the problem.
- Alerts: Know the current state of the application. Proactively notify others and take necessary actions when the application isn't working properly.
This article uses the well-known PetClinic sample app as the production application. For more information on how to deploy PetClinic to Azure Spring Apps and use MySQL as the persistent store, see the following articles:
- Deploy microservice applications to Azure Spring Apps
- Integrate Azure Spring Apps with Azure Database for MySQL
Log Analytics and Application Insights are deeply integrated with Azure Spring Apps. You can use Log Analytics to diagnose your application with various log queries and use Application Insights to investigate production issues. For more information, see the following articles:
Prerequisites
- An Azure subscription. If you don't have an Azure subscription, create an Azure free account before you begin.
Monitor the application
Azure Spring Apps provides several metrics by default, including metrics on availability, performance, HTTP requests, database connections, and more. These metrics are important to clarify goals, find improvements, and formulate specific improvement measures. For more information, see Metrics for Azure Spring Apps.
This section shows you how to use metrics with your application and monitor the metrics in an Azure dashboard using the key metrics charts generated by Azure Spring Apps and Application Insights.
Add metrics to monitor resource utilization
This section explains how to use the default metrics defined by Spring Boot and custom metrics defined in the application code. These metrics are available for applications running on Azure Spring Apps.
Add metrics defined by Spring Boot
Spring Boot registers several metrics, such as JVM, web server, and logging-related metrics. The following steps show you how to add JVM Memory as an example, but to add other metrics defined by Spring Boot, you can use the same steps.
Go to the Azure Spring Apps instance overview page.
On the navigation menu, select Application Insights to go to the Application Insights overview page.
On the navigation menu, select Metrics, select the edit icon in the chart title, and then rename the chart title to JVM Memory Used.
Select Add metric. For Metric, open the corresponding dropdown list and select jvm_memory_used under the Log-based metrics namespace. For Aggregation, select Avg.
Select Apply splitting. For Values, open the corresponding dropdown list, and then select Cloud role name.

Note
The metrics are available after the application is deployed and running.
Add custom metrics defined in application code
In the PetClinic source code, the REST controllers are annotated with the micrometer @Timed annotation. This annotation collects metrics like the number of times a method is called or the execution time of a method.
The following list shows the custom metrics details:
petclinic.ownerandpetclinic.petare defined in thecustomers-serviceapplication.petclinic.visitis defined in thevisits-serviceapplication.
You can define a REST API access chart with custom metrics and update the Aggregation to Count for each metric.

Monitor the availability of the application
The availability or liveness of an application is determined using the Spring Boot Actuator. To check the liveness for each app on Azure Spring Apps, use the following steps:
Go to the Azure Spring Apps instance overview page.
On the navigation menu, select Application Insights to go to the Application Insights overview page.
Select Availability, and then select Add Standard test to add a test.
On the Create Standard test page, provide the following information:
- Test name: Enter api-gateway for the API gateway app.
- URL: Enter https://<your-Azure-Spring-Apps-instance-name>-api-gateway.azuremicroservices.io/actuator/health/liveness for the corresponding URL.
- Success criteria: Extend the option.
- Content match: Select the checkbox.
- Content must contain: Enter UP.
Select Save to finish the configuration.
Use the following table to add other tests with these test names and URLs. Make sure the test name and app name are consistent.
Test name URL Content must contain admin-serverhttps://<your-Azure-Spring-Apps-instance-name>-admin-server.azuremicroservices.io/actuator/health/livenessUPcustomers-servicehttps://<your-Azure-Spring-Apps-instance-name>-api-gateway.azuremicroservices.io/api/customer/actuator/health/livenessUPvets-servicehttps://<your-Azure-Spring-Apps-instance-name>-api-gateway.azuremicroservices.io/api/vet/actuator/health/livenessUPvisits-servicehttps://<your-Azure-Spring-Apps-instance-name>-api-gateway.azuremicroservices.io/api/visit/actuator/health/livenessUP
Monitor the dashboard
A dashboard is a cognitive awareness and communication tool designed to help you visually identify trends, patterns, and anomalies, reason about what you see, and make effective decisions. It can aggregate various metric charts, quick links, and other important information.
Use the following steps to create a custom dashboard and pin various quickstart panes and metrics charts to the dashboard. If you choose to use the built-in dashboard for Application Insights created by Azure Spring Apps, you can skip creating the dashboard and customizing the dashboard chart. For more information, see Application Insights Overview dashboard.
Note
You can also choose a wizard based on Application Insights to quickly create a default dashboard.
From the Azure portal menu, select Dashboard. Your default view might already be set to dashboard.
Select Create, and then select Custom to create a custom dashboard.
Enter a name for the dashboard, and then select Save.
This action opens the Tile Gallery page, from which you can select the tiles, and an empty grid where you can arrange the tiles.
Note
You can allow other users to view your dashboard using a shared dashboard. For more information, see Share an Azure dashboard.
Basic monitoring
The most fundamental metrics for an application, especially a microservices application, are CPU usage, memory usage, liveness detection, and network traffic. These metrics provide an important basis for evaluating application scalability.
Use the following instructions to pin the various charts to the dashboard. These steps are similar for each chart. For some charts, additional instructions are provided.
Pin the "App CPU Usage" chart
To pin the "App CPU Usage" chart, use the following steps:
Go to the Azure Spring Apps instance overview page.
On the navigation menu, select Metrics, select the edit icon in the chart title, and then rename the chart title to App CPU Usage.
Select Add metric. For Metric, open the corresponding dropdown list and select App CPU Usage. For Aggregation, select Avg.
Select Apply splitting. For Values, open the corresponding dropdown list and then select App.
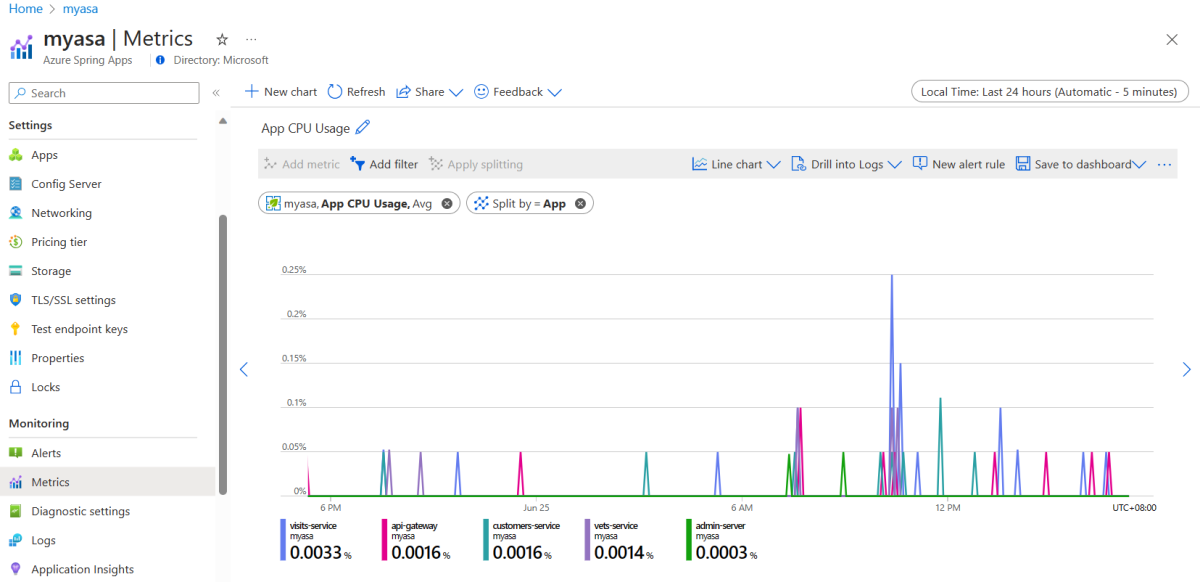
Select Save to dashboard to open the dropdown list, then select Pin to dashboard.
On the Pin to dashboard page, select the dashboard you created, and then select Pin to pin the chart to the dashboard.

Pin the "App Memory Usage" chart
To pin the App Memory Usage chart to the dashboard, use the steps in the previous section.

Pin the "App Network In" chart
To pin the "App Network In" chart, use the steps in the Pin the "App CPU Usage" chart section, but include the following steps:
On the Metrics page, select Add filter.
For Property, open the corresponding dropdown list and then select App.
For Operator, select =.
For Values, select admin-server and api-gateway.

Pin the "Availability" chart
To pin the "Availability" chart, use the following steps:
Go to the Azure Spring Apps instance overview page.
On the navigation menu, select Application Insights to go to the Application Insights overview page.
On the navigation menu, select Metrics, select the edit icon in the chart title, and then rename the chart title to Availability.
Select Add metric.
For Metric, open the corresponding dropdown list and select Availability under the Application Insights standard metrics namespace. Then, for Aggregation, select Avg.
Select Apply splitting. For Values, open the corresponding dropdown, select Test name, and then save the Availability chart to the dashboard.

HTTP request monitoring
The key data recorded in the process of the application serving users includes the number of HTTP requests, response time, abnormal requests, and failed requests. This data can help you find out whether the application is providing services normally, which directly affects the service level of the application.
Pin the "Server exceptions and Dependency call failures" chart
To pin the "Server exceptions and Dependency call failures" chart, use the steps from the Pin the "Availability" chart section. The Server exception and Dependency call failures metrics are under the Application Insights standard metrics namespace.

Pin the "Failed requests" chart
To pin the "Failed requests" chart, use the steps from the Pin the "Availability" chart section. The Failed requests metric is under the Application Insights standard metrics namespace.

Pin the "Request count" chart
To pin the "Request count" chart, use the steps from the Pin the "Availability" chart section, but include the following steps. The Server requests metric is under the Application Insights standard metrics namespace.
Add a filter to filter the Cloud role name with api-gateway and admin-server.
Apply splitting for Values with Cloud role name.

Pin the "Response time" chart
To pin the "Response time" chart, use the steps from the Pin the "Availability" chart section, but add a filter to filter the Cloud role name with api-gateway. The Server response time metric is under the Application Insights standard metrics namespace.

Database performance monitoring
Database performance is the cornerstone of normal service for all applications. There are many application performance downgrades caused by a slow database or exhausted database connection pool. It's necessary to ensure that the performance at the database level meets expectations, otherwise, it causes chained issues.
Pin the "Active MySQL connections" chart
To pin the "Active MySQL connections" chart, use the steps from the Pin the "Availability" chart section. The hikaricp_connection_active metric is under the Log-based metrics namespace.

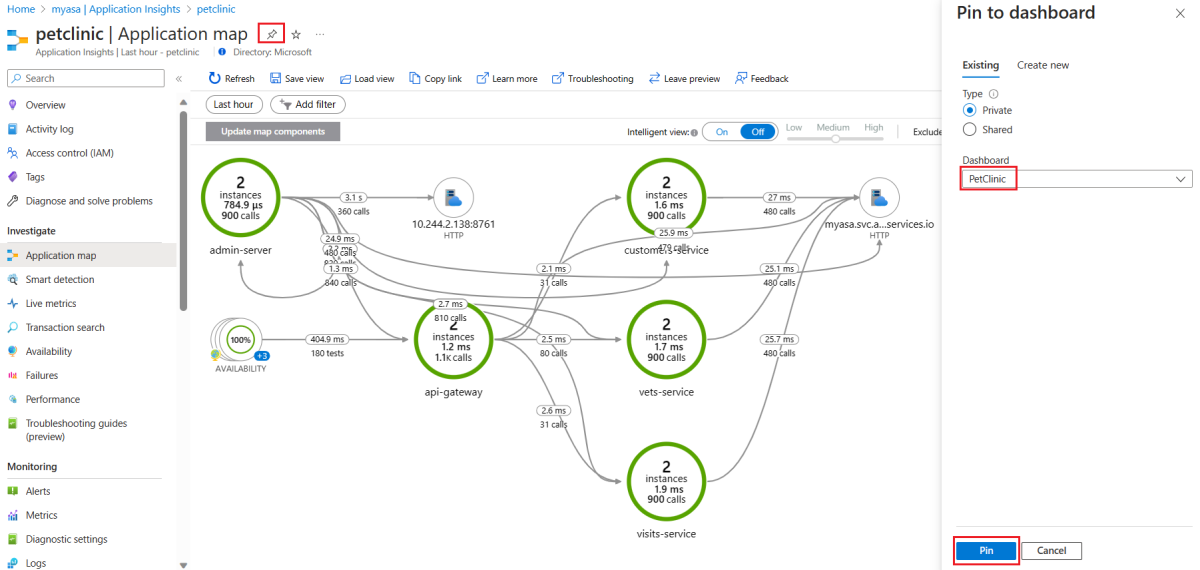
Pin content from a resource page
Pin some commonly used links into the dashboard. These links let you quickly open the operation page on Azure or other resource pages.
To pin common panes of the Azure portal to the dashboard, use the following steps:
Go to the Azure Spring Apps instance overview page.
On the navigation menu, select Application Insights to go to the Application Insights overview page.
On the navigation menu, select Application map, and select the Pin blade to dashboard icon in each page header.
On the Pin to dashboard page, select the dashboard you created, and then select Pin to pin the quickstart chart to the dashboard.
Repeat these steps to pin the Live metrics, Failures, and Performance panes to your dashboard as needed.

View the dashboard
To view the dashboard, go to your private PetClinic dashboard page to edit the tiles in the dashboard for easy monitoring.

Manage alerts
Alerts help you detect and address issues before users notice them by proactively notifying you when the metrics or logs indicate there might be a problem with your infrastructure or application.
This section explains how to set up action groups and alert rules to monitor your production application. The alert rules bind metric patterns with the action groups on the target resource. When the metric pattern matches the condition, then the alert rule activates and executes the associated set of actions.
Set up an action group
To set up an action group, use the following steps:
Go to the Azure Spring Apps instance overview page.
On the navigation menu, select Alert, select Action groups to go to the action groups list page, and then select Create to create an action group.
On the Create action group page, select the subscription and resource group you want to cover. Enter the following information:
- Action group name: Enter email-notification.
- Short name: Enter email.
- Region: Select the region you want to use.
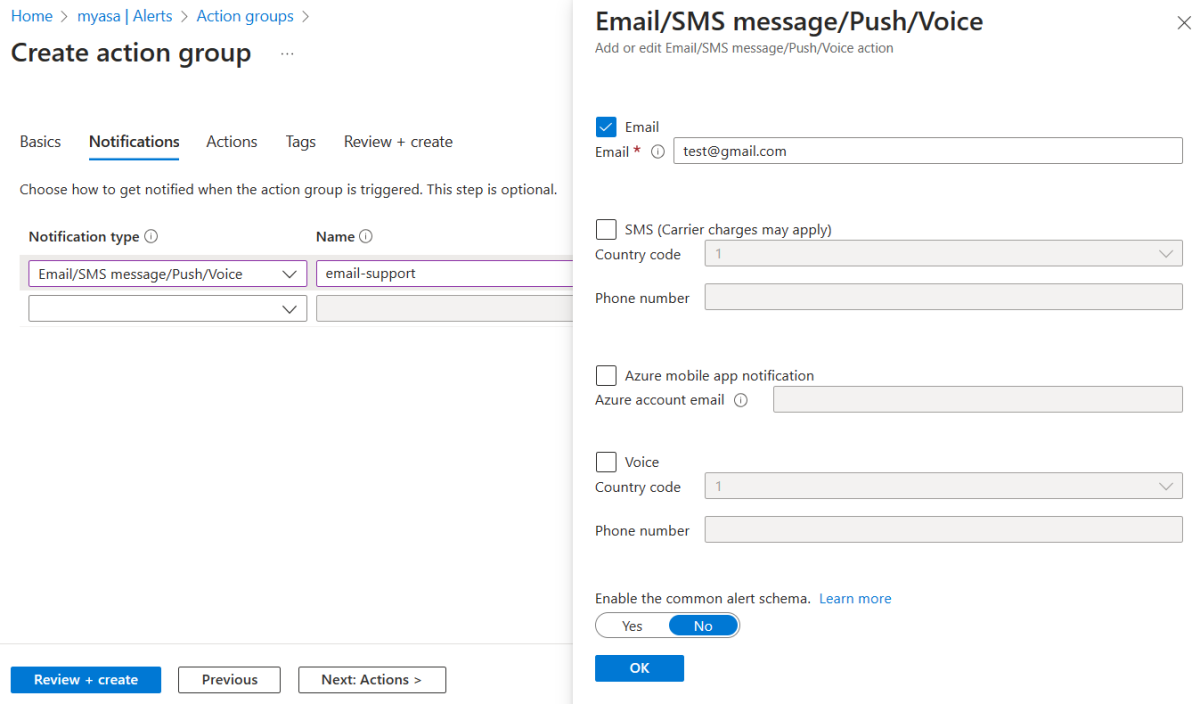
Navigate to the Notification tab on the Create action group page. For Notification type, select Email/SMS message/Push/Voice. For Name, enter email-support.
On the Email/SMS message/Push/Voice page, select Email, enter your production email address, and then select OK to finish the configuration. You can also add other notification types if you want, such as SMS, Azure mobile app notification, Voice, and so on.
Select Review and Create to review your selections. Select Create to create the action group.

Set up an alert rule
To set up an alert rule, use the following steps:
Go to the Azure Spring Apps instance overview page.
On the navigation menu, select Alert, select Alert rules to go to the Alert rules list page, and then select Create to create an alert rule.
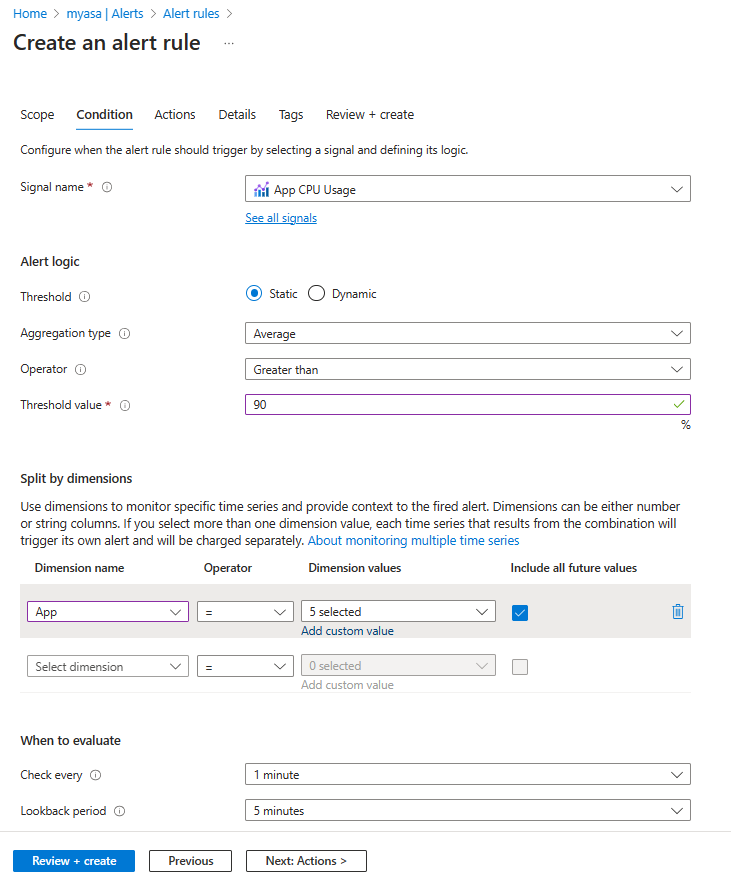
On the Create an alert rule page, for signal name, open the dropdown list, and then select See all signals.
In the Metrics area, select App CPU Usage, and then select Apply.
In the alert logic section, use the following inputs:
- For threshold type, select Static.
- For Aggregation type, select Average.
- For Operator, select Greater than.
- For Threshold value, enter 90.
In the Split by dimensions section, use the following inputs:
- For Dimension name, select App.
- For Operator, use the default =.
- For Dimension values, select Select all.
- For When to evaluate, keep the default value.
Navigate to the Actions tab on the Create an alert rule page, and then select Select action groups.
On the Select action groups page, search for your email action group name, such as email-notification. Select the corresponding action group, and then select Select to finish the configuration.
Navigate to the Details tab on the Create an alert rule page.
For Alert rule name, enter app-cpu-high-alert.
Select Review and Create to review your selections. Select Create to create the alert rule.
To create an alert rule for App Memory Usage metric signal, use the following inputs:
- Signal name: App Memory Usage
- Threshold value: 90
- Dimension name: App
- Dimension values: Select all
- Action group name: email-notification
- Alert rule name: app-memory-high-alert
To create an alert rule for App Network In metric signal, use the following inputs:
- Signal name: App Network In
- Unit: GB
- Threshold value: 1
- Dimension name: App
- Dimension values: api-gateway
- Action group name: email-notification
- Alert rule name: network-in-high-alert
After you've created all the alert rules, you can view the alert rules list.
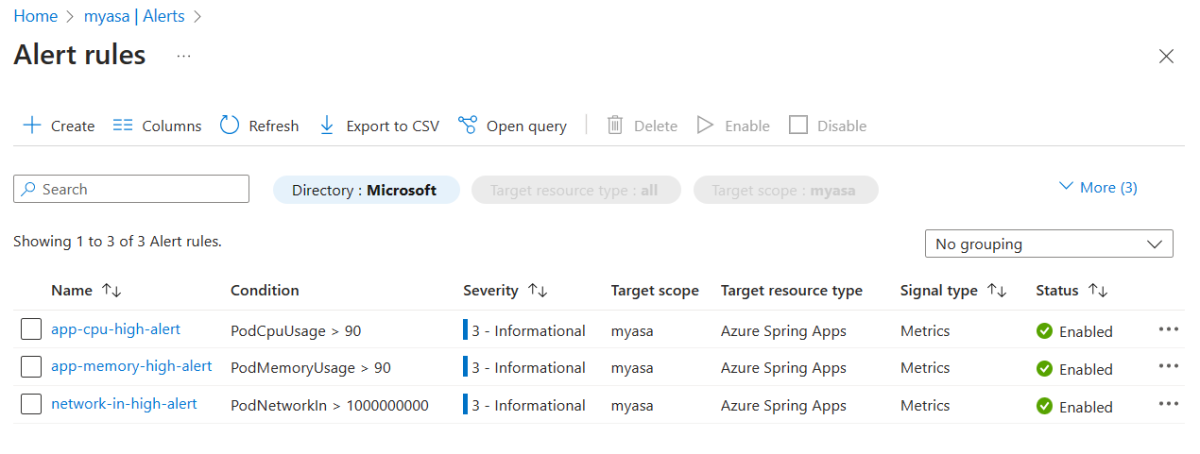


Pin alerts to the dashboard
To pin the quickstart chart to the dashboard, use the following steps:
Go to the Azure Spring Apps instance overview page.
On the navigation menu, select Alert, and then select the Pin blade to dashboard icon.
Query logs to diagnose an application problem
If you encounter production issues, you need to do a root cause analysis. Finding logs is an important part of this analysis, especially for distributed applications with logs spread across multiple applications. The trace data collected by Application Insights can help you find the log information for all related links, including the exception stack information.
This section explains how to use Log Analytics to query the application logs and use Application Insights to investigate request failures. For more information, see the following articles:
Log queries
This section explains how to query application logs from the AppPlatformLogsforSpring table hosted by Azure Spring Apps. You can use the Kusto Query Language to customize your queries for application logs.
To see the built-in example query statements or to write your own queries, open the Azure Spring Apps instance and go to the Logs menu.
Show the application logs that contain the "error" or "exception" terms
To see the application logs containing the terms "error" or "exception", select Alerts on the Queries page, and then select Run in the Show the application logs which contain the "error" or "exception" terms section.
The following query shows the application logs from the last hour that contains the terms "error" or "exception". You can customize the query with any keyword you want to search for.
AppPlatformLogsforSpring
| where TimeGenerated > ago(1h)
| where Log contains "error" or Log contains "exception"
| project TimeGenerated , ServiceName , AppName , InstanceName , Log , _ResourceId

Show the error and exception number of each application
To see the error and exception number of an application, select Alerts on the Queries page, and then select Run in the Show the error and exception number of each application section.
The following query shows a pie chart of the number of the logs in the last 24 hours that contain the terms "error" or "exception". To view the results in a table format, select Result.
AppPlatformLogsforSpring
| where TimeGenerated > ago(24h)
| where Log contains "error" or Log contains "exception"
| extend FullAppName = strcat(ServiceName, "/", AppName)
| summarize count_per_app = count() by FullAppName, ServiceName, AppName, _ResourceId
| sort by count_per_app desc
| render piechart

Query the customers service log with a key word
Use the following query to see a list of logs in the customers-service app that contain the term "root cause". Update the query to use the keyword that you're looking for.
AppPlatformLogsforSpring
| where AppName == "customers-service"
| where Log contains "root cause"
| project-keep InstanceName, Log

Investigate request failures
Use the following steps to investigate request failures in the application cluster and to view the failed request list and specific examples of the failed requests:
Go to the Azure Spring Apps instance overview page.
On the navigation menu, select Application Insights to go to the Application Insights overview page. Then, select Failures.
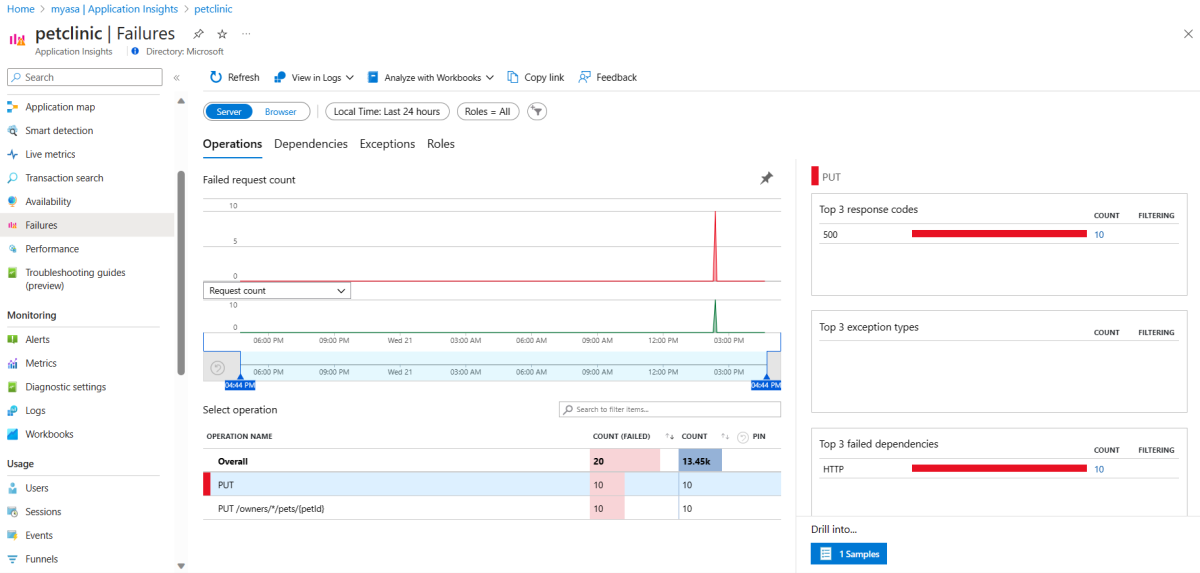
On the Failure page, select the
PUToperation that has the most failed requests count, select 1 Samples to go into the details, and then select the suggested sample.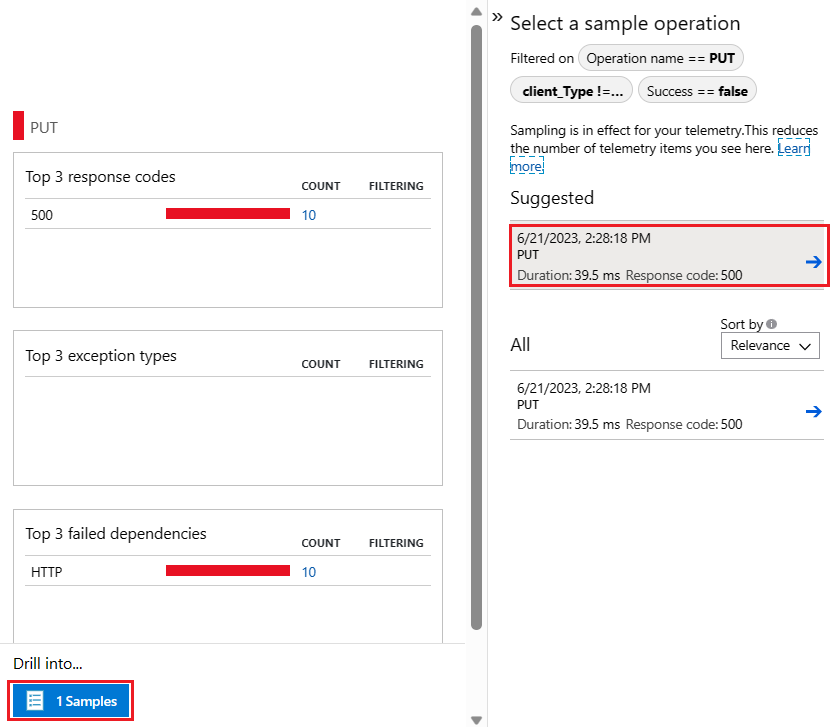
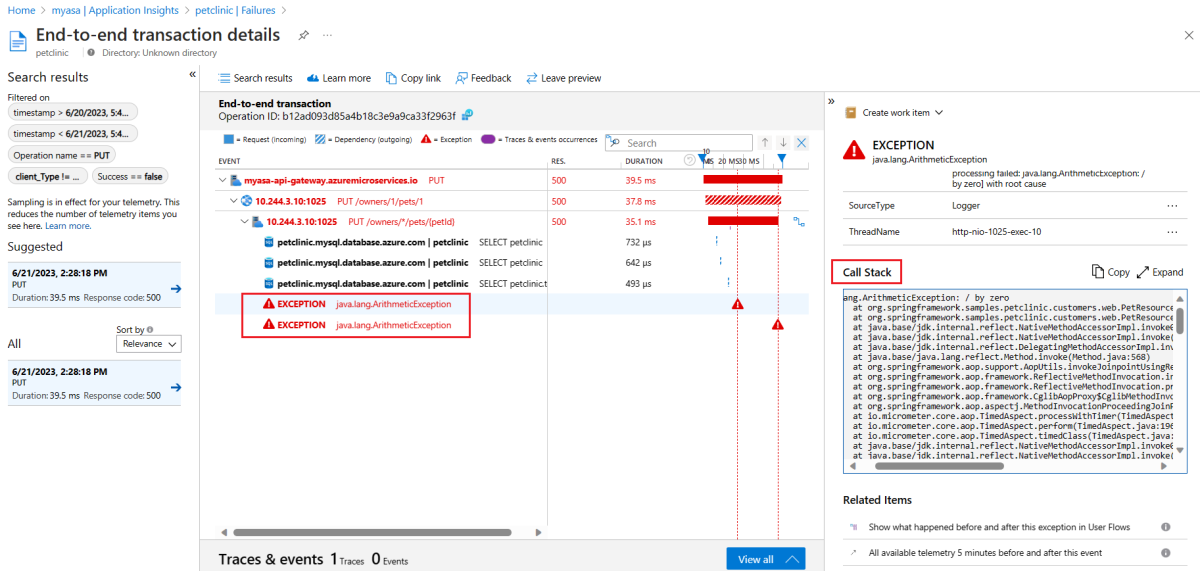
Go to the End-to-end transaction details page to view the full call stack in the right panel.


Improve the application performance using Application Insights
If there's a performance issue, the trace data collected by Application Insights can help find the log information of all relevant links, including the execution time of each link, to help find the location of the performance bottleneck.
To use Application Insights to investigate the performance issues, use the following steps:
Go to the Azure Spring Apps instance overview page.
On the navigation menu, select Application Insights to go to the Application Insights overview page. Then, select Performance.
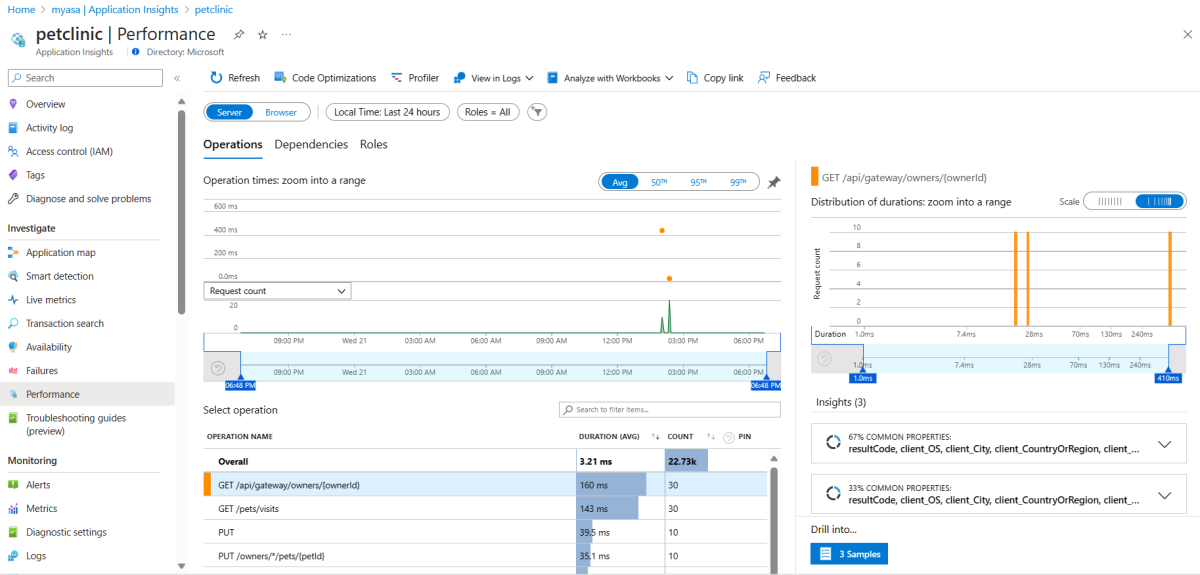
On the Performance page, select the slowest
GET /api/gateway/owners/{ownerId}operation, select 3 Samples to go into the details, and then select the suggested sample.
Go to the End-to-end transaction details page to view the full call stack in the right panel.


Clean up resources
You can delete the Azure resource group, which includes all the resources in the resource group. Use the following steps to delete the entire resource group, including the newly created service:
Locate your resource group in the Azure portal.
On the navigation menu, select Resource groups. Then, select the name of your resource group - for example, myresourcegroup.
On your resource group page, select Delete. Enter the name of your resource group in the text box to confirm deletion - for example, myresourcegroup. Then, select Delete.