Note
Access to this page requires authorization. You can try signing in or changing directories.
Access to this page requires authorization. You can try changing directories.
Streaming units (SUs) represent the computing resources that are allocated to run an Azure Stream Analytics job. The higher the number of SUs, the more CPU and memory resources are allocated to your job.
The autoscale feature dynamically adjusts SUs based on your rule definitions. You can configure autoscale settings for your Stream Analytics job in the Azure portal or by using the Stream Analytics continuous integration and continuous delivery (CI/CD) tool on your local machine.
This article explains how you can use the Stream Analytics CI/CD tool to configure autoscale settings for Stream Analytics jobs. If you want to learn more about autoscaling jobs in the Azure portal, see Autoscale streaming units (preview).
The Stream Analytics CI/CD tool allows you to specify the maximum number of streaming units and configure a set of rules for autoscaling your jobs. Then it determines whether to add SUs (to handle increases in load) or reduce the number of SUs (when computing resources are sitting idle).
Here's an example of an autoscale setting:
- If the maximum number of SUs is set to 12, increase SUs when the average SU utilization of the job over the last 2 minutes goes above 75 percent.
Prerequisites
To complete the steps in this article, you need either:
- A Stream Analytics project on the local machine. Follow this guide to create one.
- A running Stream Analytics job in Azure.
Configure autoscale settings
Scenario 1: Configure settings for a local Stream Analytics project
If you have a working Stream Analytics project on the local machine, follow these steps to configure autoscale settings:
Open your Stream Analytics project in Visual Studio Code.
On the Terminal panel, run the following command to install the Stream Analytics CI/CD tool:
npm install -g azure-streamanalytics-cicdHere's the list of supported commands for
azure-streamanalytics-cicd:Command Description buildGenerate a standard Azure Resource Manager template (ARM template) for a Stream Analytics project in Visual Studio Code. localrunRun locally for a Stream Analytics project in Visual Studio Code. testTest for a Stream Analytics project in Visual Studio Code. addtestcaseAdd test cases for a Stream Analytics project in Visual Studio Code. autoscaleGenerate an ARM template file for an autoscale setting. helpDisplay more information on a specific command. Build the project:
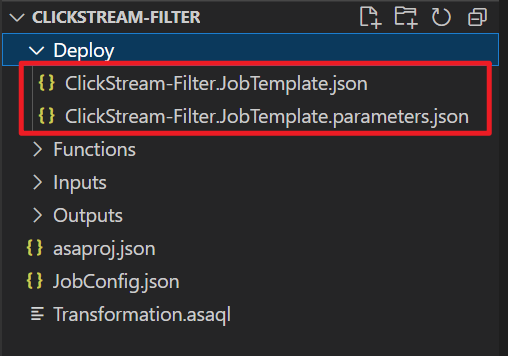
azure-streamanalytics-cicd build --v2 --project ./asaproj.json --outputPath ./DeployIf you build the project successfully, two JSON files are created under the Deploy folder. One is the ARM template file, and the other is the parameter file.

Note
We highly recommend that you use the
--v2option for the updated ARM template schema. The updated schema has fewer parameters yet retains the same functionality as the previous version.The old ARM template will be deprecated in the future. After that, only templates that were created via
build --v2will receive updates or bug fixes.Configure the autoscale setting. Add parameter keys and values by using the
azure-streamanalytics-cicd autoscalecommand.Parameter key Value Example capacityMaximum SUs (1/3, 2/3, 1, up to 66 SU V2s) 2metricsMetrics used for autoscale rules ProcessCPUUsagePercentageResourceUtilizationtargetJobNameProject name ClickStream-FilteroutputPathOutput path for ARM templates ./DeployHere's an example:
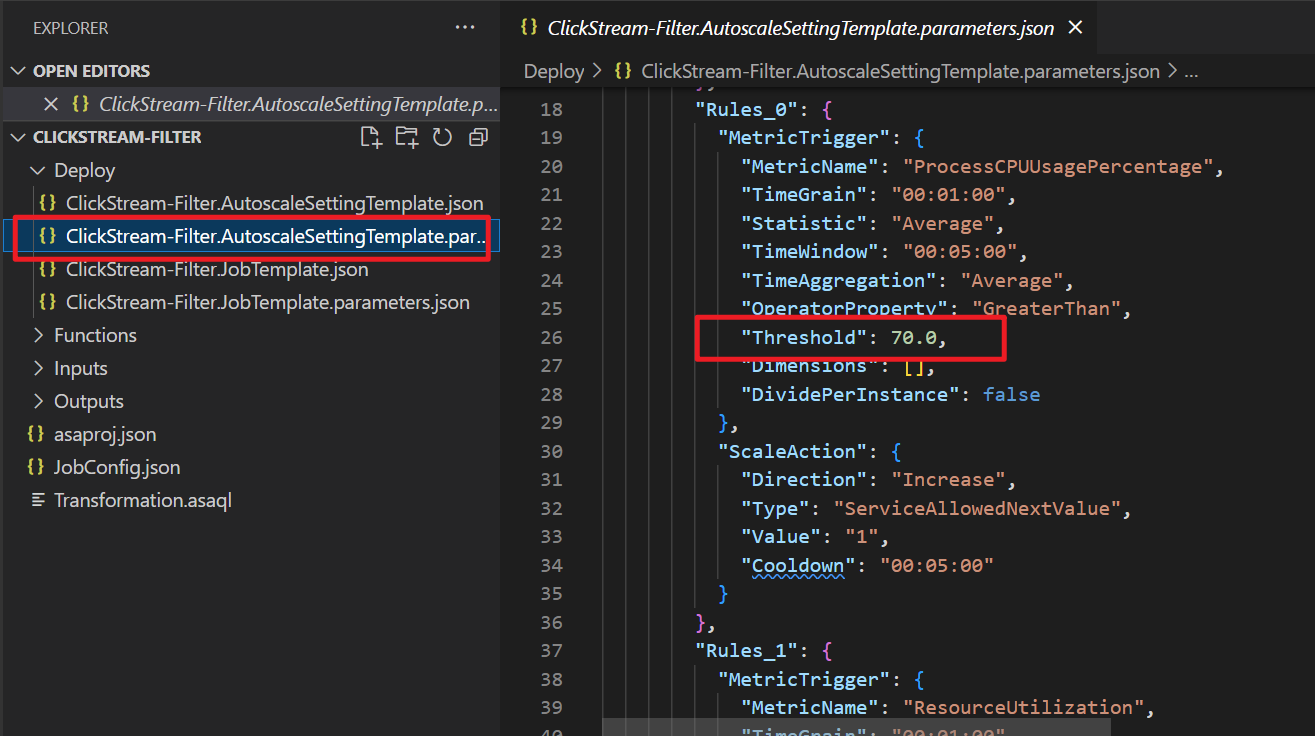
azure-streamanalytics-cicd autoscale --capacity 2 --metrics ProcessCPUUsagePercentage ResourceUtilization --targetJobName ClickStream-Filter --outputPath ./DeployIf you configure the autoscale setting successfully, two JSON files are created under the Deploy folder. One is the ARM template file, and the other is the parameter file.

The following table lists the metrics that you can use to define autoscale rules:
Metric Name in REST API Unit Aggregation Dimensions Time Grains DS Export Failed Function Requests
Failed Function RequestsAMLCalloutFailedRequestsCount Total (Sum) LogicalName,PartitionId,ProcessorInstance,NodeNamePT1M Yes Function Events
Function EventsAMLCalloutInputEventsCount Total (Sum) LogicalName,PartitionId,ProcessorInstance,NodeNamePT1M Yes Function Requests
Function RequestsAMLCalloutRequestsCount Total (Sum) LogicalName,PartitionId,ProcessorInstance,NodeNamePT1M Yes Data Conversion Errors
Data Conversion ErrorsConversionErrorsCount Total (Sum) LogicalName,PartitionId,ProcessorInstance,NodeNamePT1M Yes Input Deserialization Errors
Input Deserialization ErrorsDeserializationErrorCount Total (Sum) LogicalName,PartitionId,ProcessorInstance,NodeNamePT1M Yes Out of order Events
Out of order EventsDroppedOrAdjustedEventsCount Total (Sum) LogicalName,PartitionId,ProcessorInstance,NodeNamePT1M Yes Early Input Events
Early Input EventsEarlyInputEventsCount Total (Sum) LogicalName,PartitionId,ProcessorInstance,NodeNamePT1M Yes Runtime Errors
Runtime ErrorsErrorsCount Total (Sum) LogicalName,PartitionId,ProcessorInstance,NodeNamePT1M Yes Input Event Bytes
Input Event BytesInputEventBytesBytes Total (Sum) LogicalName,PartitionId,ProcessorInstance,NodeNamePT1M Yes Input Events
Input EventsInputEventsCount Total (Sum) LogicalName,PartitionId,ProcessorInstance,NodeNamePT1M Yes Backlogged Input Events
Backlogged Input EventsInputEventsSourcesBackloggedCount Average, Maximum, Minimum LogicalName,PartitionId,ProcessorInstance,NodeNamePT1M Yes Input Sources Received
Input Sources ReceivedInputEventsSourcesPerSecondCount Total (Sum) LogicalName,PartitionId,ProcessorInstance,NodeNamePT1M Yes Late Input Events
Late Input EventsLateInputEventsCount Total (Sum) LogicalName,PartitionId,ProcessorInstance,NodeNamePT1M Yes Output Events
Output EventsOutputEventsCount Total (Sum) LogicalName,PartitionId,ProcessorInstance,NodeNamePT1M Yes Watermark Delay
Watermark DelayOutputWatermarkDelaySecondsSeconds Average, Maximum, Minimum LogicalName,PartitionId,ProcessorInstance,NodeNamePT1M Yes CPU % Utilization
CPU % UtilizationProcessCPUUsagePercentagePercent Average, Maximum, Minimum LogicalName,PartitionId,ProcessorInstance,NodeNamePT1M Yes SU (Memory) % Utilization
SU (Memory) % UtilizationResourceUtilizationPercent Average, Maximum, Minimum LogicalName,PartitionId,ProcessorInstance,NodeNamePT1M Yes The default value for all metric thresholds is
70. If you want to set the metric threshold to another number, open the *.AutoscaleSettingTemplate.parameters.json file and change theThresholdvalue.
To learn more about defining autoscale rules, see Understand autoscale settings.
Deploy to Azure.
Connect to your Azure account:
# Connect to Azure
Connect-AzAccount

# Set the Azure subscription
Set-AzContext [SubscriptionID/SubscriptionName]
Deploy your Stream Analytics project:
$templateFile = ".\Deploy\ClickStream-Filter.JobTemplate.json"
$parameterFile = ".\Deploy\ClickStream-Filter.JobTemplate.parameters.json"
New-AzResourceGroupDeployment `
  -Name devenvironment `
  -ResourceGroupName myResourceGroupDev `
  -TemplateFile $templateFile `
  -TemplateParameterFile $parameterFile
Deploy your autoscale settings:
$templateFile = ".\Deploy\ClickStream-Filter.AutoscaleSettingTemplate.json"
$parameterFile = ".\Deploy\ClickStream-Filter.AutoscaleSettingTemplate.parameters.json"
New-AzResourceGroupDeployment `
  -Name devenvironment `
  -ResourceGroupName myResourceGroupDev `
  -TemplateFile $templateFile `
  -TemplateParameterFile $parameterFile
After you deploy your project successfully, you can view the autoscale settings in the Azure portal.
Scenario 2: Configure settings for a running Stream Analytics job in Azure
If you have a Stream Analytics job running in Azure, you can use the Stream Analytics CI/CD tool in PowerShell to configure autoscale settings.
Run the following command. Replace $jobResourceId with the resource ID of your Stream Analytics job.
azure-streamanalytics-cicd autoscale --capacity 2 --metrics ProcessCPUUsagePercentage ResourceUtilization --targetJobResourceId $jobResourceId --outputPath ./Deploy
If you configure the settings successfully, ARM template and parameter files are created in the current directory.
Then you can deploy the autoscale settings to Azure by following the deployment steps in scenario 1.
Get help
For more information about autoscale settings, run this command in PowerShell:
azure-streamanalytics-cicd autoscale --help
If you have any problems with the Stream Analytics CI/CD tool, you can report them in GitHub.