Note
Access to this page requires authorization. You can try signing in or changing directories.
Access to this page requires authorization. You can try changing directories.
One way to improve the performance of an Azure Stream Analytics (ASA) job is to apply parallelism in query. This article demonstrates how to use the Job Simulation in the Azure portal and Visual Studio Code (VS Code) to evaluate the query parallelism for a Stream Analytics job. You learn to visualize a query execution with different number of streaming units and improve query parallelism based on the edit suggestions.
What is parallel query?
Query parallelism divides the workload of a query by creating multiple processes (or streaming nodes) and executes it in parallel. It greatly reduces overall execution time of the query and hence less streaming hours are needed.
For a job to be parallel, all inputs, outputs and query steps must be aligned and use the same partition keys. The query logic partitioning is determined by the keys used for aggregations (GROUP BY).
If you want to learn more about query parallelization, see Leverage query parallelization in Azure Stream Analytics.
Use job simulation in VS Code
The Job simulation feature simulates how the job would be running topology in Azure. In this tutorial, you learn to improve query performance based on edit suggestions and make it executed in parallel. As an example, we're using a nonparallel job that takes the input data from an event hub and sends the results to another event hub.
Prerequisites:
- ASA Tools extension for VS Code. If you haven't installed it yet, follow this guide to install.
- Configure live input and live output for your Stream Analytics job.
- You must include live input and output in the query.
Note
The Job Simulation can't simulate job running topology for local inputs and outputs. No data would be sent to the output destination during the simulation.
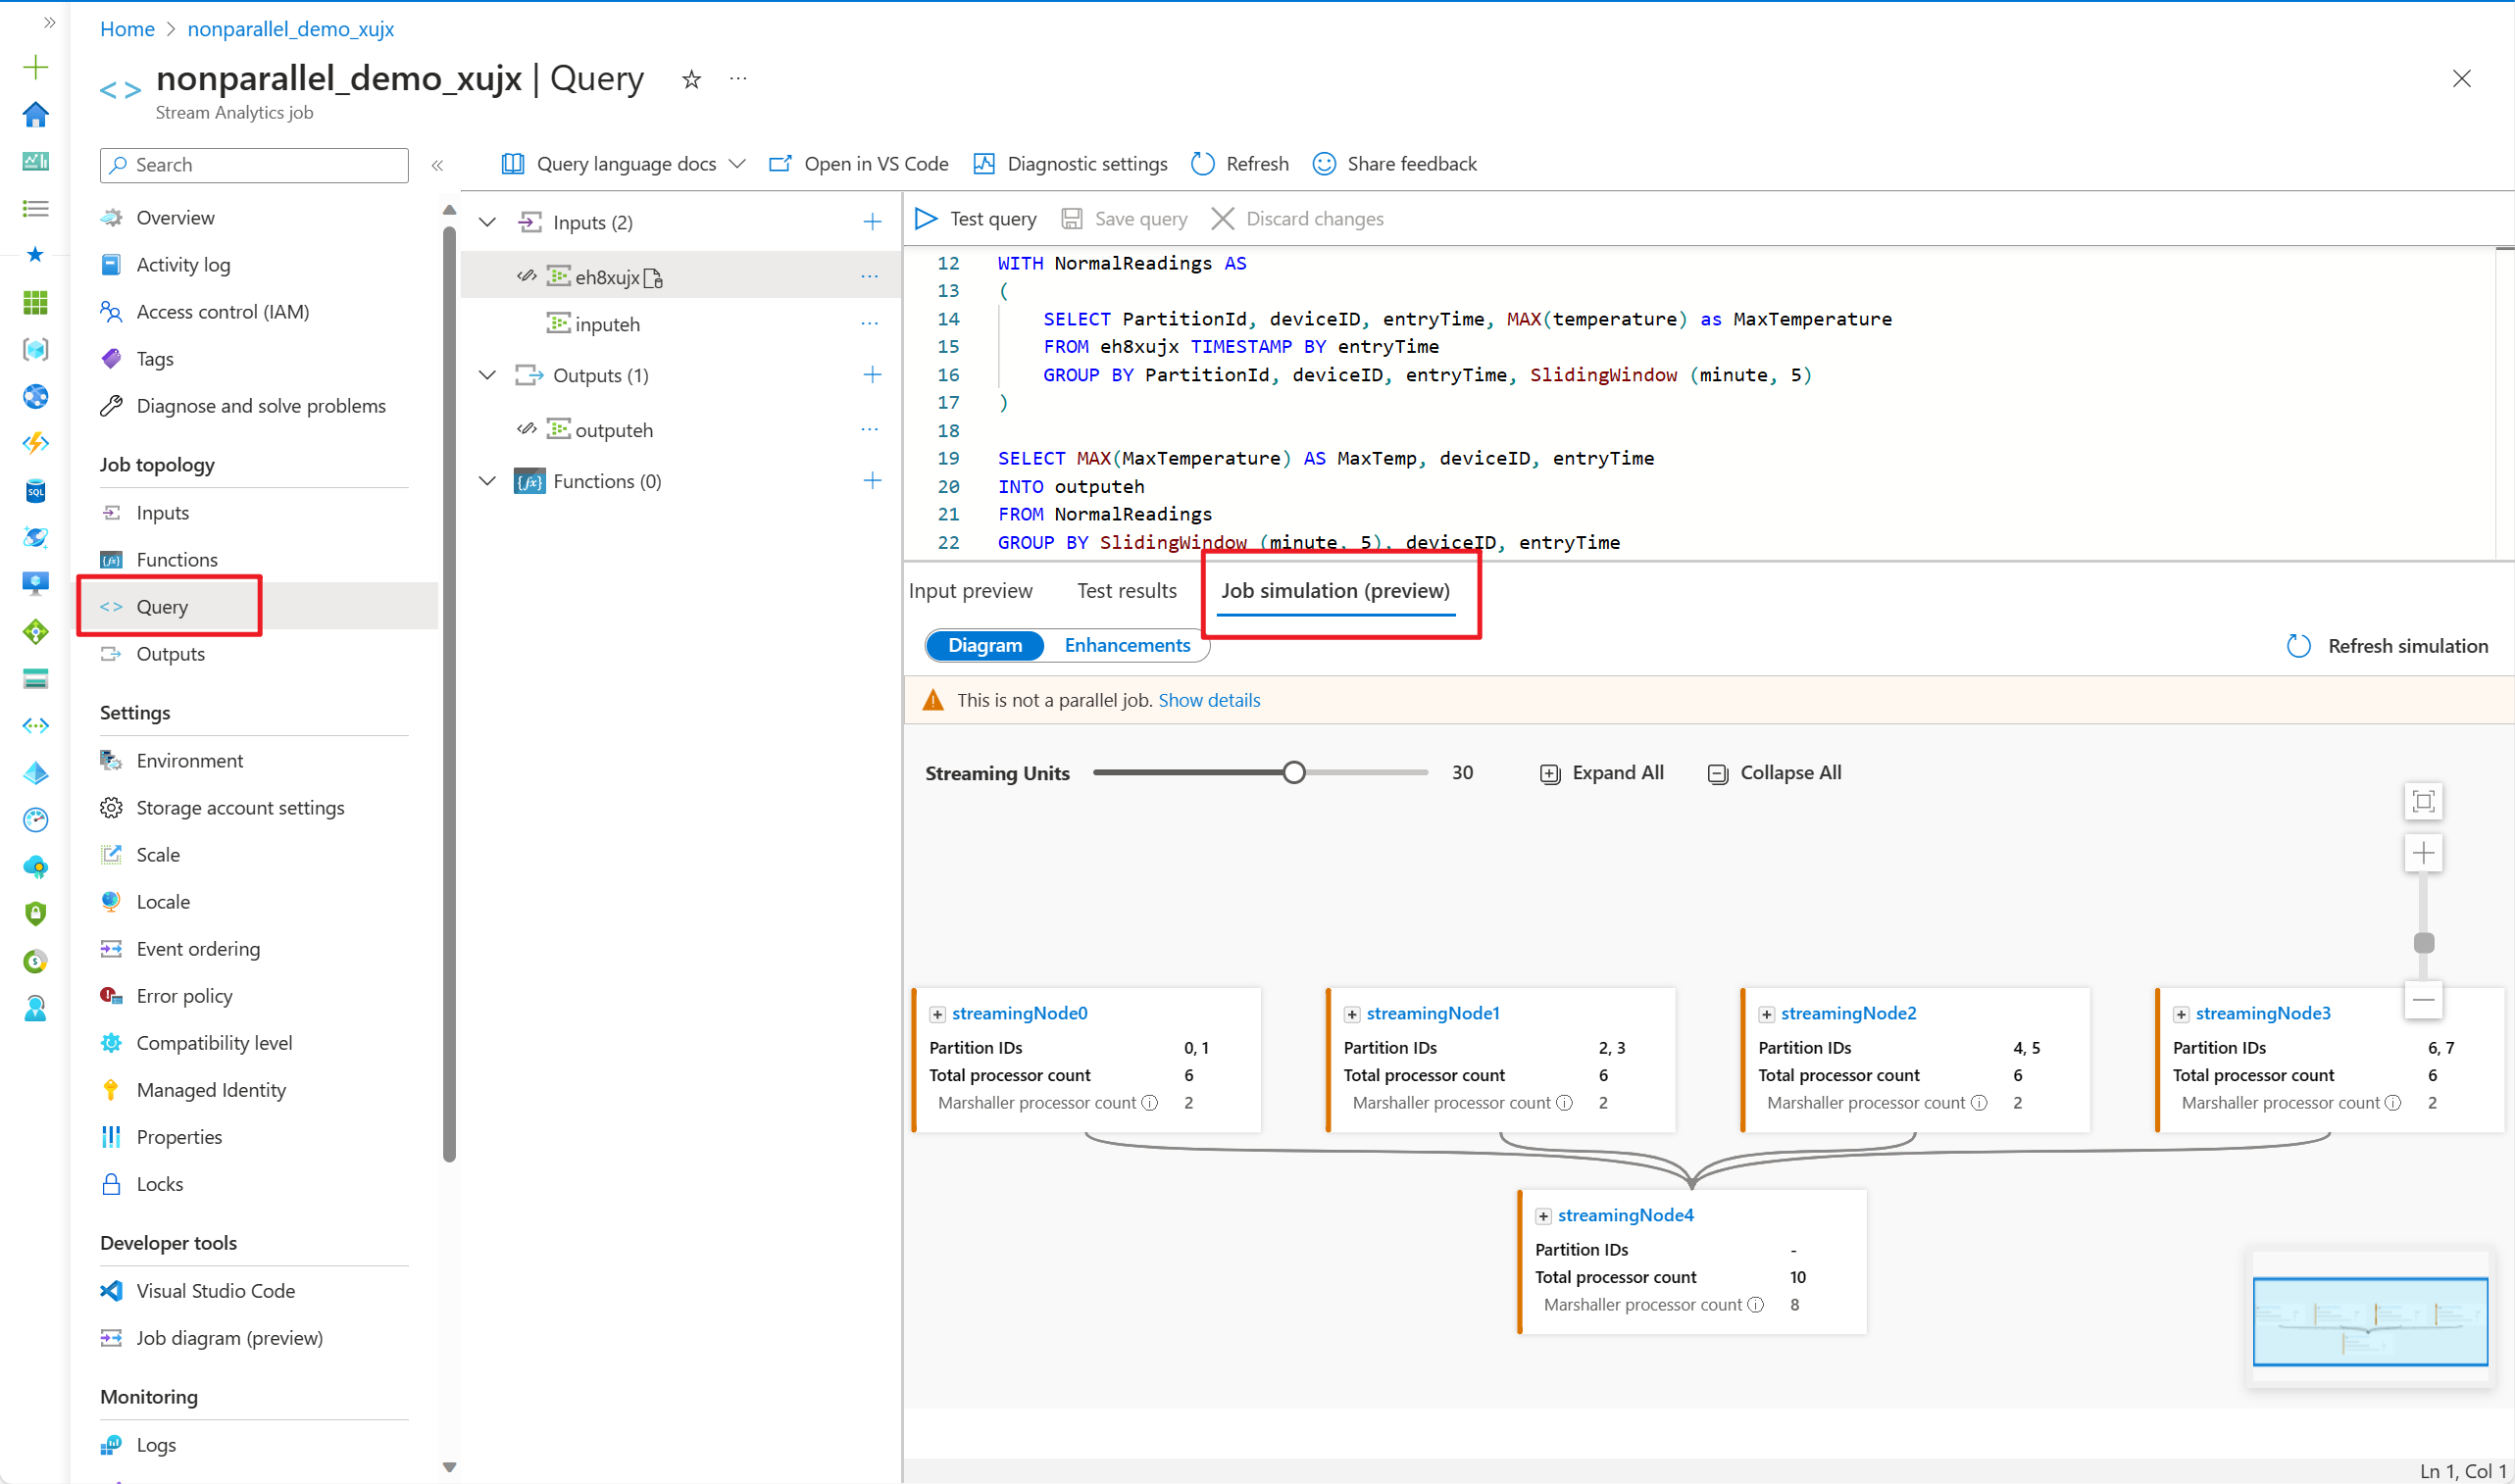
Open the ASA project in VS Code. Go to the query file *.asaql and select Simulate job to start Job Simulation.
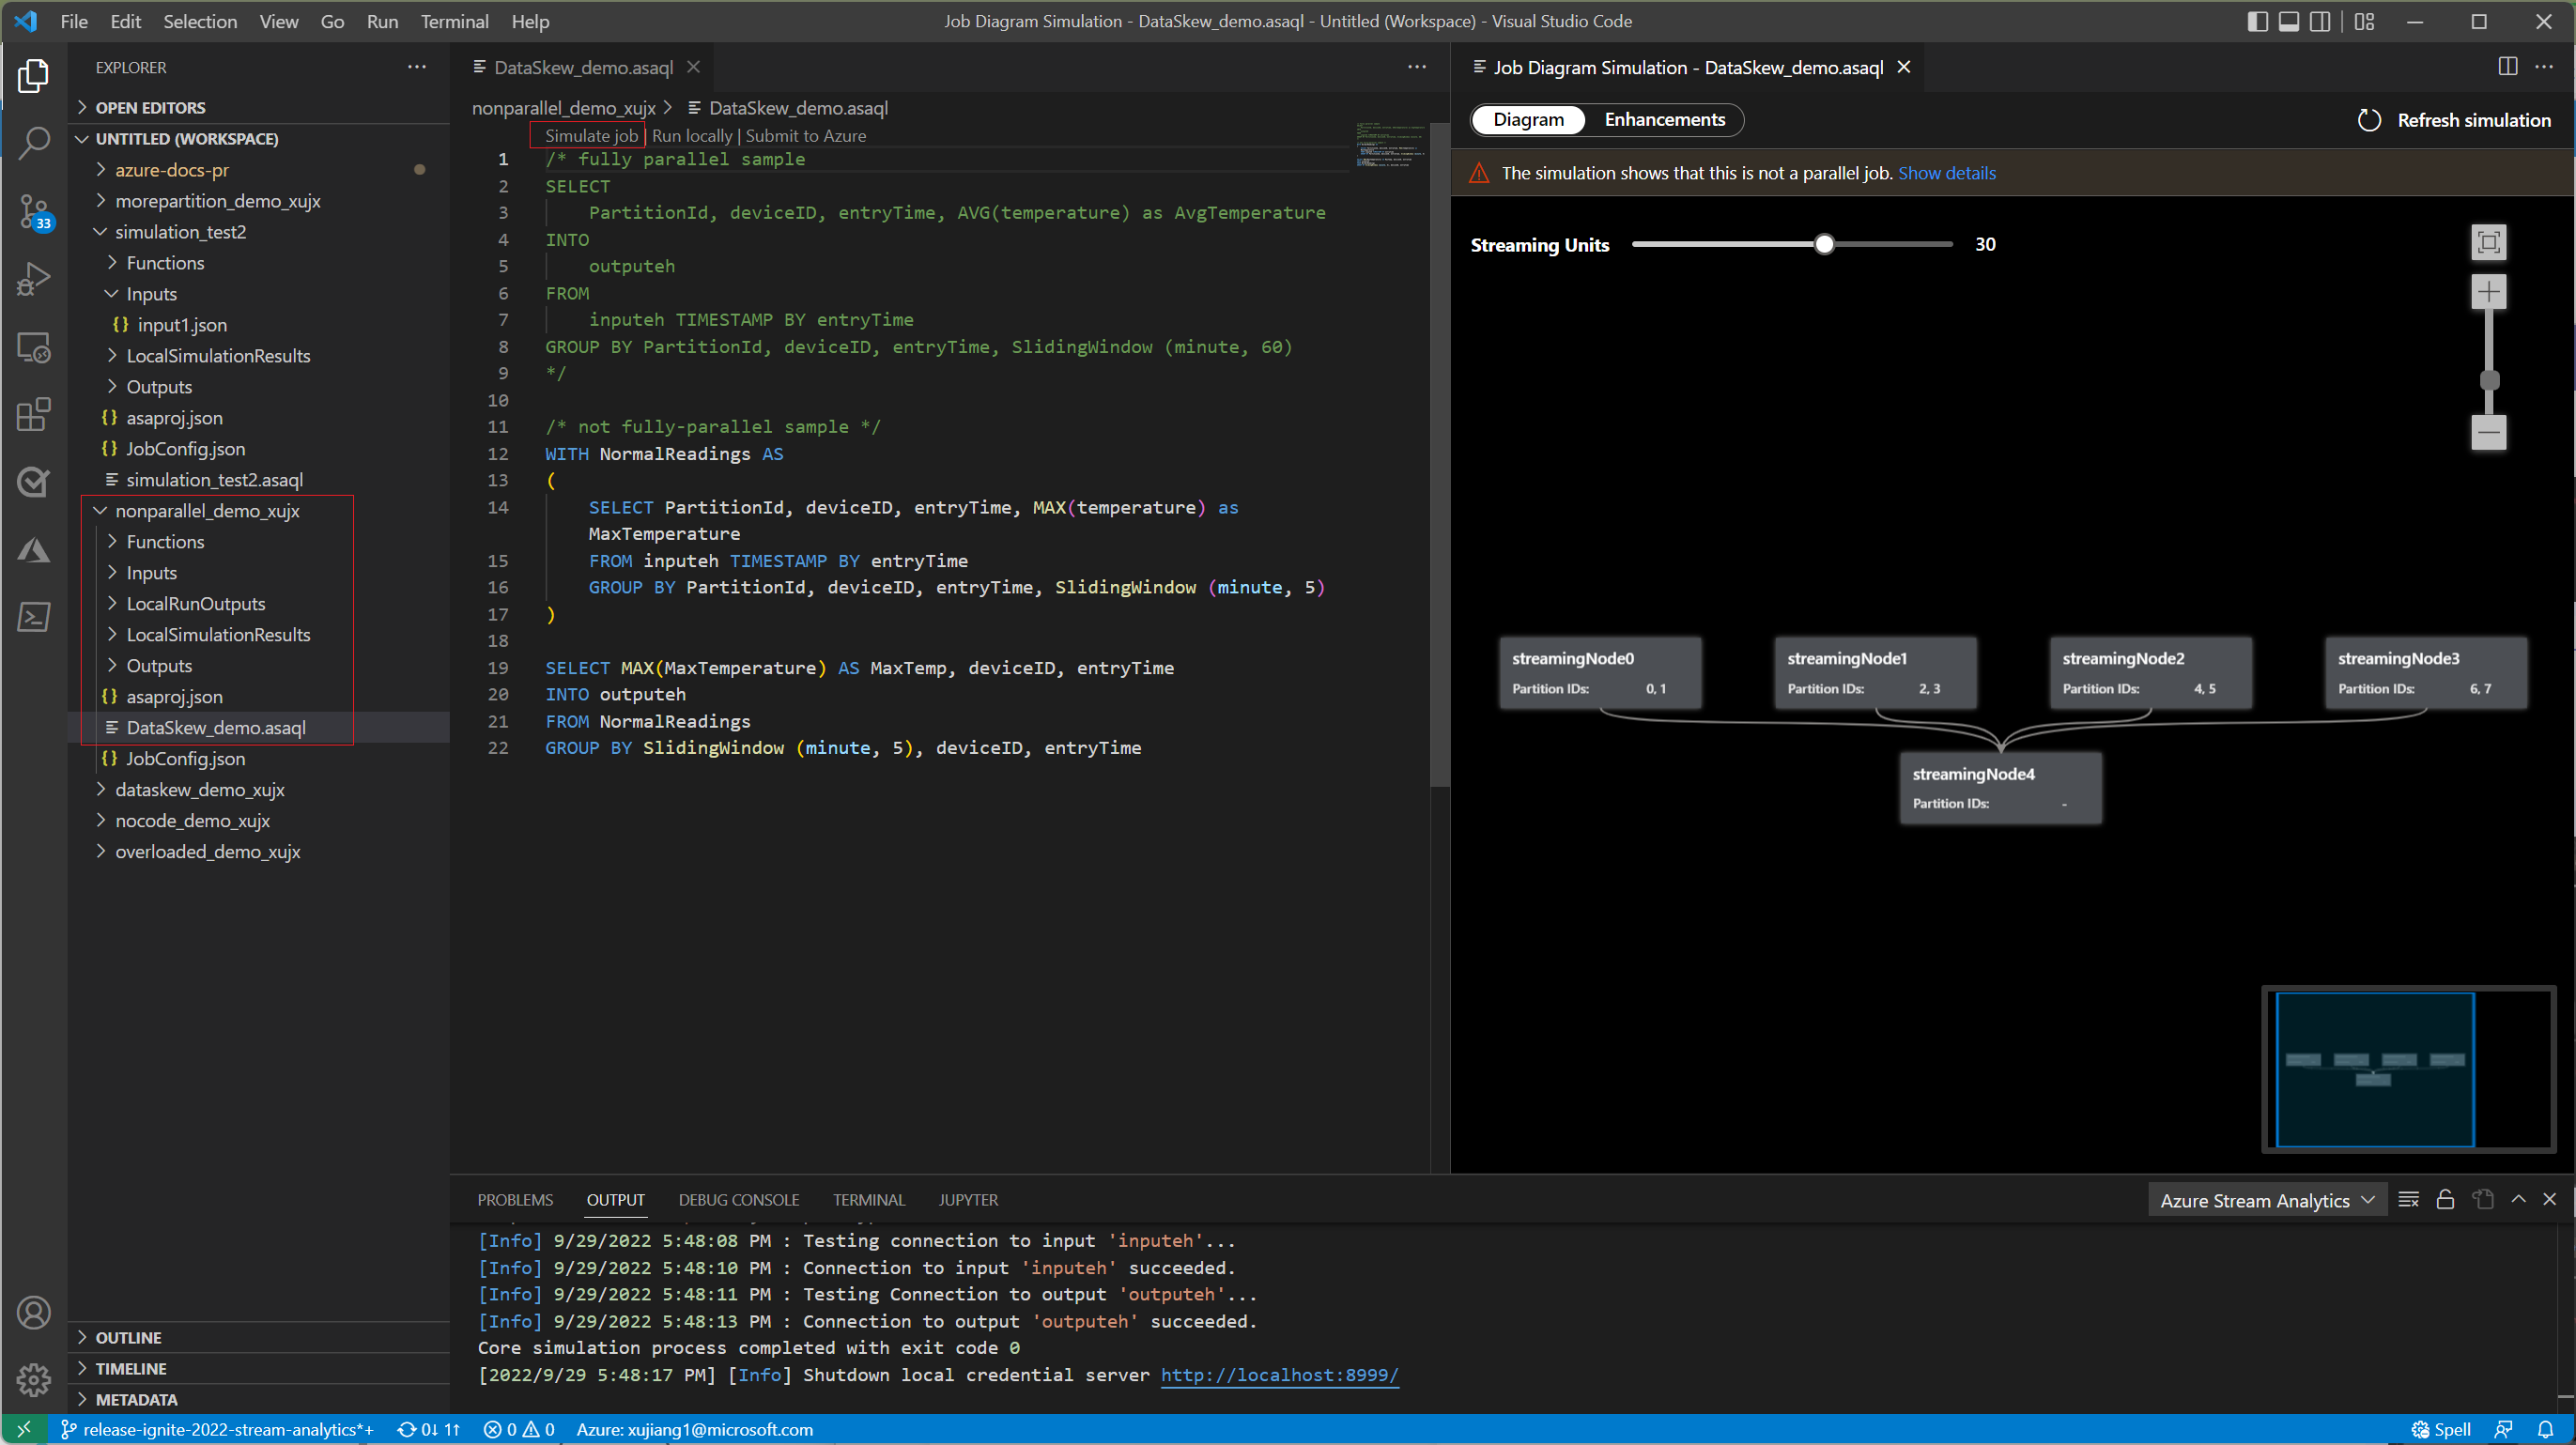
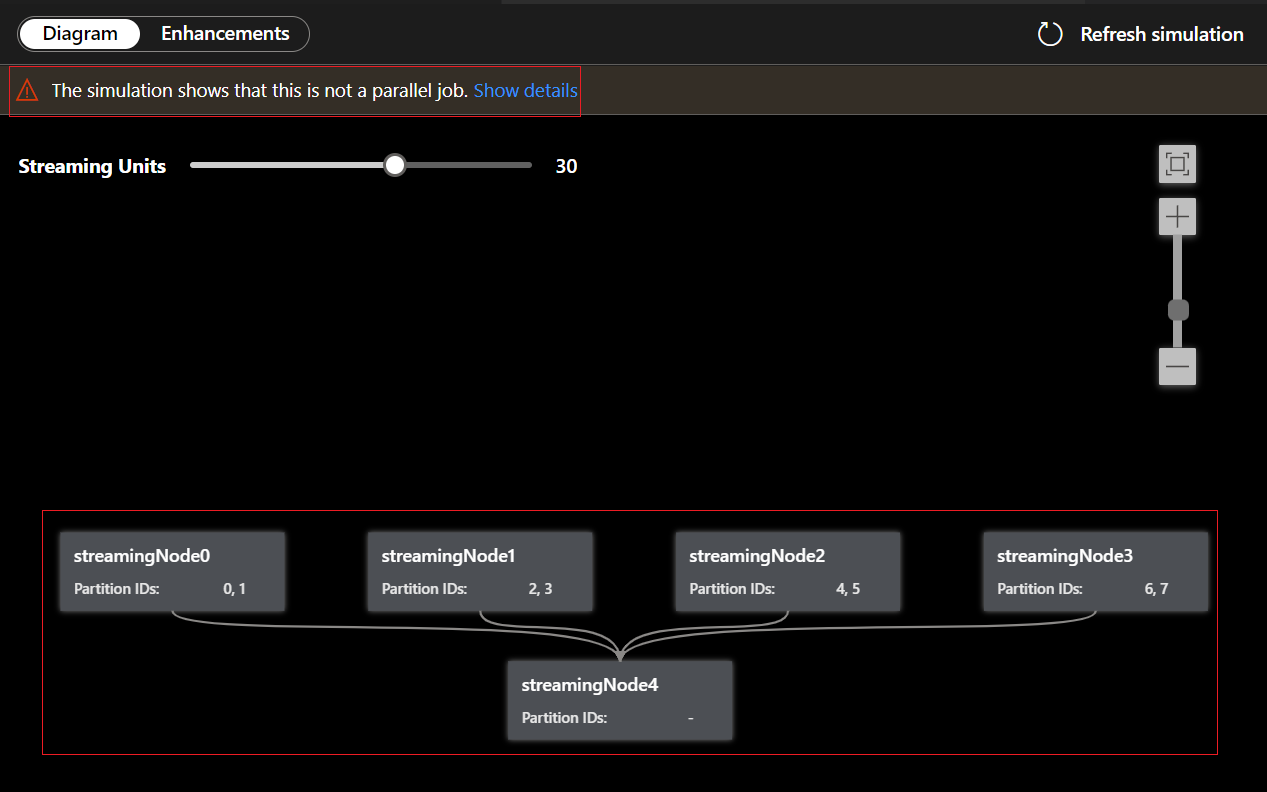
Under the Diagram tab, it shows the number of streaming nodes allocated to the job and the number of partitions in each streaming node. The following screenshot is an example of a nonparallel job where the data is flowing between nodes.
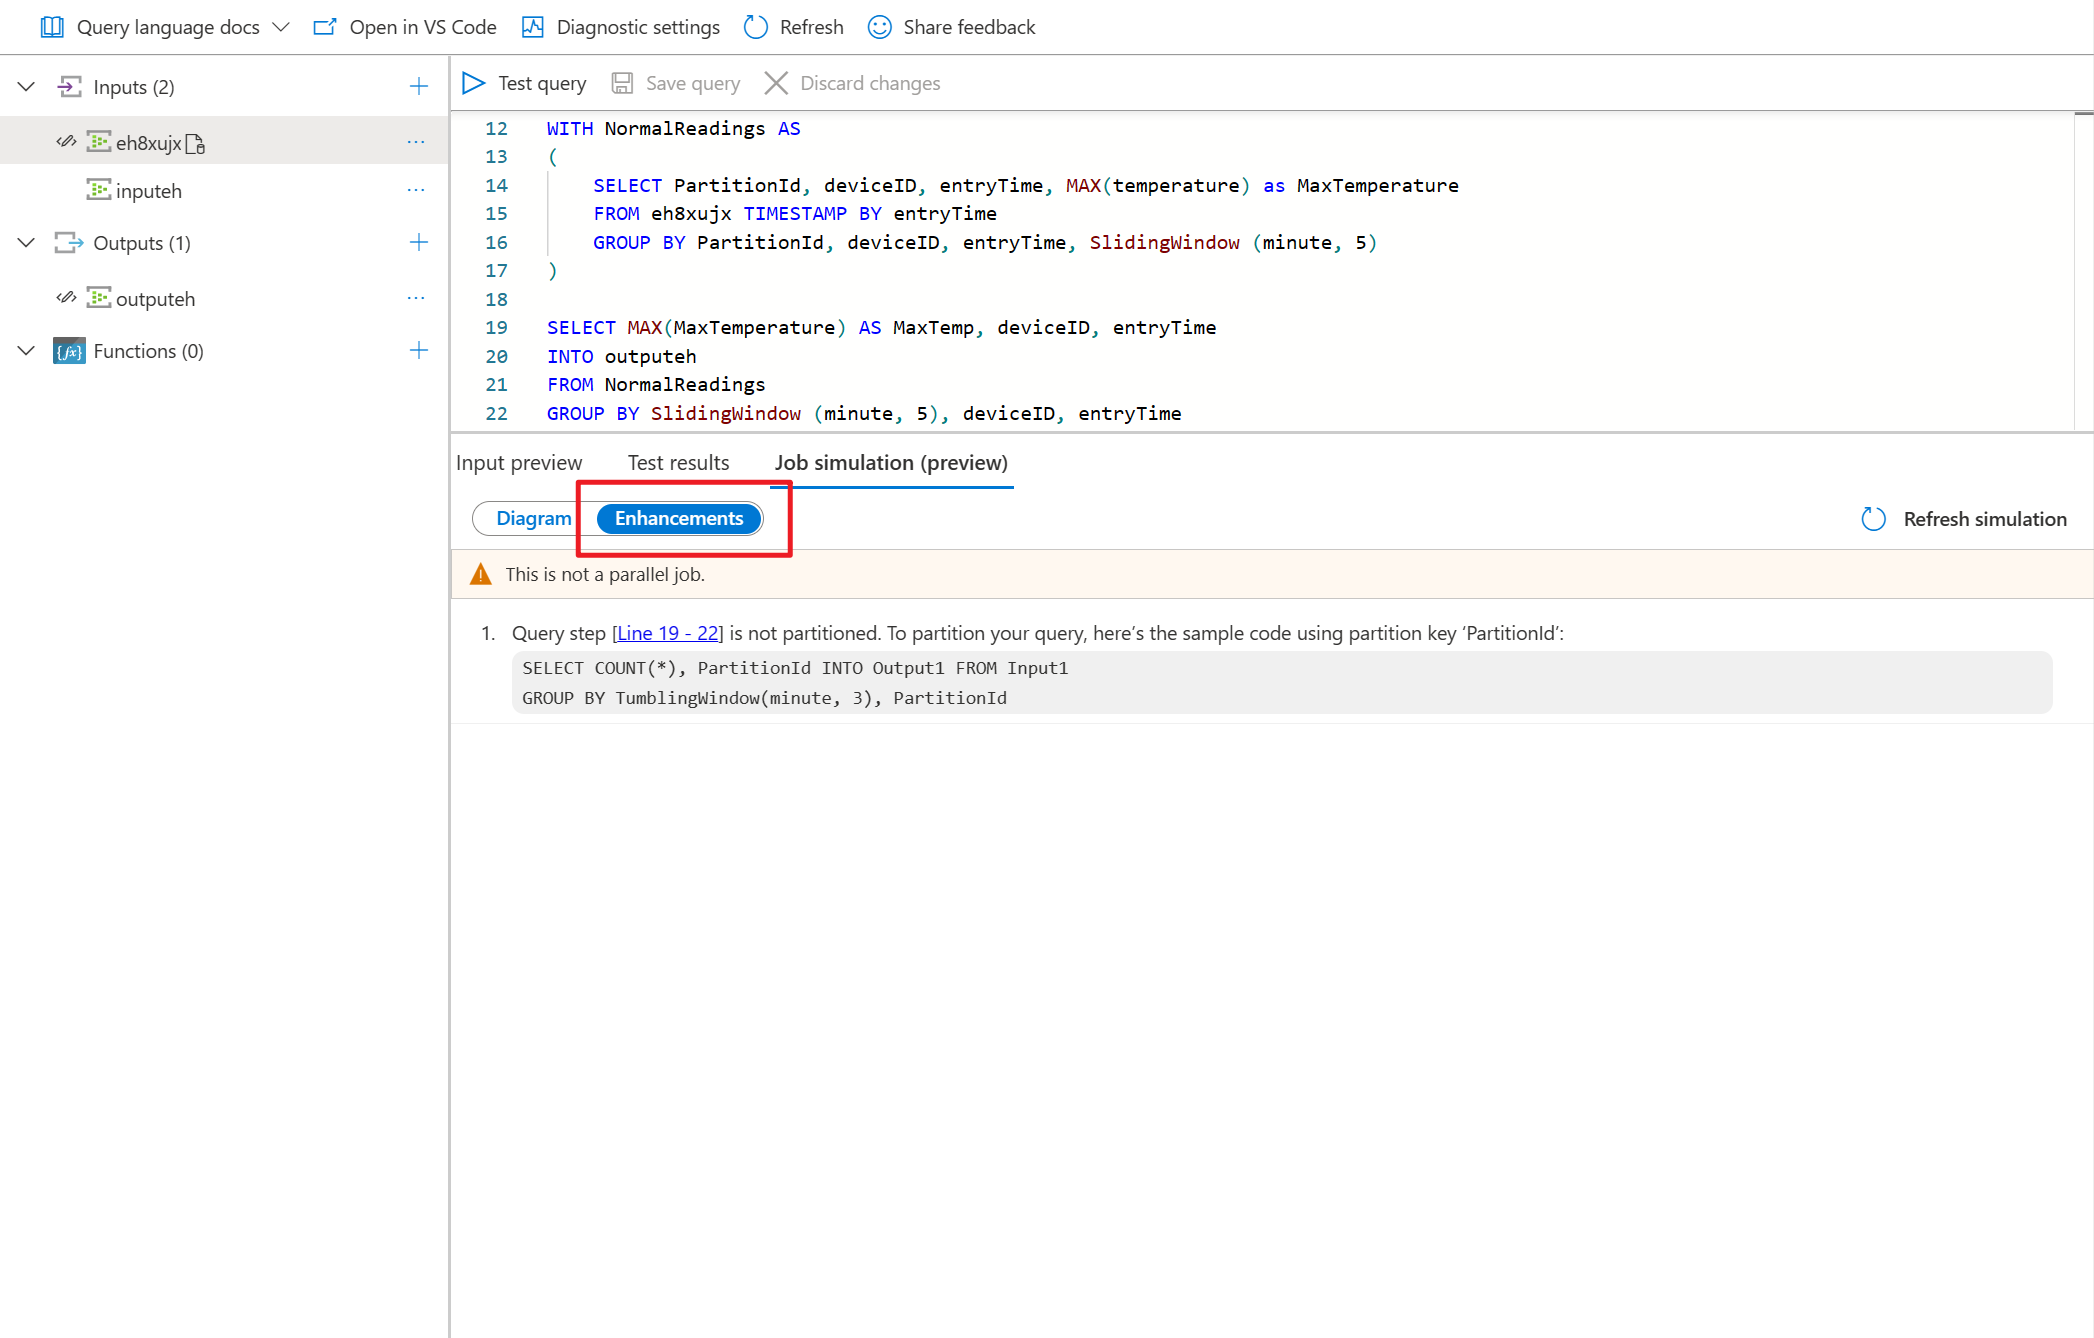
Since this query is NOT in parallel, you can select Enhancements tab to view suggestions about improving the query.
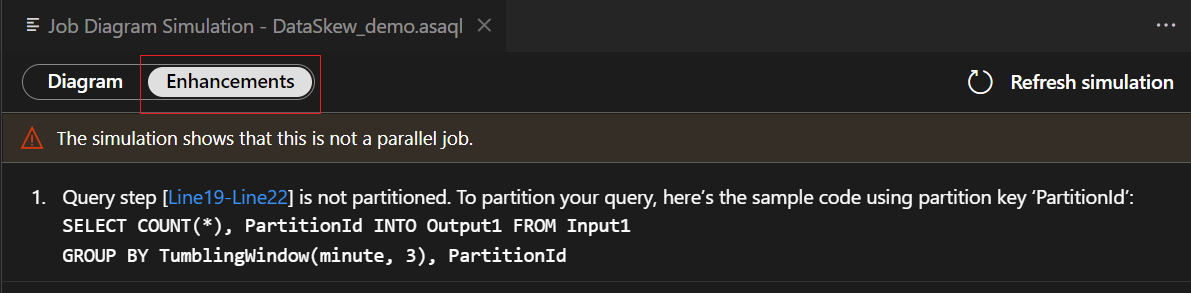
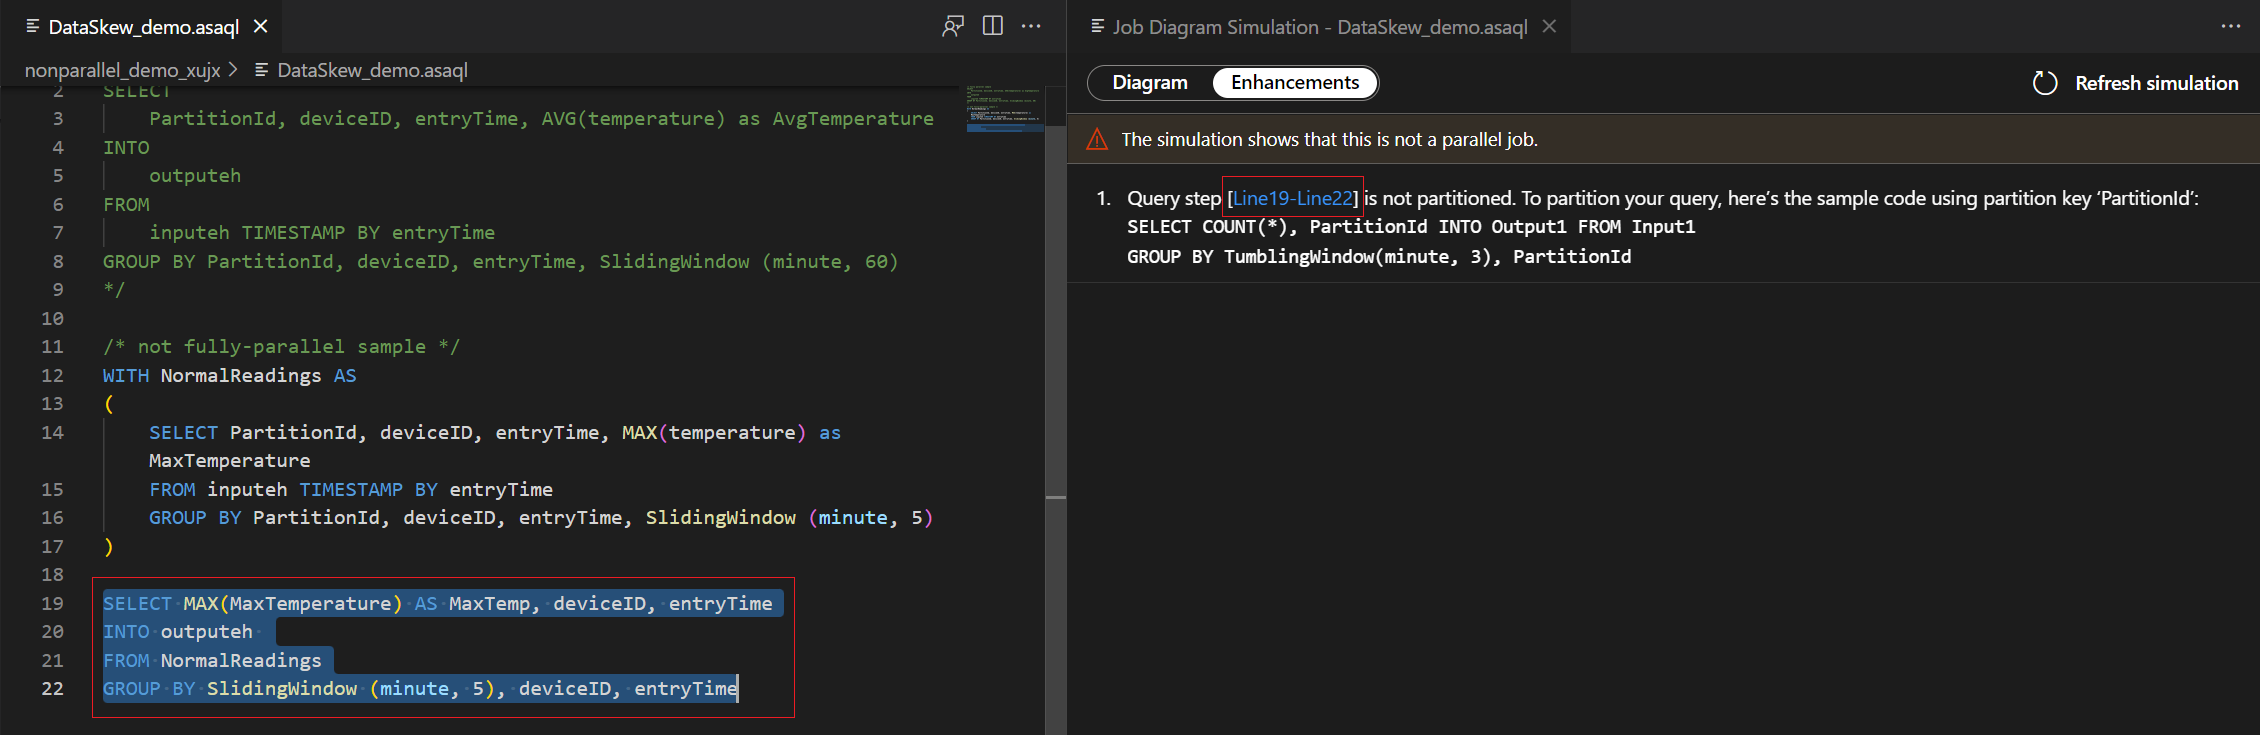
Select query step in the enhancements list, you see the corresponding lines are highlighted and you can edit the query based on the suggestions.
Note
These are edit suggestions for improving your query parallelism. However, if you are using aggregate function among all partitions, having a parallel query might not be applicable for your scenarios.
For this example, you add the PartitionId to line#22 and save your change. Then you can use Refresh simulation to get the new diagram.
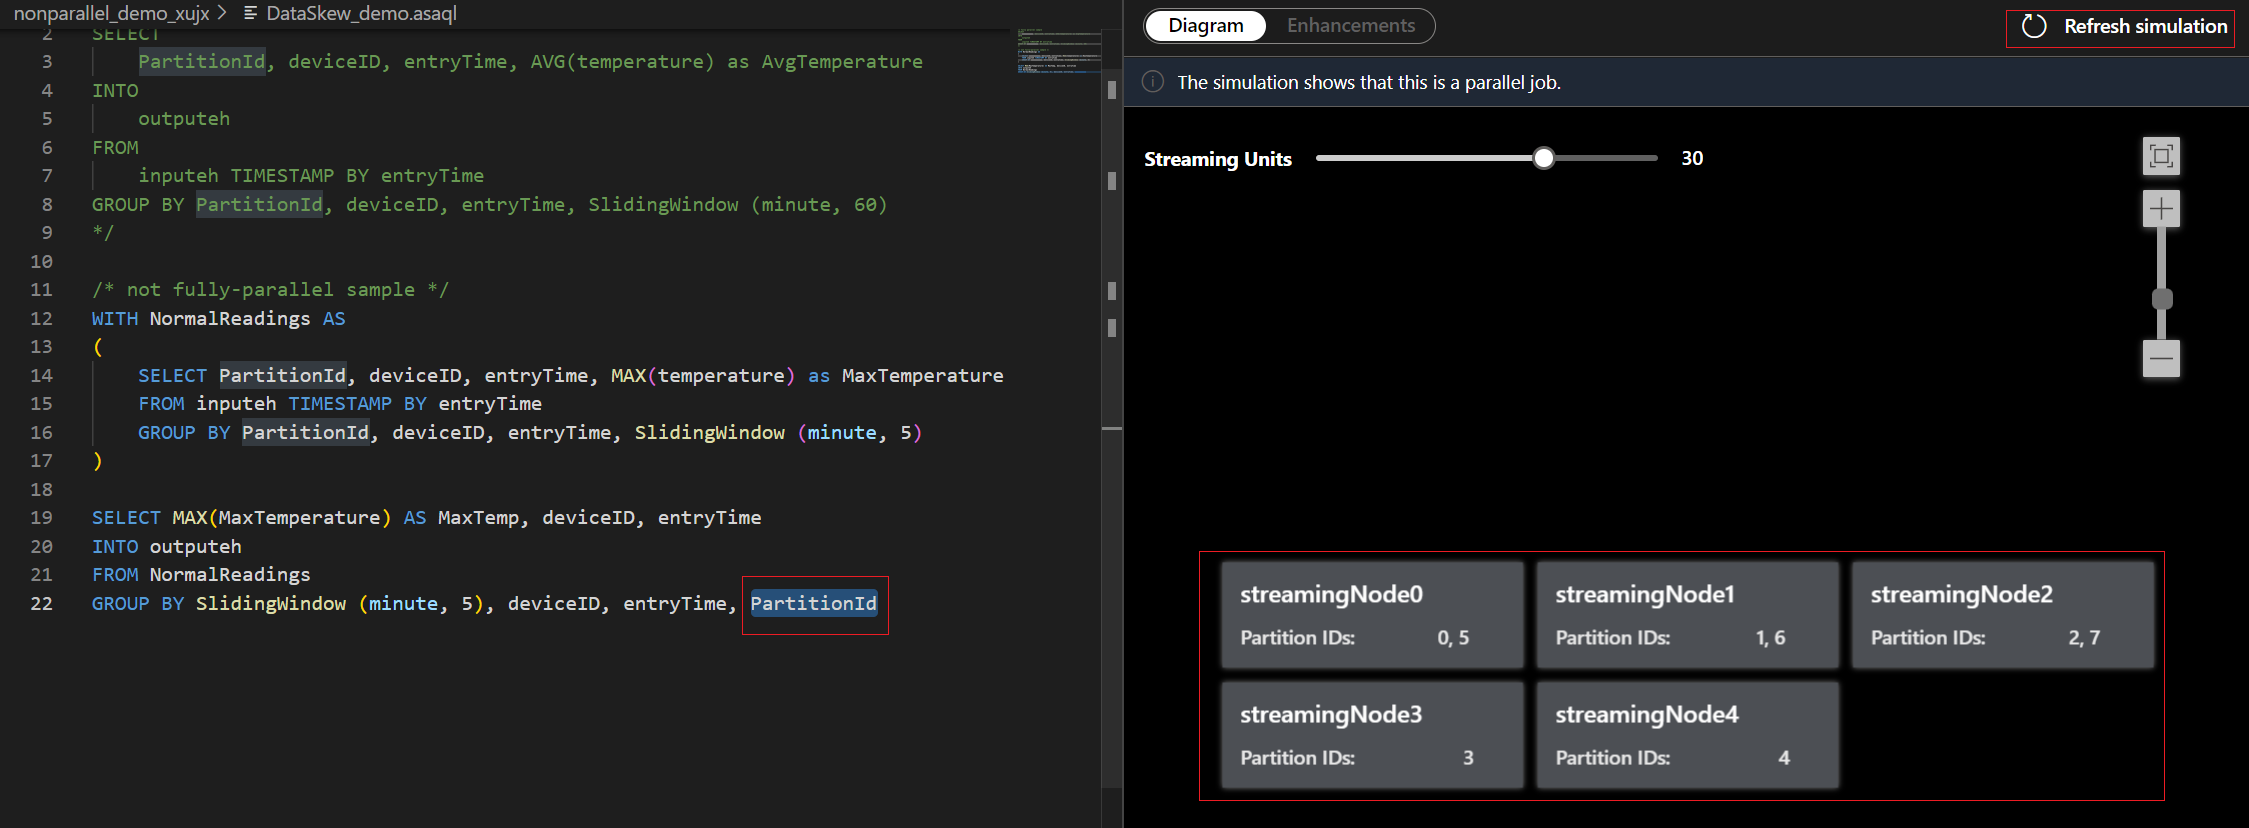
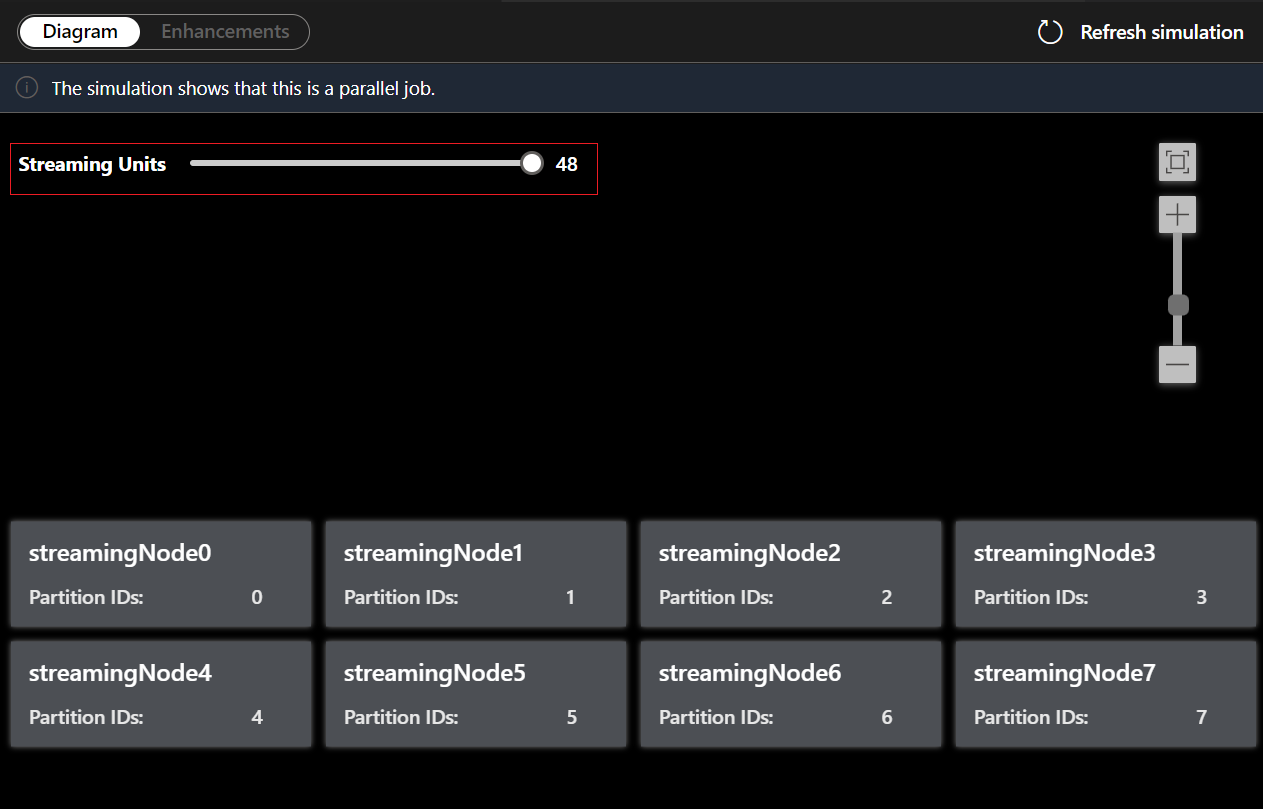
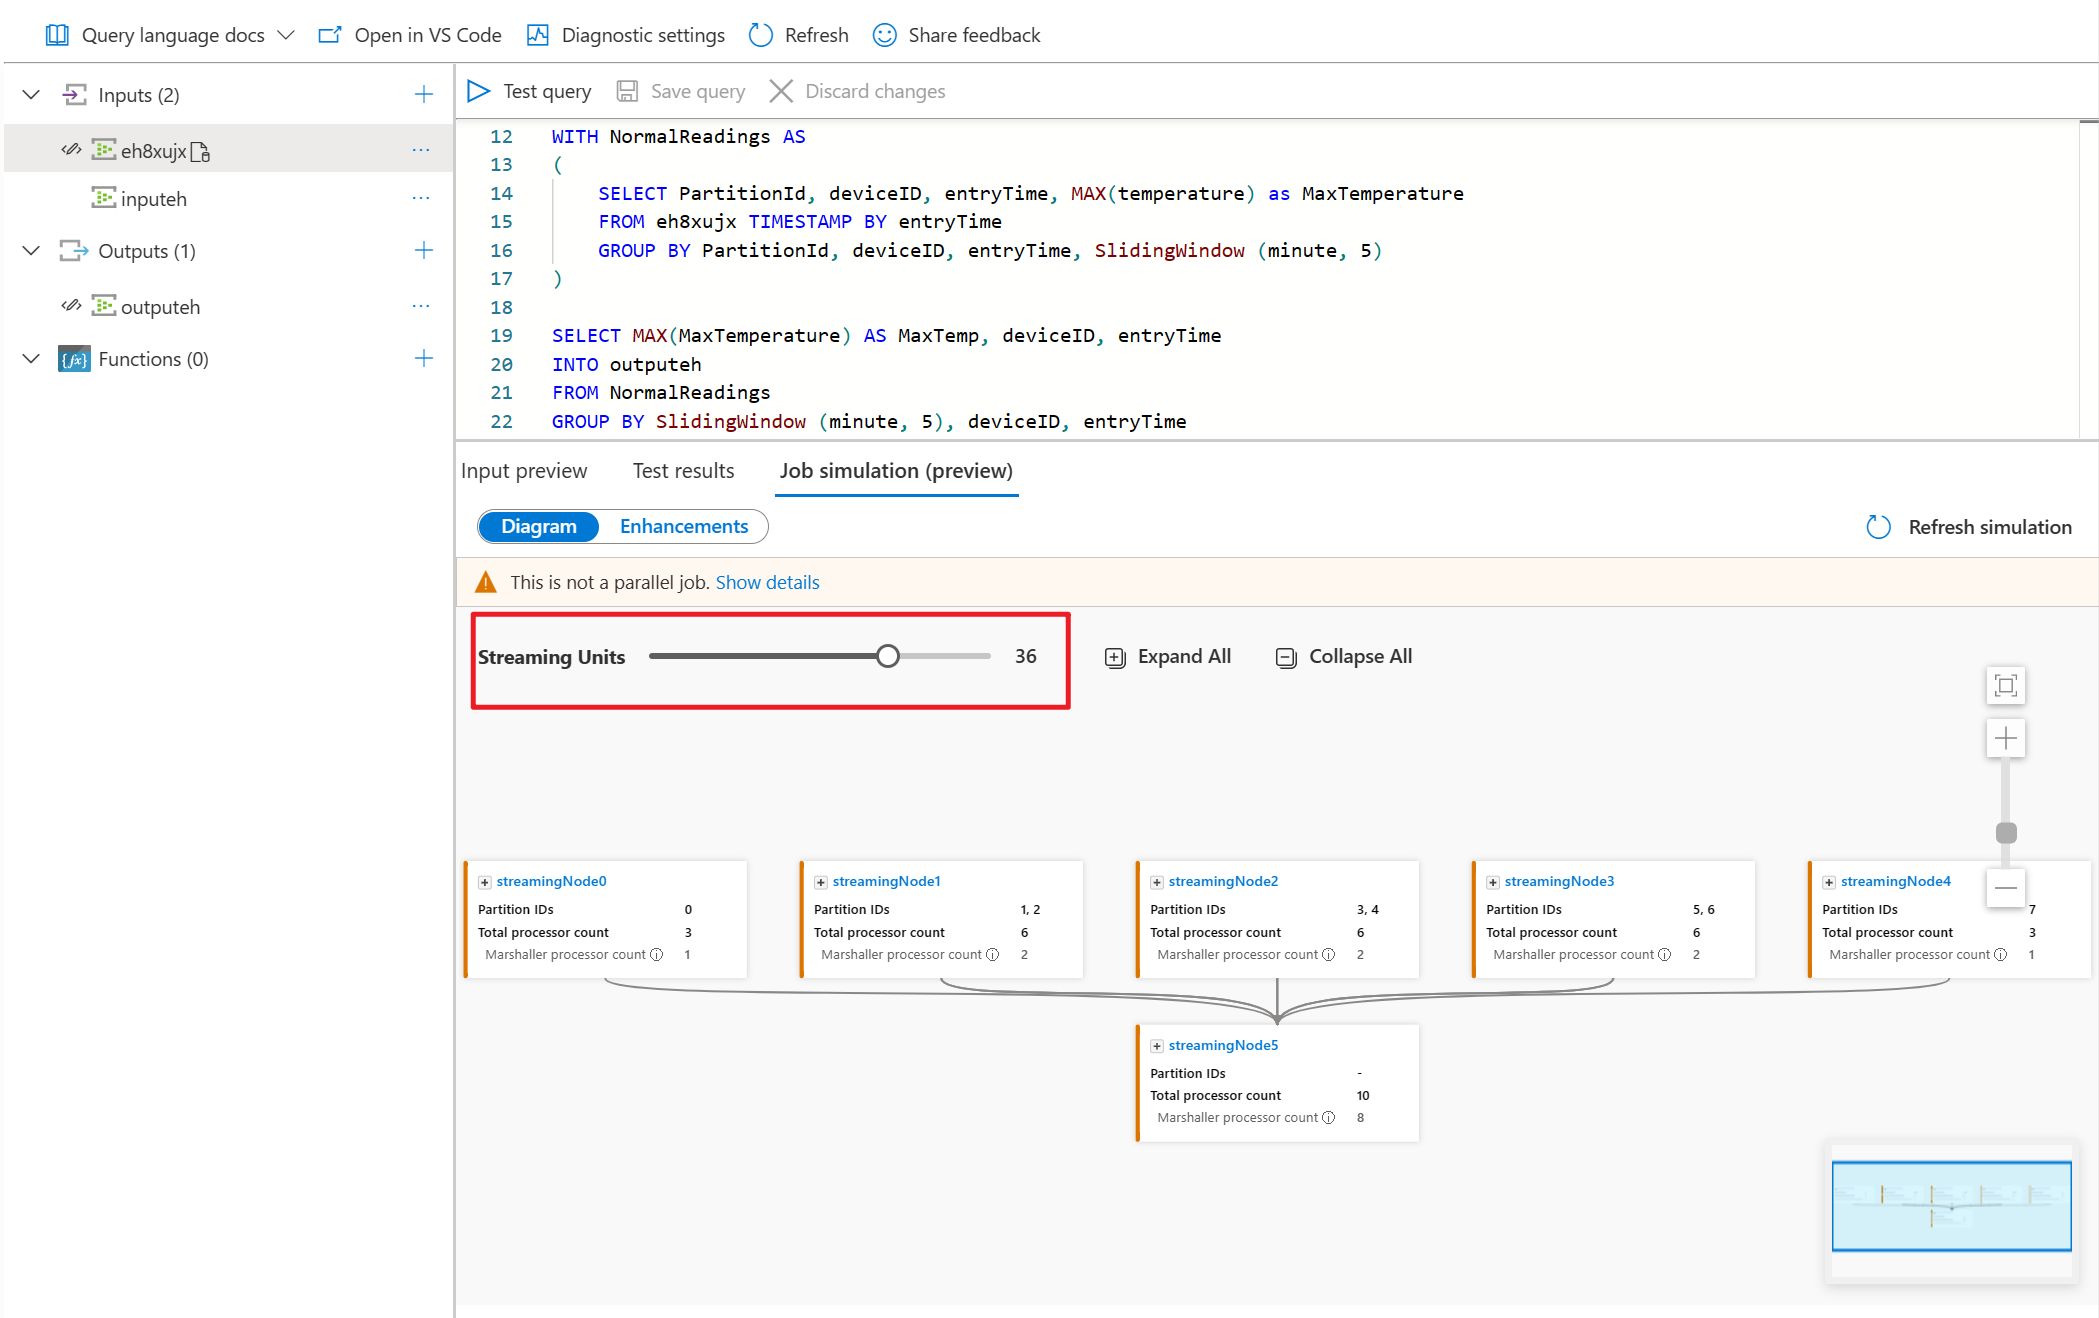
You can also adjust Streaming Units to stimulate how streaming nodes are allocated with different SUs. It gives you an idea of how many SUs you need to handle your workload.


Use job simulation in the Azure portal
- Go to your query editor in Azure portal and select Job simulation on the bottom pane. It simulates the job running topology based on your query and predefined streaming units.
- Select Enhancements to view the suggestions for improving the query parallelism.
- Adjust the streaming units to see how many SUs you needed for handling the workload.


Processor-level diagram
Once you've adjusted the streaming units to simulate the topology of your job, you can expand any of the streaming nodes to observe how your data is being processed at the processor level.

The processor-level diagram allows you to:
- observe how the input partitions are allocated and being processed at each streaming node.
- find out what the Time shift is for each computing processor.
- provide information on whether the Input and Output processors are aligned in parallel.
To map the processor with the query step, double select on the diagram. This feature helps you locate the query steps doing the aggregating.

Enhancement suggestions
Here are the explanations for Enhancements:
| Type | Meaning |
|---|---|
| Customized partition not supported | Change input ‘xxx’ partition key to ‘xxx’. |
| Number of partitions not matched | Input and output must have the same number of partitions. |
| Partition keys not matched | Input, output and each query step must use the same partition key. |
| Number of input partitions not matched | All inputs must have the same number of partitions. |
| Input partition keys not matched | All inputs must use the same partition key. |
| Low compatibility level | Upgrade CompatibilityLevel on JobConfig.json file. |
| Output partition key not found | You need to use specified partition key for the output. |
| Customized partition not supported | You can only use predefined partition keys. |
| Query step not using partition | Your query isn't using any PARTITION BY clause. |
Next steps
If you want to learn more about query parallelization and job diagram, check out these tutorials: