Note
Access to this page requires authorization. You can try signing in or changing directories.
Access to this page requires authorization. You can try changing directories.
Using Azure Virtual Desktop Insights can help you understand your deployments of Azure Virtual Desktop. It can help with checks such as which client versions are connecting, opportunities for cost saving, or knowing if you have resource limitations or connectivity issues. If you make changes, you can continually validate that the changes have the intended effect, and iterate if needed. This article provides some use cases for Azure Virtual Desktop Insights and example scenarios using the Azure portal.
Prerequisites
An existing host pool with session hosts, and a workspace configured to use Azure Virtual Desktop Insights.
You need to have active sessions for a period of time before you can make informed decisions.
Connectivity
Connectivity issues can have a severe impact on the quality and reliability of the end-user experience with Azure Virtual Desktop. Azure Virtual Desktop Insights can help you identify connectivity issues and understand where improvements can be made.
High latency
High latency can cause poor quality and slowness of a remote session. Maintaining ideal interaction times requires latency to generally be below 100 milliseconds, with a session broadly becoming of low quality over 200 ms. Azure Virtual Desktop Insights can help pinpoint gateway regions and users impacted by latency by looking at the round-trip time, so that you can more easily find cases of user impact that are related to connectivity.
To view round-trip time:
Sign in to Azure Virtual Desktop Insights in the Azure portal by browsing to https://aka.ms/avdi.
From the drop-down lists, select one or more subscriptions, resource groups, host pools, and specify a time range, then select the Connection Performance tab.
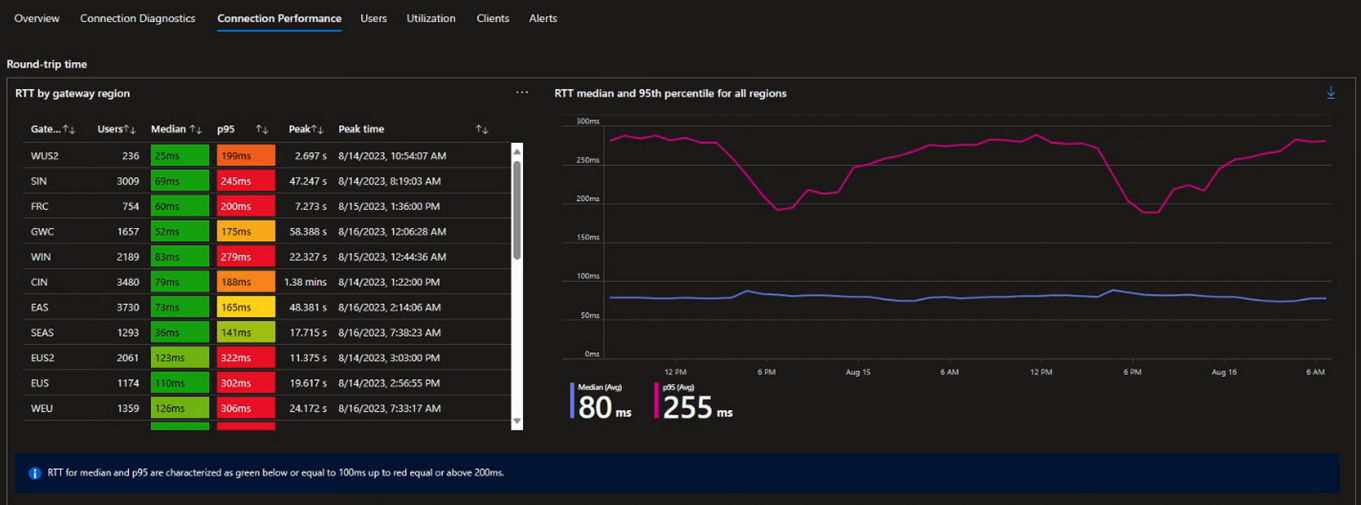
Review the section for Round-trip time and focus on the table for RTT by gateway region and the graph RTT median and 95th percentile for all regions. In the example below, most median latencies are under the ideal threshold of 100 ms, but several are higher. In many cases, the 95th percentile (p95) is substantially higher than the median, meaning that there are some users experiencing periods of higher latency.
Tip
You can find a list of the gateway region codes and their corresponding Azure region at Gateway region codes.
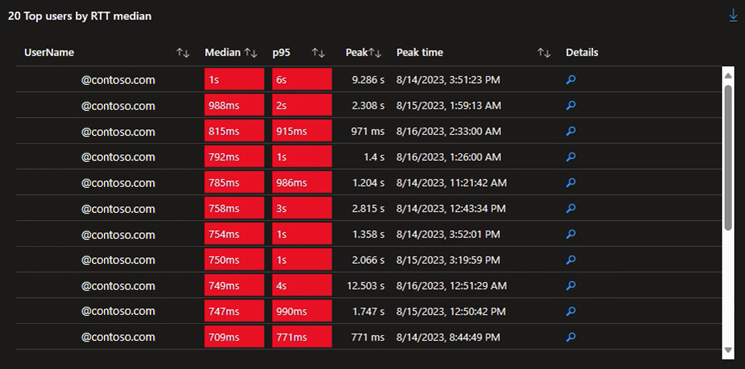
For the table RTT by gateway region, select Median, until the arrow next to it points down, to sort by the median latency in descending order. This order highlights gateways your users are reaching with the highest latency that could be having the most impact. Select a gateway to view the graph of its RTT median and 95th percentile, and filter the list of 20 top users by RTT median to the specific region.
In this example, the SAN gateway region has the highest median latency, and the graph indicates that over time users are substantially over the threshold for poor connection quality.

The list of users can be used to identify who is being impacted by these issues. You can select the magnifying glass icon in the Details column to drill down further into the data.


There are several possibilities for why latency might be higher than anticipated for some users, such as a poor Wi-Fi connection, or issues with their Internet Service Provider (ISP). However, with a list of impacted users, you have the ability to proactively contact and attempt to resolve end-user experience problems by understanding their network connectivity.
You should periodically review the round-trip time in your environment and the overall trend to identify potential performance concerns.
Connection reliability
The reliability of a connection can have a significant impact on the end-user experience. Azure Virtual Desktop Insights can help you understand disconnection events and correlations between errors that affect end users.
Connection reliability provides two main views to help you understand the reliability of your connections:
A graph showing the number of disconnections over the concurrent connections in a given time range. This graph enables you to easily detect clusters of disconnects that are impacting connection reliability.
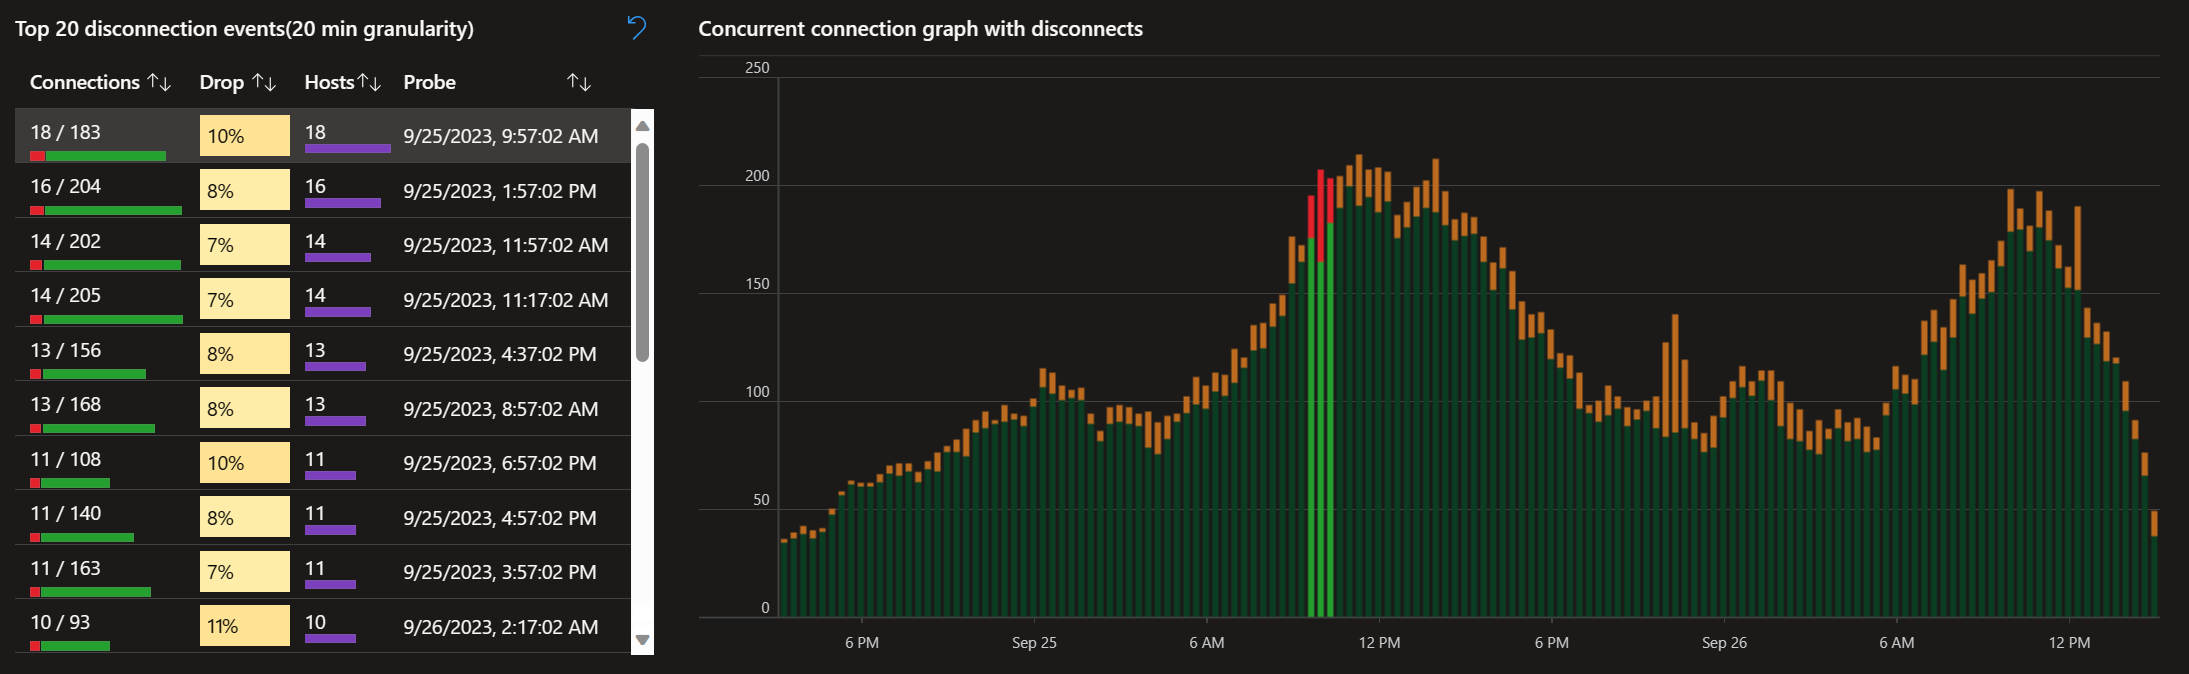
A table of the top 20 disconnection events, listing the top 20 specific time intervals where the most disconnections occurred. You can select a row in the table to highlight specific segments of the connection graph to view the disconnections that occurred at those specific time segments.
You can also analyze connection errors by different pivots to determine the root cause of disconnects and improve connection reliability. Here are the available pivots:
| Pivot | Description |
|---|---|
| Subscription | Groups events by the subscription that contains related resources. When more than one subscription has Azure Virtual Desktop resources, it helps to determine whether issues are scoped to one or more subscriptions. |
| Resource group | Groups events by the resource group that contains related resources. |
| Host pool | Groups events by host pool. |
| Transport | Groups events by the network transport layer used for connections, either UDP or TCP. For UDP, valid values are Multipath, Relay, ShortpathPublic, and ShortpathPrivate.For TCP, valid values are NotUsed and <> |
| Session host | Groups events by session host. |
| Session host IP/16 | Groups events by the IPv4 address of each session host, collated by the first two octets, for example (1.2.3.4). |
| Client type | Groups events by the client used to connect to a remote session, including platform and processor architecture of the connecting device. |
| Client version | Groups events by the version number of Windows App or the Remote Desktop app used to connect to a remote session. |
| Client IP/16 | Groups events by the IPv4 address of each client device connecting to a remote session, collated by the first two octets, for example (1.2.3.4). |
| Gateway region | Groups events by the Azure Virtual Desktop gateway region a client device connected through. For a list of gateway regions, see Gateway region codes. |
To view connection reliability information:
Sign in to Azure Virtual Desktop Insights in the Azure portal by browsing to https://aka.ms/avdi.
From the drop-down lists, select one or more subscriptions, resource groups, host pools, and specify a time range, then select the Connection Reliability tab. The table and graph populate with the top 20 disconnection events and a graph of concurrent connections and disconnections over time.
In the graph, review the number of disconnections (shown in red) over the count of concurrent connections (shown in green).
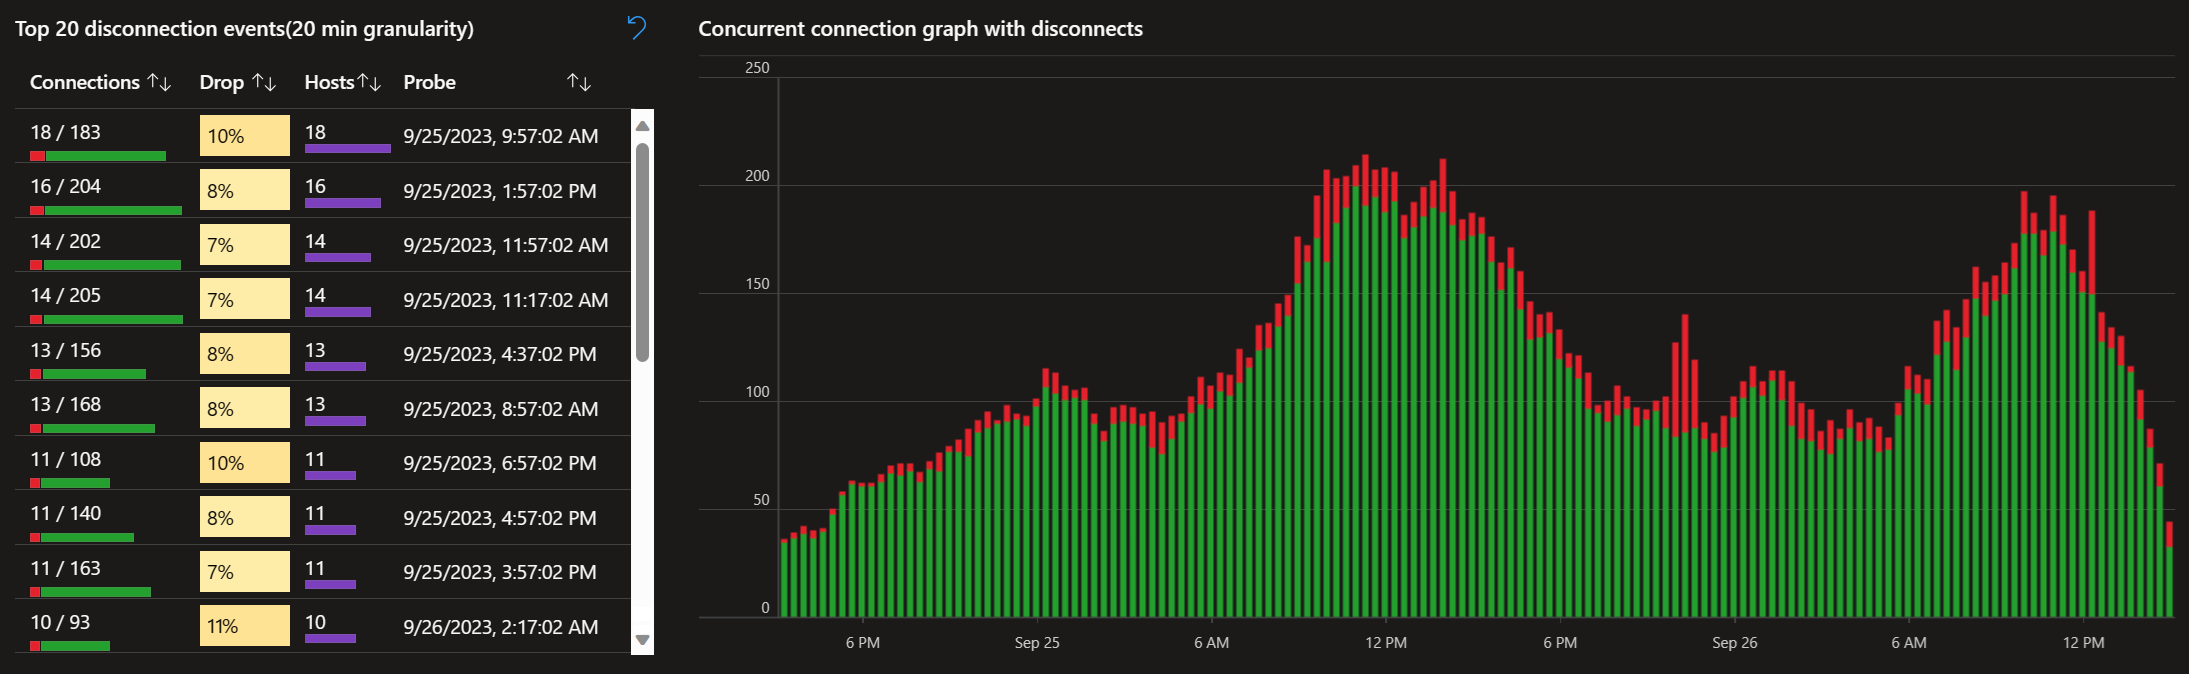
In the table, review the top 20 disconnection events. Select a row to highlight the specific time segment and neighboring time segments in the graph when the disconnections occurred.
When you select a row in the table, you can select one of the pivots to analyze the connection errors in further detail. You might need to scroll down to see all the relevant data available. By reviewing the connection errors across different pivots, you can look for commonalities of disconnections.

Select a specific time slice to view its details with the full list of connections in the time slice, their start and end dates, their duration, an indication of their success or failure, and the impacted user and session host.

To see the detailed history of a specific connection, select an entry in the Details section of a time slice. Selecting an entry generates a list of steps in the connection and any errors.


Session host performance
Issues with session hosts, such as where session hosts have too many sessions to cope with the workload end-users are running, can be a major cause of poor end-user experience. Azure Virtual Desktop Insights can provide detailed information about resource utilization and user input delay to allow you to more easily and quickly find if users are impacted by limitations for resources like CPU or memory.
To view session host performance:
Sign in to the Azure portal.
In the search bar, type Azure Virtual Desktop and select the matching service entry to go to the Azure Virtual Desktop overview.
Select Host pools, then select the name of the host pool for which you want to view session host performance.
Select Insights, specify a time range, then select the Host Performance tab.
Review the table for Input delay by host and the graph Median input delay over time to find a summary of the median and 95th percentile user input delay values for each session host in the host pool. Ideally the user input delay for each host should be below 100 milliseconds, and a lower value is better.
In the following example, the session hosts have a reasonable median user input delay, but occasionally values peak above the threshold of 100 ms, implying potential for impacting end-users.

If you find higher than expected user input delay (>100 ms), it can be useful to then look at the aggregated statistics for CPU, memory, and disk activity for the session hosts to see if there are periods of higher-than-expected utilization. The graphs for Host CPU and memory metrics, Host disk timing metrics, and Host disk queue length show either the aggregate across session hosts, or a selected session host's resource metrics.
In this example, there are some periods of higher disk read times that correlate with the higher user input delay.

For more information about a specific session host, select the Host Diagnostics tab.
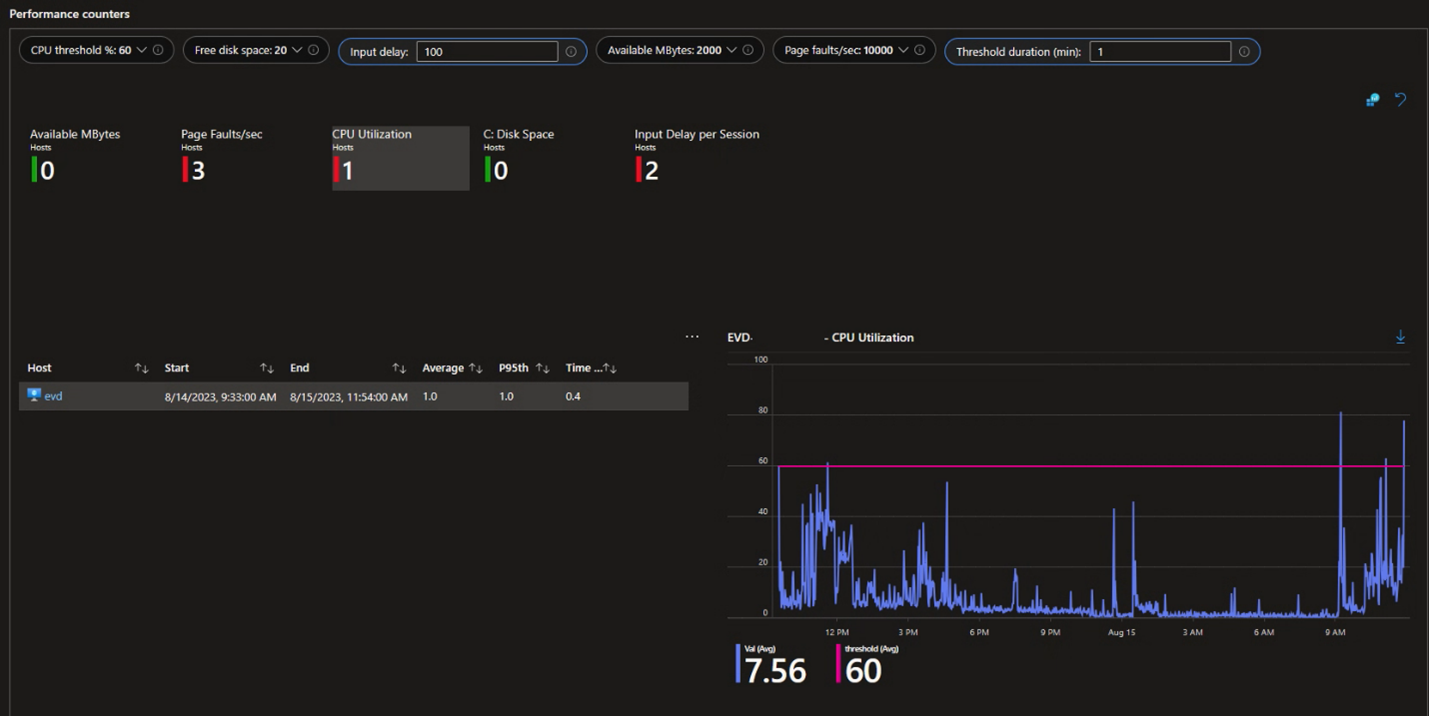
Review the section for Performance counters to see a quick summary of any devices that crossed the specified thresholds for:
- Available MBytes (available memory)
- Page Faults/sec
- CPU Utilization
- Disk Space
- Input Delay per Session
Selecting a parameter allows you to drill down and see the trend for a selected session host. In the following example, one session host had higher CPU usage (> 60%) for the selected duration (1 minute).


In cases where a session host has extended periods of high resource utilization, it’s worth considering increasing the Azure VM size of the session host to better accommodate user workloads.
Client version usage
A common source of issues for end-users of Azure Virtual Desktop is using older clients that might either be missing new or updated features, or contain known issues that are resolved with more recent versions. Azure Virtual Desktop Insights contains a list of the different clients in use, and identifying clients that might be out of date.
To view a list of users with outdated clients:
Sign in to Azure Virtual Desktop Insights in the Azure portal by browsing to https://aka.ms/avdi.
From the drop-down lists, select one or more subscriptions, resource groups, host pools, and specify a time range, then select the Clients tab.
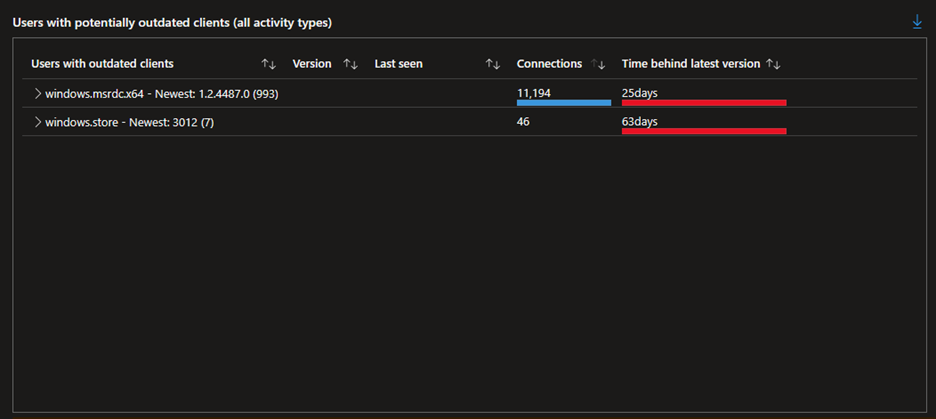
Review the section for Users with potentially outdated clients (all activity types). A summary table shows the highest version level of each client found connecting to your environment (marked as Newest) in the selected time range, and the count of users using outdated versions (in parentheses).
In the below example, the newest version of the Microsoft Remote Desktop Client for Windows (MSRDC) is 1.2.4487.0, and 993 users are currently using a version older. It also shows a count of connections and the number of days behind the latest version the older clients are.
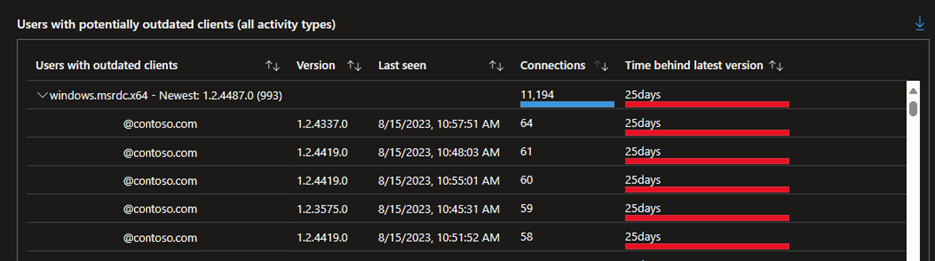
To find more information, expand a client for a list of users using an outdated version of that client, their versions, and the date last seen connecting with that version. You can export the data using the button in the top right-hand corner of the table for communication with the users or monitor the propagation of updates.


You should periodically review the versions of clients in use to ensure your users are getting the best experience.
Note
Some clients, such as Windows App on iOS/iPadOS and Android are listed in the report with their build number, not their version number. You can match the build number to the version number in the About section of Windows App settings.
Cost saving opportunities
Understanding the utilization of session hosts can help illustrate where there's potential to reduce spend by using a scaling plan, resize virtual machines, or reduce the number of session hosts in the pool. Azure Virtual Desktop Insights can provide visibility into usage patterns to help you make the most informed decisions about how best to manage your resources based on real user usage.
Session host utilization
Knowing when your session hosts are in peak demand, or when there are few or no sessions can help you make decisions about how to manage your session hosts. You can use autoscale to scale session hosts based on usage patterns. Azure Virtual Desktop Insights can help you identify broad patterns of user activity across multiple host pools. If you find opportunities to scale session hosts, you can use this information to create a scaling plan.
To view session host utilization:
Sign in to Azure Virtual Desktop Insights in the Azure portal by browsing to https://aka.ms/avdi.
From the drop-down lists, select one or more subscriptions, resource groups, host pools, and specify a time range, then select the Utilization tab.
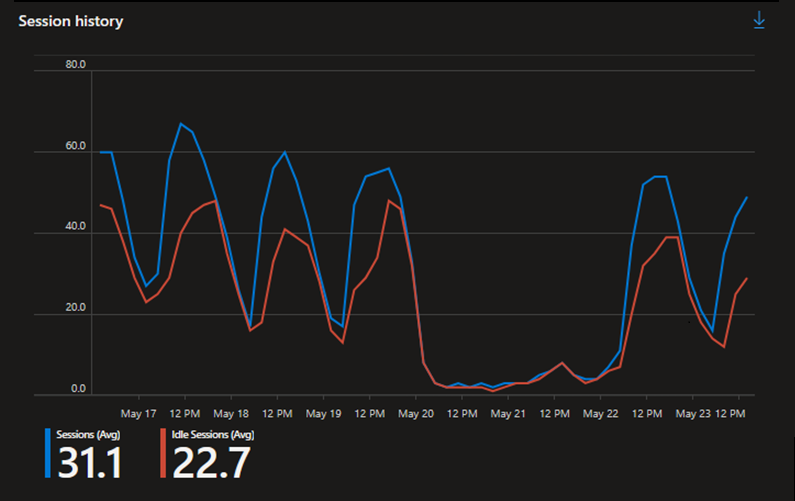
Review the Session history chart, which displays the number of active and idle (disconnected) sessions over time. Identify any periods of high activity, and periods of low activity from the peak user session count and the time period in which the peaks occur. If you find a regular, repeated pattern of activity, it usually implies there's a good opportunity to implement a scaling plan.
In this example, the graph shows the number of users sessions over the course of a week. Peaks occur at around midday on weekdays, and there's a noticeable lack of activity over the weekend. This pattern suggests that there's an opportunity to scale session hosts to meet demand during the week, and reduce the number of session hosts over the weekend.
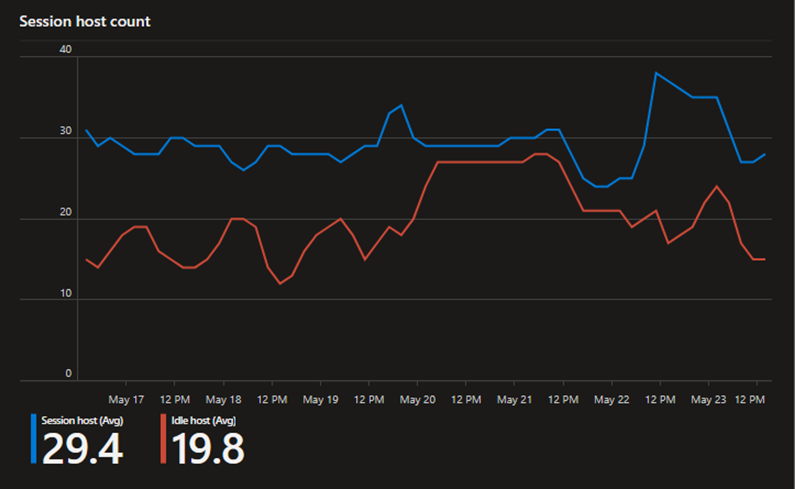
Use the Session host count chart to note the average number of active session hosts over time, and particularly the average number of session hosts that are idle (no sessions). Ideally session hosts should be actively supporting connected sessions and active workloads, and powered off when not in use by using a scaling plan. You'll likely need to keep a minimum number of session hosts powered on to ensure availability for users at irregular times, so understanding usage over time can help find an appropriate number of session hosts to keep powered on as a buffer.
Even if a scaling plan is ultimately not a good fit for your usage patterns, there's still an opportunity to balance the total number of session hosts available as a buffer by analyzing the session demand and potentially reducing the number of idle devices.
In this example, the graph shows there are long periods over the course of a week where idle session hosts are powered on and therefore increasing costs.
Use the drop-down lists to reduce the scope to a single host pool and repeat the analysis for session history and session host count. At this scope, you can identify patterns that are specific to the session hosts in a particular host pool to help develop a scaling plan for that host pool.
In this example, the first graph shows the pattern of user activity throughout a week between 6AM and 10PM. On the weekend, there's minimal activity. The second graph shows the number of active and idle session hosts throughout the same week. There are long periods of time where idle session hosts are powered on. Use this information to help determine optimal ramp-up and ramp-down times for a scaling plan.


Create a scaling plan based on the usage patterns you identify, then assign the scaling plan to your host pool.


After a period of time, you should repeat this process to validate that your session hosts are being utilized effectively. You can make changes to the scaling plan if needed, and continue to iterate until you find the optimal scaling plan for your usage patterns.