Note
Access to this page requires authorization. You can try signing in or changing directories.
Access to this page requires authorization. You can try changing directories.
Note
Bing Maps Web Control SDK retirement
Bing Maps Web Control SDK is deprecated and has been retired for all free (Basic) account customers. Enterprise account customers can continue to use Bing Maps Web Control SDK until June 30th, 2028. To avoid service disruptions, all enterprise account customers using Bing Maps Web Control SDK will need to be updated to use Azure Maps Web SDK by June 30th, 2028. For detailed migration guidance, see Migrate from Bing Maps Web Control SDK and Migrate Bing Maps Enterprise applications to Azure Maps with GitHub Copilot.
Azure Maps is Microsoft's next-generation maps and geospatial services for developers. Azure Maps has many of the same features as Bing Maps for Enterprise, and more. To get started with Azure Maps, create a free Azure subscription and an Azure Maps account. For more information about azure Maps, see Azure Maps Documentation. For migration guidance, see Bing Maps Migration Overview.
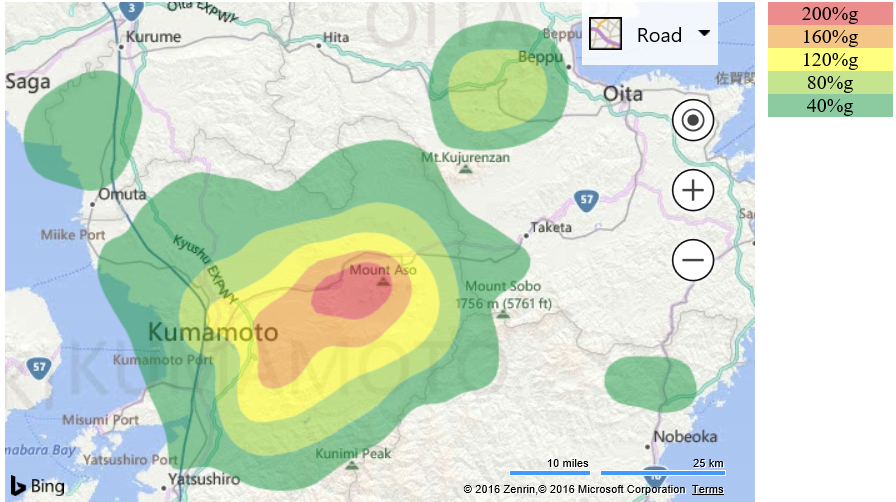
This example downloads earthquake intensity contour data from the USGS for earthquake M7.0 – 1km WSW of Kumamoto-shi, Japan. The contour areas are colored based on the intensity of the earthquake felt in that area.
<!DOCTYPE html>
<html>
<head>
    <title></title>
    <meta charset="utf-8" />

    <script type='text/javascript'
            src='https://www.bing.com/api/maps/mapcontrol?callback=GetMap'
            async defer></script>

    <script type='text/javascript'>
    var map;

    //URL to the USGS for Earthquake intensity contours of M7.0 – 1km WSW of Kumamoto-shi, Japan.
    var earthquakeIntensityDataUrl = 'http://earthquake.usgs.gov/archive/product/shakemap/us20005iis/us/1467057010522/download/cont_psa03.json';

    function GetMap()
    {
        map = new Microsoft.Maps.Map('#myMap', {
            credentials: 'Your Bing Maps Key',
            center: new Microsoft.Maps.Location(32.944332, 131.074968),
            zoom: 9
        });


        //Load the Contour and GeoJson modules.
        Microsoft.Maps.loadModule(['Microsoft.Maps.Contour', 'Microsoft.Maps.GeoJson'], function () {
            //Download the contour data from the USGS. Downloading data directly as endpint does not support JSONP requests, but does support CORs.
            downloadData(earthquakeIntensityDataUrl, function (earthquakeData) {
                //Parse the GeoJson earthquake intensity contour data and create contour lines out of them.
                var data = Microsoft.Maps.GeoJson.read(earthquakeData);

                var contourLines = [];
                for (var i = 0; i < data.length; i++) {
                    contourLines.push(new Microsoft.Maps.ContourLine(data[i].getLocations(), data[i].metadata.value));
                }

                //Add the contour lines to a contour layer.
                var layer = new Microsoft.Maps.ContourLayer(contourLines, {
                    colorCallback: assignContourColor,
                    polygonOptions: {
                        //Make the outlines of the contour area transparent.
                        strokeColor: 'rgba(0, 0, 0, 0)'
                    }
                });

                //Add the contour layer to the map.
                map.layers.insert(layer);
            });
        });
    }

    //A function that contains business logic that specifies which color to make a contour area based on it's value.
    function assignContourColor(value) {
        var color = 'rgba(25, 150, 65, 0.5)';

        if (value >= 200) {
            color = 'rgba(215, 25, 28, 0.5)';
        }
        else if (value >= 160) {
            color = 'rgba(235, 140, 14, 0.5)';
        }
        else if (value >= 120) {
            color = 'rgba(255, 255, 0, 0.5)';
        }
        else if (value >= 80) {
            color = 'rgba(140, 202, 32, 0.5)';
        }

        return color;
    }

    //A simple function that downloads data from a URL and passes it back though a callback function.
    function downloadData(url, callback) {
        var xhr = new XMLHttpRequest();
        xhr.open("GET", url, true);
        xhr.onreadystatechange = function (e) {
            if (xhr.readyState === 4) {
                callback(xhr.response);
            }
        };
        xhr.send();
    }
    </script>
    <style>
        .contourLegend {
            margin-left: 10px;
            float: left;
            text-align: center;
            width: 100px;
        }
    </style>
</head>
<body>
    <div id="myMap" style="position:relative;width:600px;height:400px;float:left;"></div>

    <div class="contourLegend">
        <div style="background-color: rgba(215, 25, 28, 0.5)">200%g</div>
        <div style="background-color: rgba(235, 140, 14, 0.5)">160%g</div>
        <div style="background-color: rgba(255, 255, 0, 0.5)">120%g</div>
        <div style="background-color: rgba(140, 202, 32, 0.5)">80%g</div>
        <div style="background-color: rgba(25, 150, 65, 0.5)">40%g</div>
    </div>
</body>
</html>
Running this code in a browser will display color code areas which represent the earthquake intensity measured in that area.