Note
Access to this page requires authorization. You can try signing in or changing directories.
Access to this page requires authorization. You can try changing directories.
What is a Heatmap?
A Heatmap (or Heat map) is a visualization tool that makes it easy to analyze aggregated information about how users interact with the app.
Clarity tracks all user taps on device and automatically generates a heat map. This data helps you identify the most engaged areas and figure out gaps.
Why use Clarity heatmaps?
- Clarity heat maps are created on the fly. There's no creation delay. Heat maps return within a matter of seconds.
- Aggregate data helps quantify behaviors and trends. This data helps identify what content is best working for your app.
- Easy to communicate impact to stakeholders through color scaling.
Heatmaps zero state
Note
You can view zero state Heatmaps only if there's no applied Visited screen filter.
Once you onboard and go to Heatmaps, you can view the list of popular screens. Adjust your Filters and Segments to view the list of popular screens as you prefer. These popular screens are sorted based on the highest number of sessions.
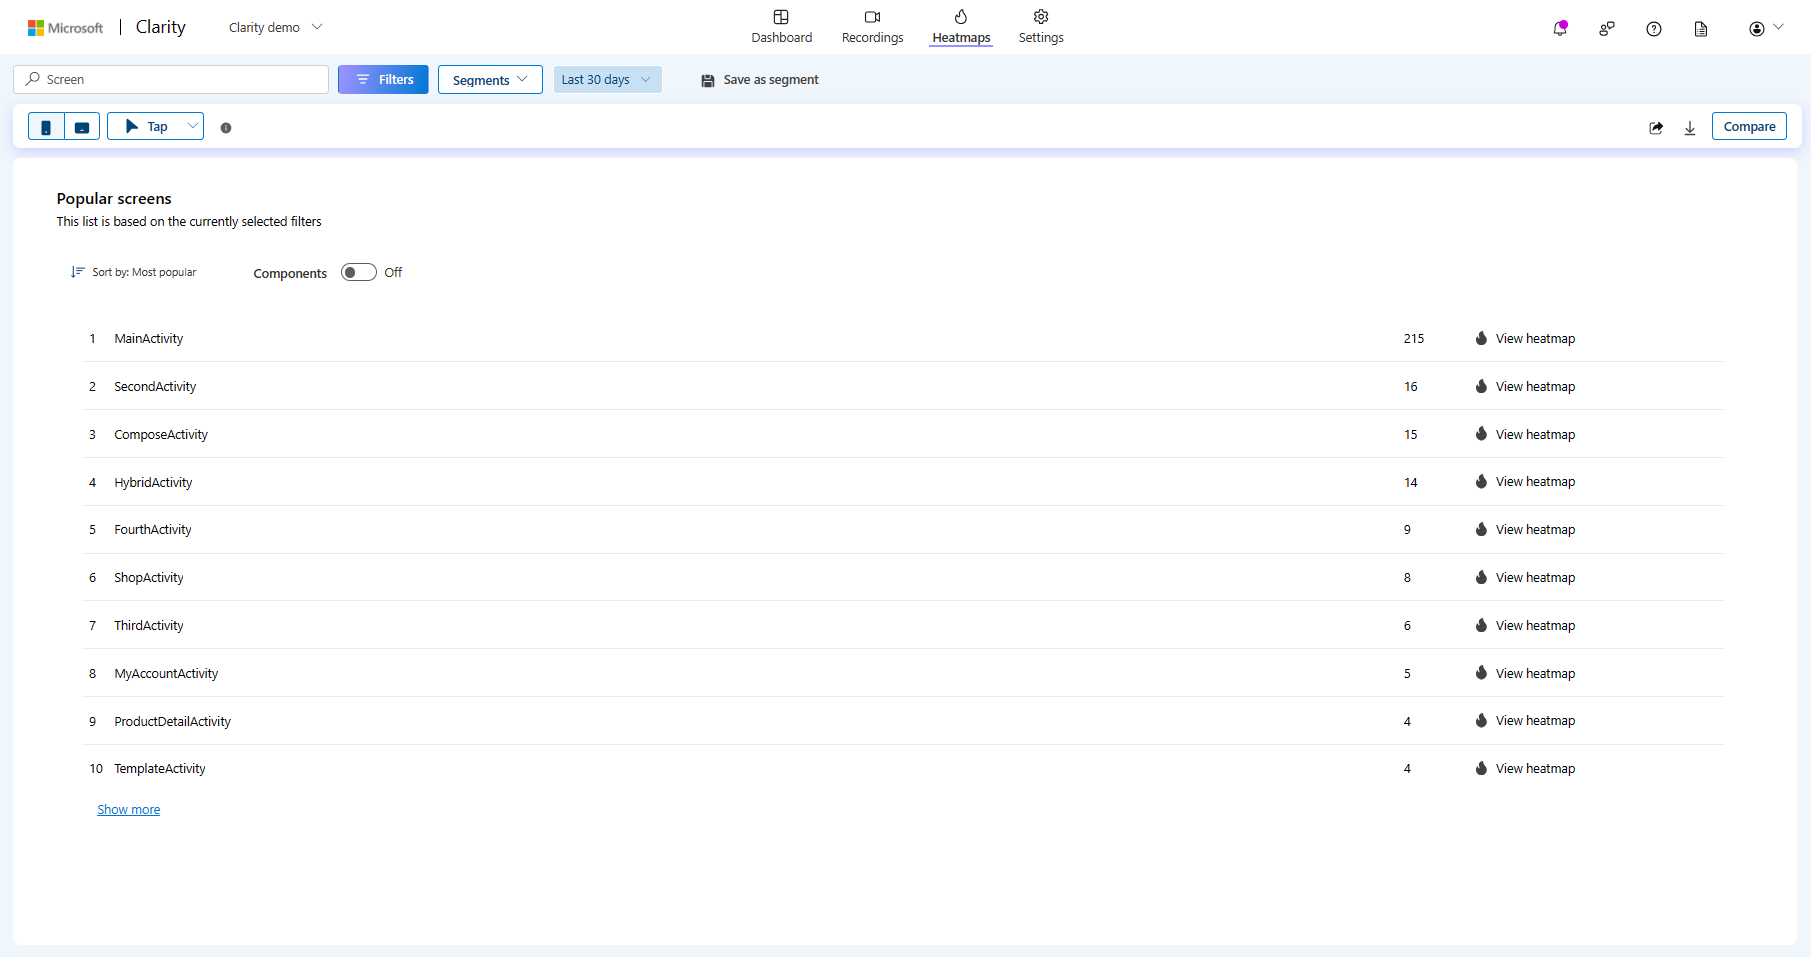
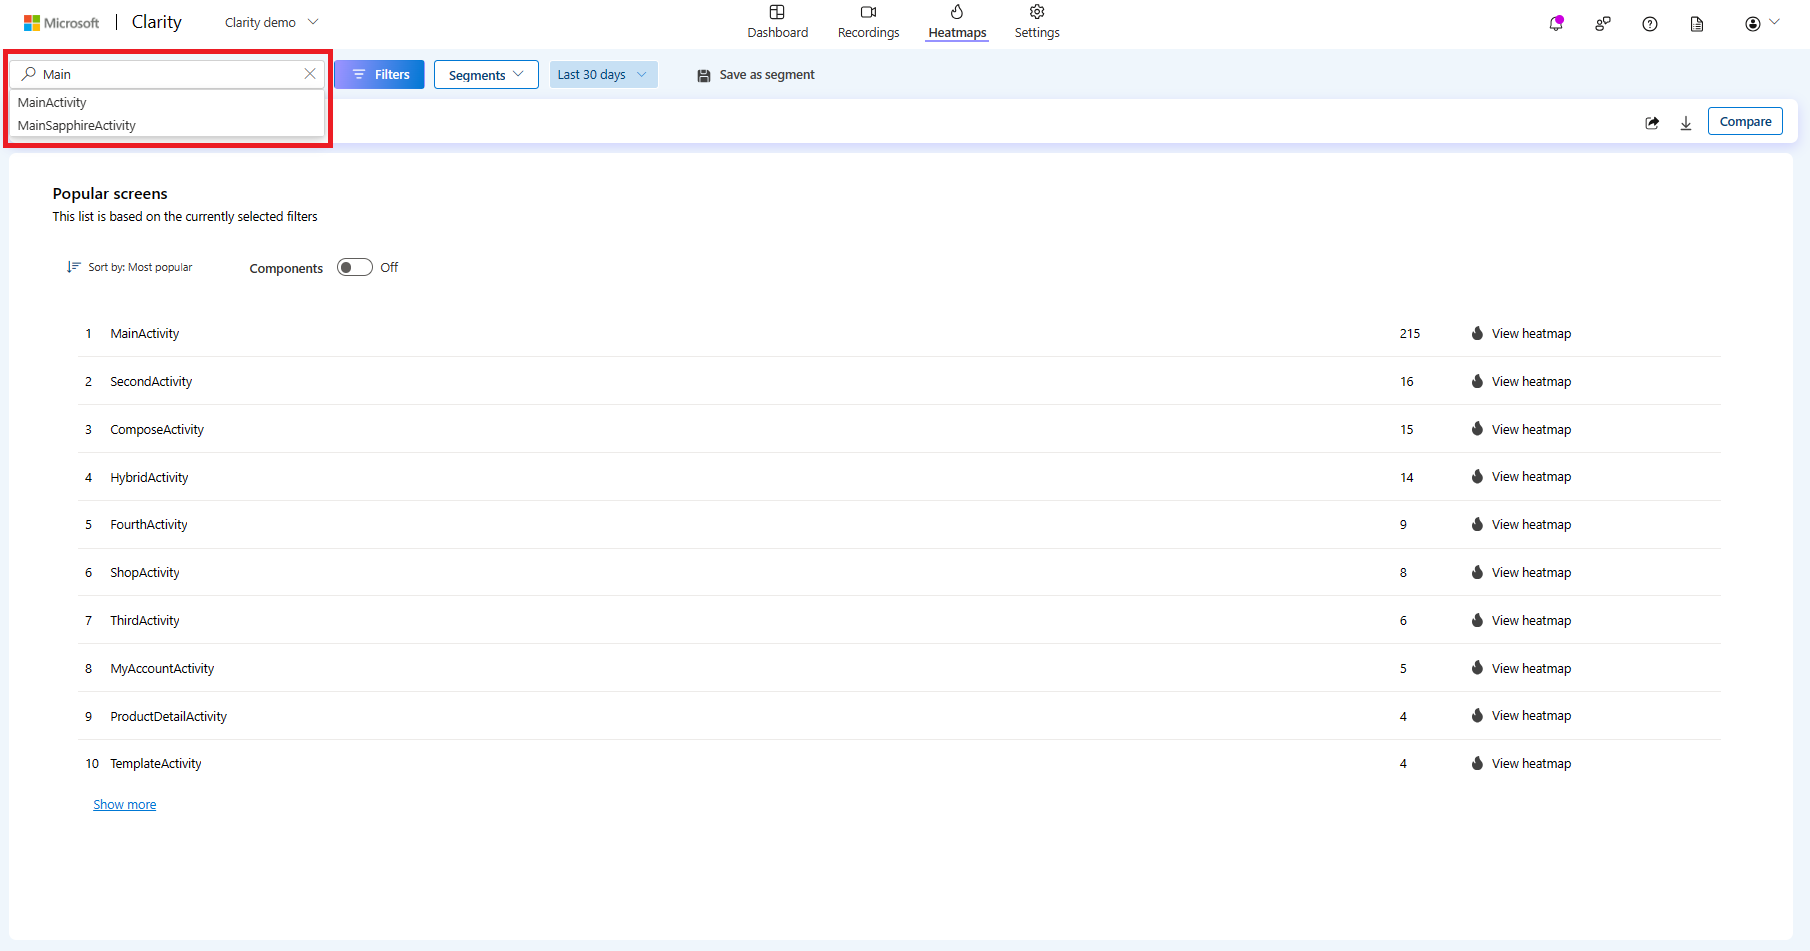
You can also enter/select a screen as shown:
Suppose you already set a visited screen filter in Recordings or Dashboard vertical. You can view the heatmap for the set visited screen instead of zero state when you go to Heatmaps vertical.
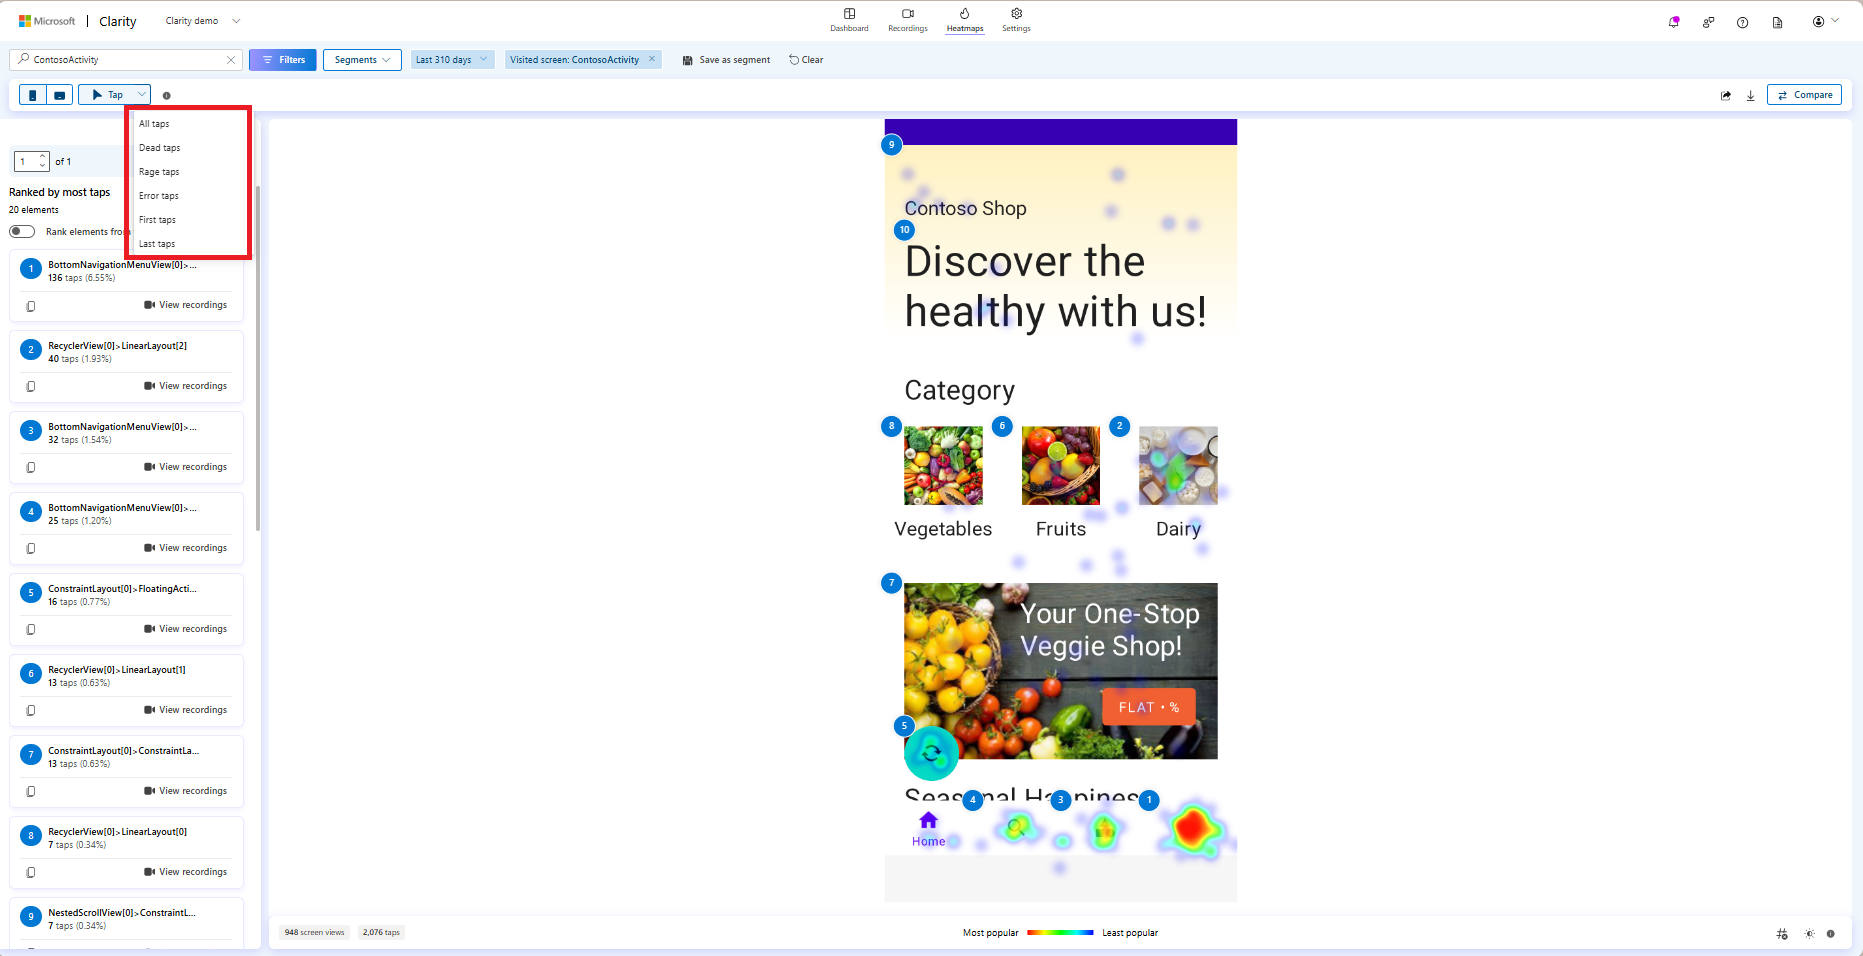
Taps map
Taps map shows where users are tapping on your app. It gives information about the most tapped elements and how many taps on these elements.
There are different types of Taps map:
- All taps
- Dead taps
- Rage taps
- Error taps
- First tap
- Last tap
Tip
Learn more about Taps map here.
FAQ
For more answers, refer to FAQ.