Note
Access to this page requires authorization. You can try signing in or changing directories.
Access to this page requires authorization. You can try changing directories.
Azure Data Explorer and Microsoft Fabric eventhouses are fast and highly scalable data exploration services. You can explore data in Microsoft Fabric or the Azure Data Explorer web application by running queries or building dashboards. A dashboard is a collection of queries visualized as tiles and organized into pages. The FinOps toolkit provides a custom dashboard with pages design to facilitate FinOps capabilities. This article walks you through the process of deploying and configuring this dashboard.
This walkthrough does not incur any cost; however, maintaining an active Data Explorer cluster does incur cost.
Prerequisites
- Deployed a FinOps hub instance with Data Explorer.
- Configured scopes and ingested data successfully.
- Database viewer or greater access to the Data Explorer Hub and Ingestion databases. Learn more.
- Optional: Member or Contributor access to a Microsoft Fabric eventhouse with FinOps hub Hub and Ingestion databases. Learn more.
Deploy the dashboard
- Download the latest dashboard template.
- Copy the Data Explorer cluster URI:
- Go to the list of resource groups in the Azure portal.
- Select the resource group where your FinOps hub instance was deployed.
- Select Settings > Deployments > hub > Outputs.
- Copy the clusterUri output value.
- Create a dashboard from the template:
- Go to Azure Data Explorer dashboards.
- Select the down arrow next to the New dashboard button.
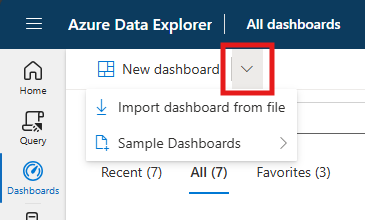
- Select the Import dashboard from file option.
- Browse to and select the finops-hub-dashboard.json file from step one.
- Specify the desired name and select Create.
- Connect the dashboard to your cluster:
- At the top of the page, select Data sources.
- In the pane on the right, select the pencil under Hub.
- Paste the Cluster URI from step two.
- Select the Connect button and then select the Hub database.
- Select Apply and then Close.

Note that Data Explorer dashboards are only accessible to the person who creates them by default. Access to the data is controlled at the database level, so access to a dashboard does not grant access to the underlying data. Be sure to share access to the dashboard and the Hub and Ingestion databases in order for people to see the functional dashboard.
You can now explore the FinOps hub dashboard.
Customize the dashboard
The FinOps hub dashboard is a sample dashboard that is intended to be customized. We encourage you to customize the dashboard to meet specific stakeholder needs and copy queries to other dashboards. To learn more about creating and customizing dashboards, refer to the following articles:
Note that customized dashboards can't be merged with future releases of the FinOps toolkit from the dashboard editor. If you need to customize the dashboard, consider using Git or another source control solution.
Grant access to data
Dashboards query data in the Ingestion database using functions in the Hub database. Due to this, dashboard users must have Viewer (or greater) access to both the Hub and Ingestion databases. Alternatively, users can have AllDatabasesViewer access to the entire cluster.
If using a Fabric real-time dashboard with the dashboard editor's identity, you can skip this step.
- Open the Data Explorer cluster in the Azure portal.
- In the menu, select Data > Databases.
- Select the Hub database.
- In the menu, select Overview > Permissions.
- Select the Add command, then the desired security role. Viewer is the least-privileged role.
- Select the desired users, groups, and applications, then select the Select button.
- Repeat steps 3-6 for the Ingestion database.
In addition to configuring access in the respective portal, you can also configure access at a database level via KQL commands. The following KQL can be run from the cluster's Query page in the Azure portal, from the Data Explorer portal, or from a Microsoft Fabric queryset or PySpark notebook.
.add database Hub viewers ('aaduser=<email>', 'aadGroup=<group-id>', 'aadapp=<app-id>;<tenant-id-or-domain>')

.add database Ingestion viewers ('aaduser=<email>', 'aadGroup=<group-id>', 'aadapp=<app-id>;<tenant-id-or-domain>')
For additional details, see Database level security role.
Alternatives to dashboards
While dashboards are free and simple to configure, you may have requirements that necessitate another reporting solution. Some examples might be bringing in data outside of Data Explorer or merging with existing reports used by stakeholders across the organization. We recommend everyone deploy the FinOps hub dashboard, but if you need other options, consider utilizing the FinOps toolkit Power BI reports.
The KQL reports are tuned to take advantage of the performance enhancements offered by Azure Data Explorer. This is the fastest, most scalable option for organizations analyzing over $2 million per month in spend or more than one year of data in Power BI.
You may also consider using Azure workbooks in the Azure portal or utilizing other tools that support connecting to Azure Data Explorer, like Excel, Grafana, and Tableau. To learn more about these and other tools that support Azure Data Explorer, see Visualization integrations overview.
Give feedback
Let us know how we're doing with a quick review. We use these reviews to improve and expand FinOps tools and resources.
If you're looking for something specific, vote for an existing or create a new idea. Share ideas with others to get more votes. We focus on ideas with the most votes.
Related content
Related FinOps capabilities:
Related products:
Related solutions: