Note
Access to this page requires authorization. You can try signing in or changing directories.
Access to this page requires authorization. You can try changing directories.
You can configure automatic log upload for continuous reports in Defender for Cloud Apps using a Docker on an on-premises Ubuntu or CentOS server.
Important
If you're using RHEL version 7.1 or higher, you must use Podman for automatic log collection instead of Docker. For more information, see Configure automatic log upload using Podman.
Prerequisites
| Specification | Description |
|---|---|
| Operating system | One of the following: |
| Disk space | 250 GB |
| CPU cores | 2 |
| CPU Architecture | Intel 64 and AMD 64 |
| RAM | 4 GB |
Make sure to set your firewall as needed. For more information, see Network requirements.
Remove an existing log collector
If you have an existing log collector and want to remove it before deploying it again, or if you simply want to remove it, run the following commands:
docker stop <collector_name>
docker rm <collector_name>
Log collector performance
The log collector can successfully handle log capacity of up to 50 GB per hour. The main bottlenecks in the log collection process are:
Network bandwidth - Your network bandwidth determines the log upload speed.
I/O performance of the virtual machine - Determines the speed at which logs are written to the log collector's disk. The log collector has a built-in safety mechanism that monitors the rate at which logs arrive and compares it to the upload rate. In cases of congestion, the log collector starts to drop log files. If your setup typically exceeds 50 GB per hour, it's recommended that you split the traffic between multiple log collectors.
Step 1 – Web portal configuration: Define data sources and link them to a log collector
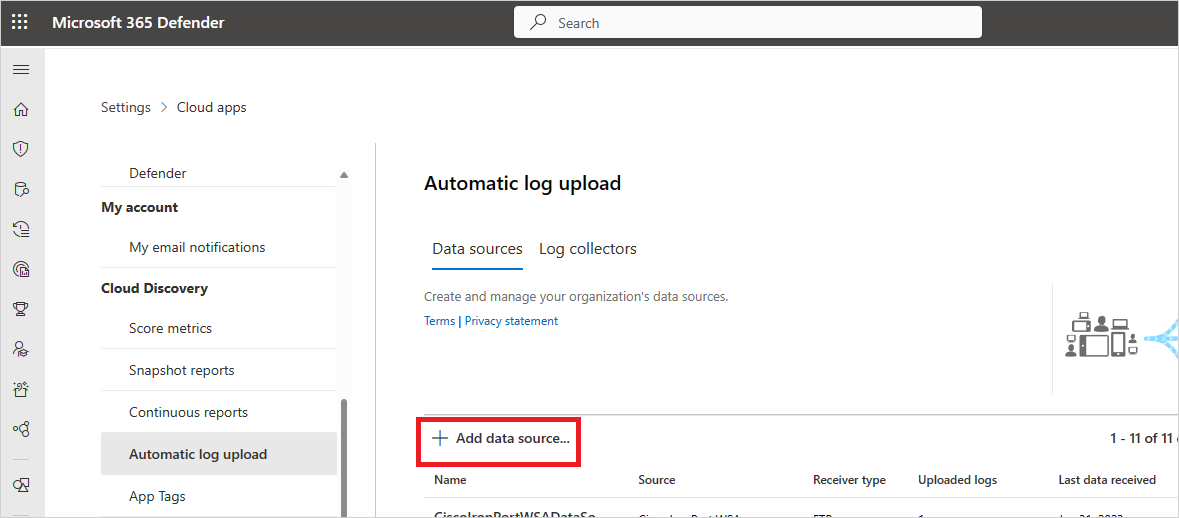
In the Microsoft Defender portal, select Settings > Cloud Apps > Cloud Discovery > Automatic log upload > Data sources tab.
For each firewall or proxy from which you want to upload logs, create a matching data source.
Select +Add data source.
Name your proxy or firewall.
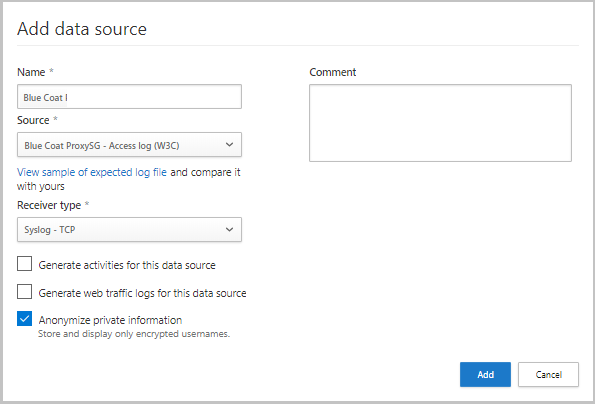
Select the appliance from the Source list. If you select Custom log format to work with a network appliance that isn't listed, see Working with the custom log parser for configuration instructions.
Compare your log with the sample of the expected log format. If your log file format doesn't match this sample, you should add your data source as Other.
Set the Receiver type to either FTP, FTPS, Syslog – UDP, or Syslog – TCP, or Syslog – TLS.
Note
Integrating with secure transfer protocols (FTPS and Syslog – TLS) often requires additional settings for your firewall/proxy.
Repeat this process for each firewall and proxy whose logs can be used to detect traffic on your network. We recommend that you set up a dedicated data source per network device to enable you to:
- Monitor the status of each device separately, for investigation purposes.
- Explore Shadow IT Discovery per device, if each device is used by a different user segment.
At the top of the page, select the Log collectors tab and then select Add log collector.
In the Create log collector dialog:
In the Name field, enter a meaningful name for your log collector.
Give the log collector a name and enter the Host IP address (private IP address) of the machine you'll use to deploy the Docker. The host IP address can be replaced with the machine name, if there's a DNS server (or equivalent) that will resolve the host name.
Select all Data sources that you want to connect to the collector, and select Update to save the configuration.
Further deployment information appears in the Next steps section, including a command you'll use later to import the collector configuration. If you selected Syslog, this information also includes data about which port the Syslog listener is listening on.
Use the
 Copy button to copy the command to the clipboard and save it to a separate location.
Use the
 Export button to export the expected data source configuration. This configuration describes how you should set the log export in your appliances.
For users sending log data via FTP for the first time, we recommend changing the password for the FTP user. For more information, see Changing the FTP password.
Step 2 – On-premises deployment of your machine
The following steps describe the deployment in Ubuntu. The deployment steps for other supported platforms might be slightly different.
Open a terminal on your Ubuntu machine.
Change to root privileges by running:
sudo -iTo bypass a proxy in your network, run the following two commands:
export http_proxy='<IP>:<PORT>' (e.g. 168.192.1.1:8888)
export https_proxy='<IP>:<PORT>'
If you accept the software license terms, uninstall old versions and install Docker CE by running the commands appropriate for your environment:
Remove old versions of Docker:
yum erase docker docker-engine docker.ioInstall Docker engine prerequisites:
yum install -y yum-utilsAdd Docker repository:
yum-config-manager --add-repo https://download.docker.com/linux/centos/docker-ce.repo
yum makecache
Install Docker engine:
yum -y install docker-ceStart Docker:
systemctl start docker
systemctl enable docker
Test Docker installation:
docker run hello-world
Deploy the collector image on the hosting machine by importing the collector configuration. Import the configuration by copying the run command generated in the portal. If you need to configure a proxy, add the proxy IP address and port number. For example, if your proxy details are 172.31.255.255:8080, your updated run command is:
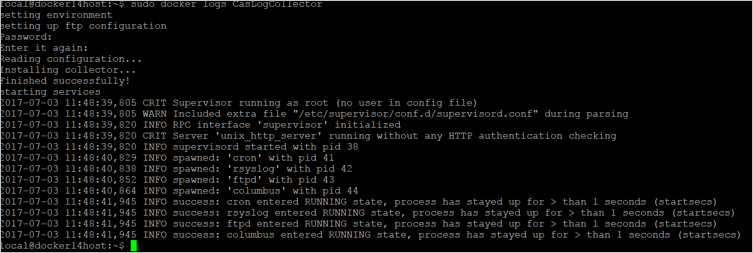
(echo 6f19225ea69cf5f178139551986d3d797c92a5a43bef46469fcc997aec2ccc6f) | docker run --name MyLogCollector -p 21:21 -p 20000-20099:20000-20099 -e "PUBLICIP='10.255.255.255'" -e "PROXY=172.31.255.255:8080" -e "CONSOLE=tenant.portal.cloudappsecurity.com" -e "COLLECTOR=MyLogCollector" --security-opt apparmor:unconfined --cap-add=SYS_ADMIN --restart unless-stopped -a stdin -i mcr.microsoft.com/mcas/logcollector starterVerify that the collector is running properly with the following command:
docker logs <collector_name>You should see the message: Finished successfully! For example:
Step 3 - On-premises configuration of your network appliances
Configure your network firewalls and proxies to periodically export logs to the dedicated Syslog port or the FTP directory according to the directions in the dialog. For example:
BlueCoat_HQ - Destination path: \<<machine_name>>\BlueCoat_HQ\
Step 4 - Verify the successful deployment in the portal
Check the collector status in the Log collector table and make sure the status is Connected. If it's Created, it's possible the log collector connection and parsing haven't completed.

You can also go to the Governance log and verify that logs are being periodically uploaded to the portal.
Alternatively, you can check the log collector status from within the docker container using the following commands:
Sign in to the container:
docker exec -it <Container Name> bashVerify the log collector status:
collector_status -p
If you have problems during deployment, see Troubleshooting cloud discovery.
Optional - Create custom continuous reports
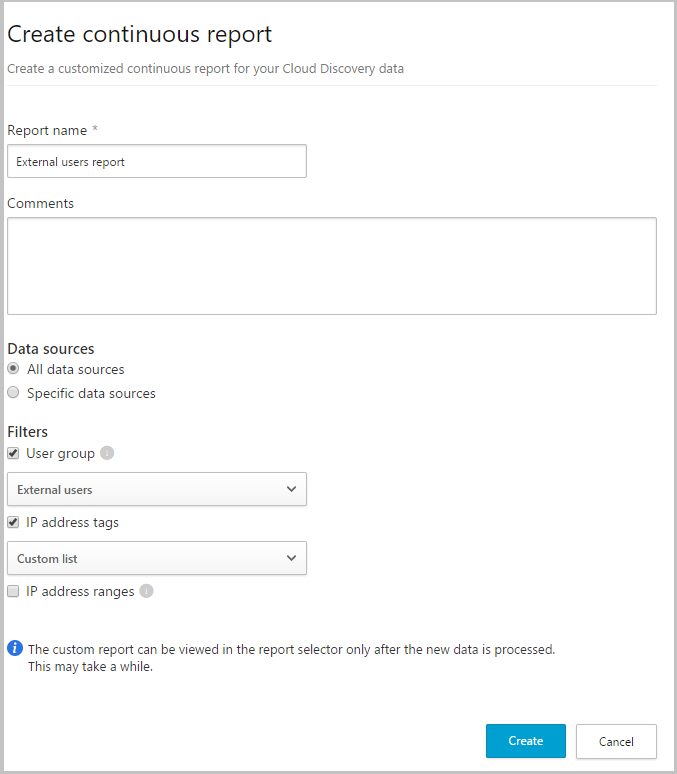
Verify that the logs are being uploaded to Defender for Cloud Apps and that reports are generated. After verification, create custom reports. You can create custom discovery reports based on Microsoft Entra user groups. For example, if you want to see the cloud use of your marketing department, import the marketing group using the import user group feature. Then create a custom report for this group. You can also customize a report based on IP address tag or IP address ranges.
In the Microsoft Defender portal, select Settings > Cloud Apps > Cloud Discovery > Continuous reports.
Select the Create report button and fill in the fields.
Under the Filters you can filter the data by data source, by imported user group, or by IP address tags and ranges.
Note
When applying filters on continuous reports, the selection will be included, not excluded. For example, if you apply a filter on a certain user group, only that user group will be included in the report.
Next steps
If you run into any problems, we're here to help. To get assistance or support for your product issue, please open a support ticket.