Overview of data model customization
Data model customization helps you customize the out-of-the-box standard reports and add your own KPIs (key performance indicators) and custom metrics, so that you can use the data that's most relevant to your organization.
As new features are added, metric definitions and calculations continually need to be updated to account for additional workflows that are enabled by new features. Using the out-of-the-box model and creating only those metrics that are unique to your organization reduces the risk of metric definitions becoming outdated.
What is data model customization?
Dynamics 365 Customer Service provides a suite of out-of-the-box analytic dashboards that are built on Power BI. These analytic solutions provide industry standard KPIs and metrics that can help you monitor and improve the performance of your contact center. Power BI solutions deploy two components: a data model (sometimes referred as a dataset) and a report. The data model houses the KPIs, while reports help visualize this data for supervisors.
Every organization that has analytics enabled gets the analytics solution deployed and available only to them. Dynamics 365 leverages the data from Dataverse, performs transformation logic for each of the KPIs, and makes these KPIs available for you within these data model, which also means they can't be edited.
However, the reports that are deployed for your organization can be edited and customized. With visual customization, you can edit the reports to present the available data as per your organizational requirements. For example, Dynamics 365 reads all the required data, performs the logic required to calculate the average handle time, and makes it available for you in the data model. You can choose to edit and present this as a chart or a table as required, and drill down to see the average handle time for a queue or user. Visual customizations also give you the ability to leverage out-of-the-box metrics that aren't directly exposed, create new pivots, and analyze data with additional dimensions.
At times, you might have scenarios where you'd like to modify the data that's available in the dataset or the logic used to calculate the metrics in the dataset. The following section describes scenarios where you might need to modify the available data or the logic used to calculate the metrics in the dataset. These scenarios are typically driven by processes that are unique to your organization.
Scenario-based use cases
Scenario 1: You need to create variants of the default metrics provided in the dataset that are similar but use a different logic. For example, while service-level metrics for 10, 20, 30, 40, 60, and 120 seconds are provided in the Omnichannel real-time reports, you have a team that works on service levels of 150 seconds and wants to see that metric on the reports.
Scenario 2: Your organization calculates a metric that's provided differently by default, but would like to compute it based on your organization's logic. For example, only the time spent by the primary agent (active agent who owns and is assigned to the conversation) is considered when calculating average handle time. For more information on metrics, go to: Use Omnichannel for Customer Service metrics. Time spent by SMEs consulting is offered as a separate metric. Your organization wants to include this time in the handle time.
Scenario 3: Your organization has customized attributes on the out-of-the-box Dynamics 365 entities, or has custom entities to support your workflows and process and would like to include those attributes, or has metrics built on those attributes in the reports. In addition, your organization wants to report on out-of-the-box attributes that aren't included by default in the reports or the dataset. For example, your organization has a customized user entity to include a region attribute and would like to get a drill-down of the resolution time by region.
Scenario 4: Your organization wants to build a custom dashboard that brings data from multiple applications that your organization uses. For example, you might have an existing Power BI dashboard that brings operational data from your workforce management systems, and you'd like to show Dynamics 365 data, like agent presence, on this dashboard.
How data model customization helps you
Data model customization helps you with scenarios and more. Data model customization deploys a copy of the dataset used by out-of-the-box reports into your organization’s Power BI workspace, allowing you to build composite models.
For the historical data model, the dataset connects to the Azure Data Lake that hosts the transformed historical Dynamics 365 data and exposes the metrics. For a real-time data model, the dataset uses TDS connectors to connect directly to your Dynamics 365 database and executes the logic required to compute the real-time metrics.
By creating a local model within your workspace that connects to the Dynamics 365 data model, you can create new metrics while retaining all the out-of-the-box metrics, thus saving time and effort. You can add the Dynamics 365 data model to existing reports without having to rebuild them.
By leveraging the model and not recreating metrics that are available in out-of-the-box model, you also ensure that the logic used to calculate these metrics always stay updated.
How data model customization works
Data model customization requires your organization to have a paid Power BI service, and uses two workspaces within your Power BI service.
Managed workspace
This workspace is provisioned and maintained by Dynamics 365 Customer Service. The Dynamics 365 datasets are deployed into this workspace.
For real-time data model configuration, a workspace named Omnichannel Managed Workspace_(GUID) is created. The real-time data model is hosted within this workspace. It uses TDS connector to extract data from Dynamics 365 continually and to calculate real-time metrics.
For historical data model configuration, a workspace named Customer Service Managed Workspace__(GUID) is created. The historical data model is hosted in this workspace. This data model is refreshed daily with the latest data from the Azure Data Lake. Historical data from the last two years is processed daily and transformed into KPI stored in the data lake.
Note
This single data model supports both case and conversation analytics. Knowledge analytics and unified routing analytics aren't available for customization.
Each time the out-of-the-box data model is updated because of newer release versions, the data model deployed to the managed workspace is also updated to ensure that your organization gets the latest updates, which includes newer metrics, updates to logic of existing metrics, and bug fixes.
Note
We recommend treating the dataset in the managed workspace as read-only. We recommend that you don't make changes to this dataset, as it might lead to report malfunction. Any changes made to the data model in the managed workspace will be overwritten whenever a newer version is released.
Customer workspace
A copy of the out-of-the-box reports are created in this workspace. During the configuration, you can either create a new workspace or can specify an existing workspace.
Depending on the features you've enabled, you may see up to three different reports created in the workspace you selected for historical data model customization and one report in the real-time data model customization.
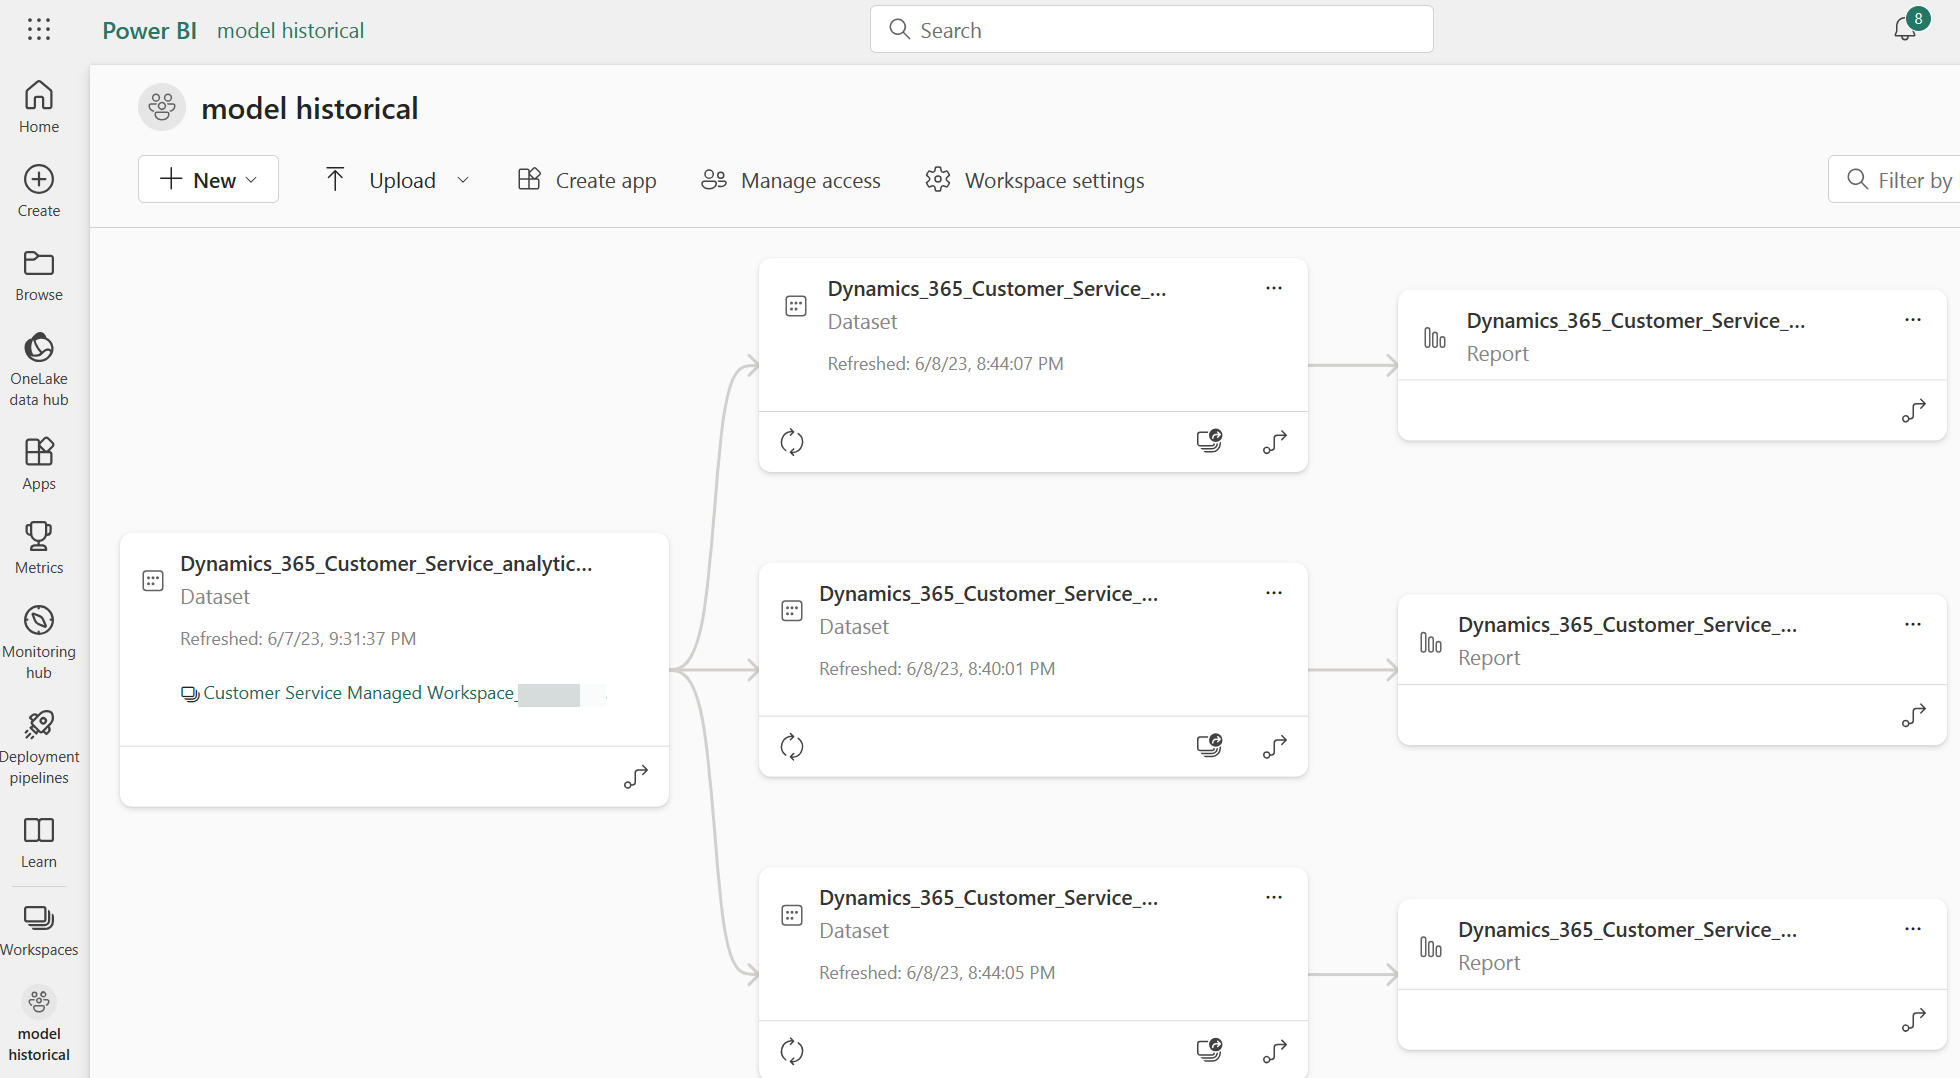
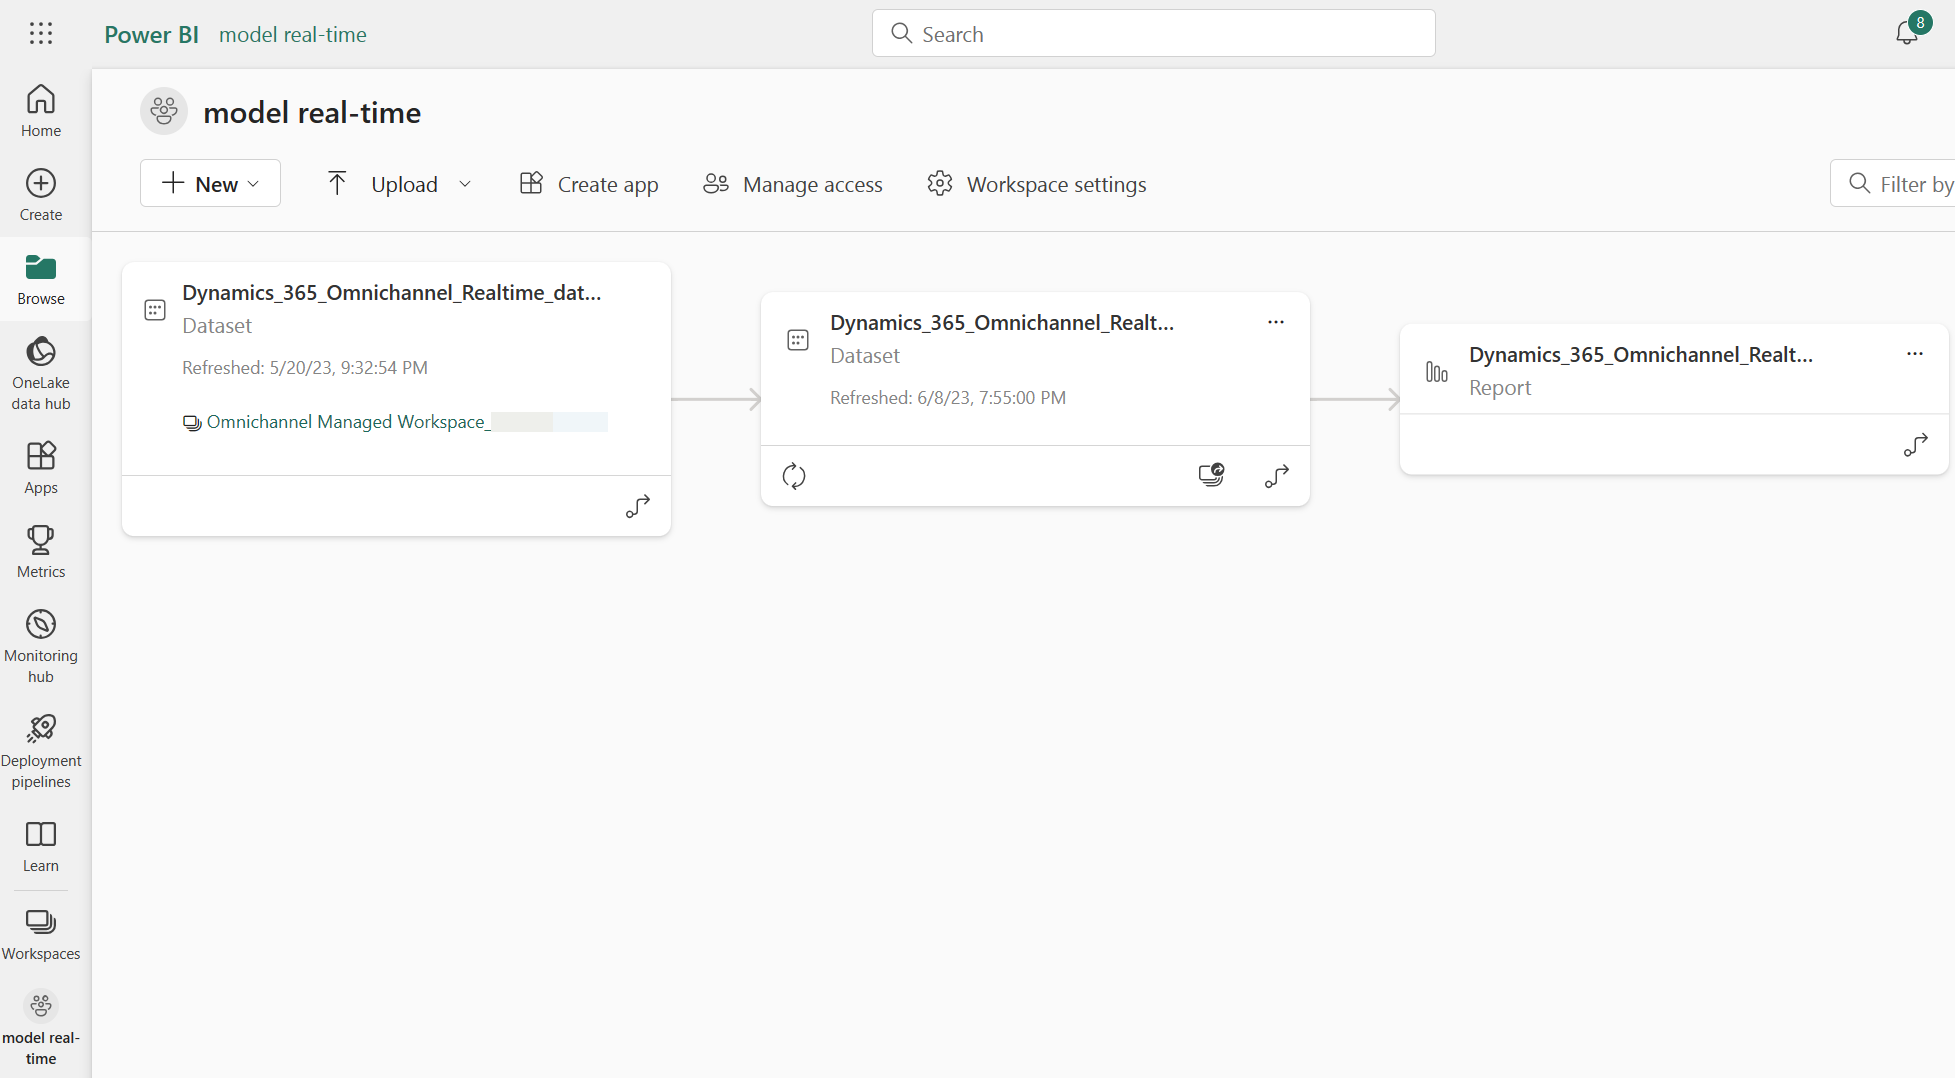
Each report is connected to its own composite dataset, which in turn connects to the data model in the managed workspace.
These report copies can be edited and updated to suit your needs, and are provided as a base for you to build on instead of having to build entire reports from scratch. These reports are created only when the feature is configured, and are never updated. These reports won't be overwritten when out-of-the-box reports are updated.
You can choose to specify the same workspace for both historical and real-time analytics.
Note
Supervisor actions like assign, transfer, monitor, and force close aren't available for model customized reports.
See also
Dataverse entities used in historical and real-time analytics
Customize data models of historical and real-time analytics reports
Customize visual display
Feedback
Coming soon: Throughout 2024 we will be phasing out GitHub Issues as the feedback mechanism for content and replacing it with a new feedback system. For more information see: https://aka.ms/ContentUserFeedback.
Submit and view feedback for