Note
Access to this page requires authorization. You can try signing in or changing directories.
Access to this page requires authorization. You can try changing directories.
Note
Community interest groups have now moved from Yammer to Microsoft Viva Engage. To join a Viva Engage community and take part in the latest discussions, fill out the Request access to Finance and Operations Viva Engage Community form and choose the community you want to join.
This article points you to resources that you can use to learn more about the business intelligence (BI) and reporting tools that are available.
Get started
- Information access and reporting
- Tech Talk: Reporting options (video)
- finance and operations: Power BI Analytics & Reporting Services blog (blog)
Analytical workspaces
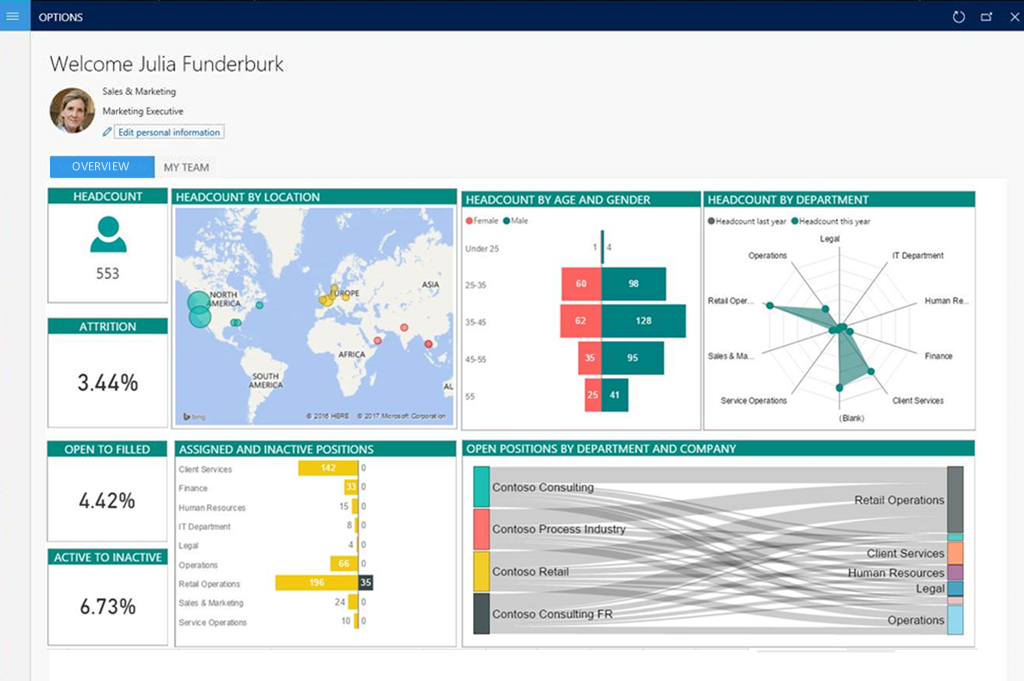
Workspaces can use rich infographics and visuals that Microsoft Power BI supports. These infographics and visuals include many controls that third parties provide. Therefore, workspaces can provide a highly visual, interactive experience for users.
Users can interact with data by clicking or touching visuals on the page. They can see cause and effect, and do simple what-if operations without leaving the workspace. Thanks to stunning, interactive visuals, your users have fun exploring data and discovering hidden trends.
Learn more in the following articles:
- Embedded Power BI in workspaces
- Power BI Embedded integration
- Add analytics to workspaces by using Power BI Embedded
- Help secure analytical workspaces and reports by using Power BI Embedded
- Power BI content home page
Business documents and printing
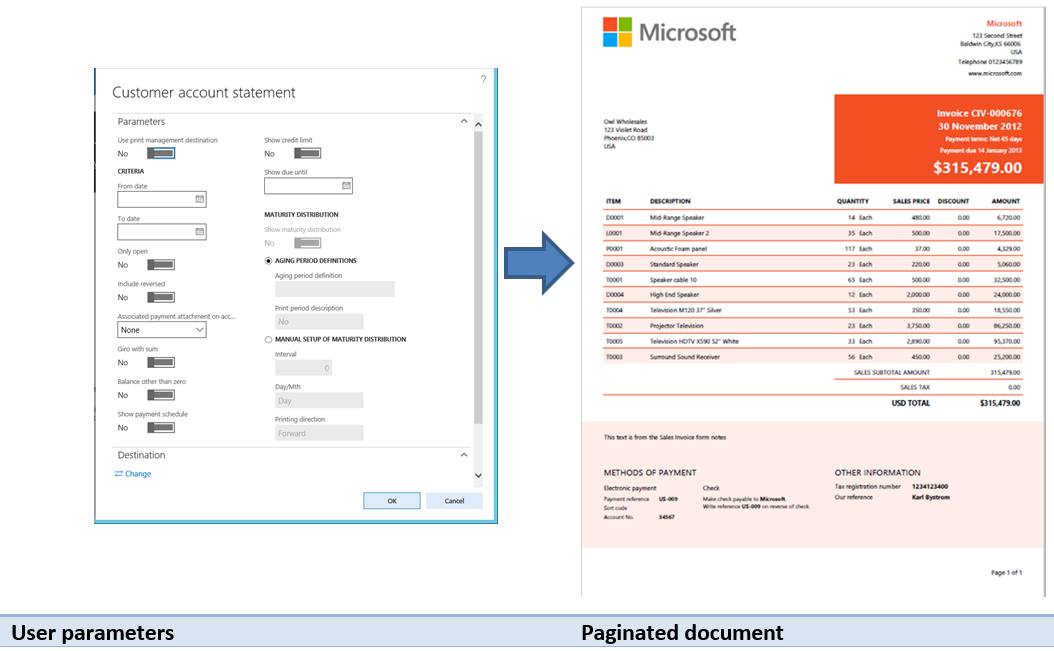
Reporting solutions often capture and communicate the details of business transactions. Therefore, a reporting solution must produce physical manifestations of business data by using existing devices, such as network printers. Examples of business documents include sales invoices, customer statements, and checks.
Learn more in the following articles:
- Document Reporting Services
- Document printing overview
- Install the Document Routing Agent to enable network printing
Electronic reporting
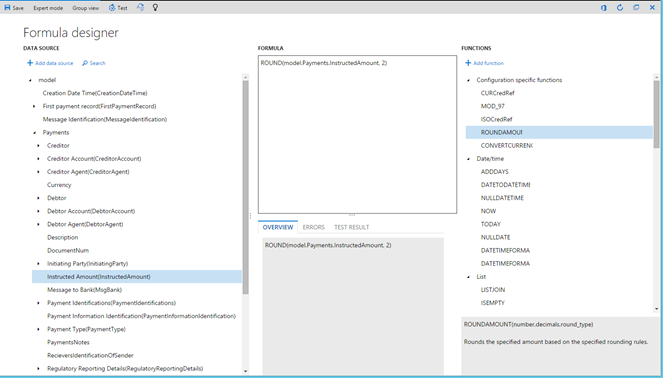
Electronic reporting (ER) is the tool that you use to configure electronic document formats that comply with the legal requirements of various countries or regions. You can use electronic reporting for financial auditing, tax reporting, and electronic invoicing.
Learn more in the following articles:
- Electronic reporting (ER) overview
- Manage the Electronic reporting (ER) configuration lifecycle
- Create Electronic reporting (ER) configurations
Financial reporting
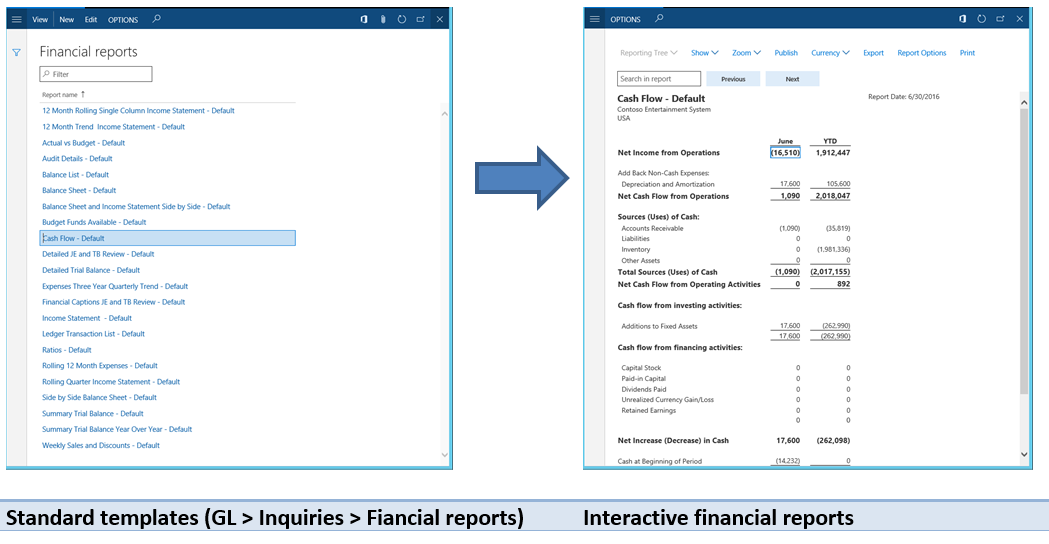
Standard financial reports use the default main account categories. Use the report designer to create or modify traditional financial statements, such as income statements and balance sheets. You can then share the results with other members of your organization. Examples of financial reporting include balance sheets, cash flow, and summary trial balance year over year.
Learn more in the following articles:
Technical reference reports
The following reports provide reference information about the objects: