Note
Access to this page requires authorization. You can try signing in or changing directories.
Access to this page requires authorization. You can try changing directories.
Sequence insights provide valuable information about how well your sales sequences are performing. You can use them to find where improvements are needed, optimize your sales processes, and identify best practices that are working well across your sales team. Then you can use these successful practices to streamline your processes through common patterns and strategies that contribute to their success.
The sequence insights feature is available in version 9.0.23041.10001 and later of Dynamics 365 sales accelerator. Insights data is provided only for sequences that were created or updated after the feature is rolled out to your organization. To view insights for sequences that were activated before the feature rollout, reactivate the sequences.
Prerequisites
Sequences are configured and implemented in your organization. Learn more about sequences in sales accelerator.
View and understand sequence insights
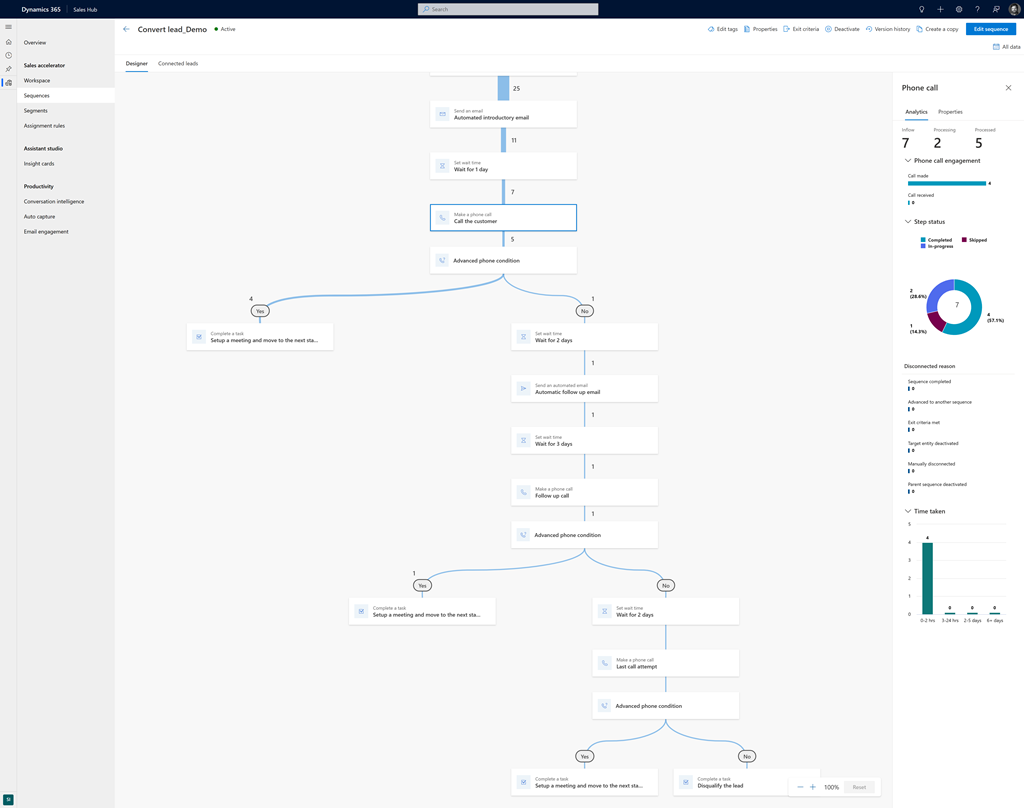
To view sequence insights, open an active sequence. The sequence is shown as a Sankey diagram that illustrates the number of records that passed through each step in the sequence. The diagram offers an easy way to view the sequence's overall performance. It can also help you identify steps where more records are getting stuck or leaving the sequence.
By default, the data covers the entire time the sequence has been active. You can filter it to show a specific duration; for example, the last seven days. Select All data in the upper-right corner of the page, and then select a duration.
To get insights on how sellers are executing a step, select it in the diagram.
The first step displays the following insights for the sequence as a whole:
- The total number of records that have flown into the sequence, including the number of records that are being processed and that have already been processed.
- The maximum number of steps taken to process the sequence and the average number of days it took to complete.
- The reasons the sequence is disconnected from the records. The number listed below each reason indicates how many records were disconnected for that reason. For example, a sequence is disconnected from a record when a seller completes it.
Other steps display a detailed analysis, with the following insights shown for each step:
- The total number of records that have flown into the sequence, including the number of records that are being processed and that have already been processed.
- An analysis of the actions that are performed for the step, which may vary by step. For example, in the phone call step, basic actions that can be performed are making and receiving calls. Each action shows the number of records that performed it.
- The step status, or the number of records that are in progress, completed, or skipped.
- The reasons the sequence is disconnected from the records. The number listed below each reason indicates how many records were disconnected for that reason.
- How long each record took to complete the step.
Analytics aren't available for condition steps.
Related information
Create and connect sequences for yourself
View and understand sales acceleration reporting
Understand the sequence stats page
