Note
Access to this page requires authorization. You can try signing in or changing directories.
Access to this page requires authorization. You can try changing directories.
Overview
Rebuffering is Microsoft eCDN's north-star for gauging the quality of the viewer experience.
Definition
Rebuffering is defined as any amount of time during which a viewer spends buffering with still or no video. It's calculated per individual as a percentage of their full session time: buffer-time / (play-time + buffer-time). The aggregate of all users' rebuffering is averaged and displayed in the analytics dashboards per event, and averaged for the selected time range in the Rebuffering widget.
What is bad rebuffering?
Three percent or higher is considered a poor experience.
| Range | Color-coding | Determination |
|---|---|---|
| > 3% | Red | We consider over three percent to be a poor experience, warranting investigation when a substantial user base is represented. |
| < 3% and > 1% |
Yellow | Can be considered from degraded to concerning. We find that typically the yellow range is only a cause for concern if in the higher end of the range and only when a large or concentrated group is affected. |
| < 1% | Green | Is considered a good experience. We commonly see well below 1% rebuffering across Microsoft eCDN's customer base. |
How to use rebuffering for troubleshooting
Microsoft eCDN provides in-depth experience metrics, such as rebuffering, that can be used to corroborate reports of poor user experience and help determine the scope of affected viewers. It can also be used to highlight weaknesses in the networking environment, particularly when performing load testing with silent testing.
The following are scenarios where rebuffering can be a useful metric.
Ascertaining age of issue
A common first step in troubleshooting is ascertaining the age of an issue. By comparing the event's rebuffering percentage to prior events', one may be able to discern a distinct pattern across a time range. Questions to ask may include...
- Is this rebuffering also observed in prior events or is it non-persistent?
- Is this rebuffering a new happening?
- If so, did something change in the subnet mapping or network configuration since the last event with good rebuffering. If so, what?
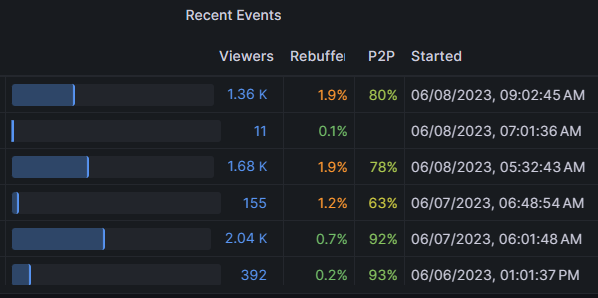
Example of a potential persistent issue
In this screenshot, we observe a plausible consistent issue starting on a specific date with larger events. Aside from event size, it's good practice to observe other possible traits in common, such as ISP or subnet group.
Example of single high rebuffering event
In this screenshot, we observe that the high rebuffering for the largest event is a new issue that wasn't present in prior events. A good question to ask here is whether poor rebuffering was experienced across the viewer base or concentrated somewhere.
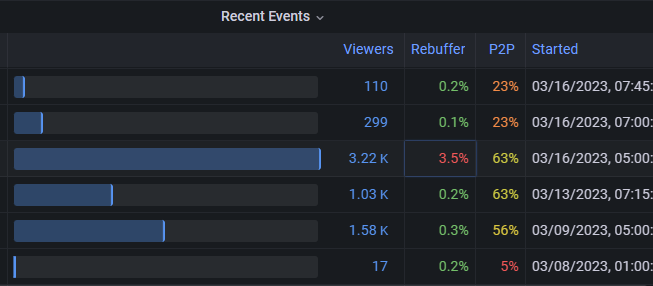
We also observe that subsequent smaller events are okay so it's fair to presume that the cause pertains to a unique trait of the event such as its size, timing, or other property.
Ruling out transient network irregularity
Rebuffering can be due to networking inconsistencies outside of our immediate control such as the ISP or a content delivery network having a momentary lapse service inconsistency. In the Drilldowns dashboard, after filtering for a specific event, then selecting the Group breakdown dimension, we inspect the Rebuffering Timeline graph for any visual patterns across groups.
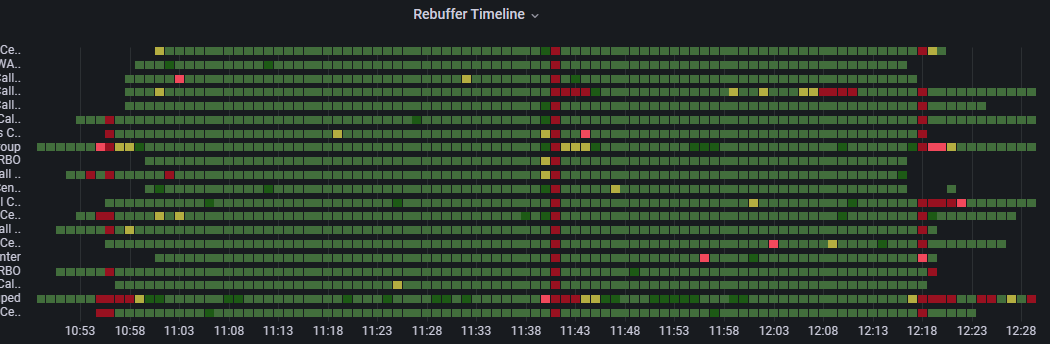
Example of rebuffering across groups
In this screenshot of the Rebuffering Timeline for the Groups dimension, we observe three moments during this 90-minute event where high rebuffering was experienced throughout all of this large organization's groups, at the beginning, at the mid-point, and at the end of the event. This cross-organizational effect is a strong indicator of the source of the issue, which in this case was the organization's Content Delivery Network; a CDN, not to be confused with Microsoft eCDN.
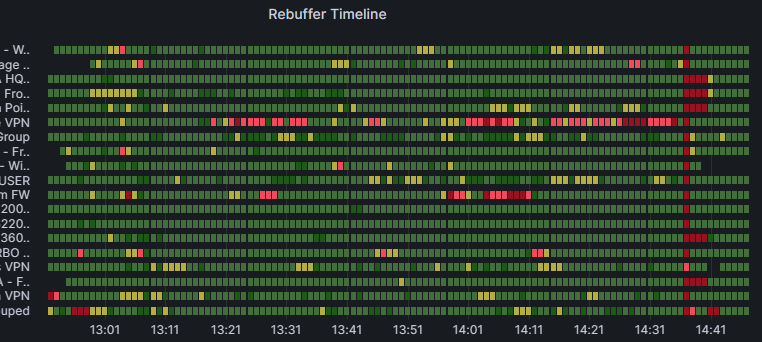
Example of rebuffering in a single group
Similar to the aforementioned timeline screenshot, in this example we also observe an organization-wide rebuffering moment near the end. What's more, we can also observe that one of this organization's VPN groups is experiencing poor rebuffering throughout the event. This could be a clear indicator of a lack of capacity in the org's VPN circuit. If so, this group would be a good test case for investigating the impact of split-tunneling Teams traffic to reduce load.
Identifying a troubled slice
Assuming an overarching cause isn't apparent, move forward in the troubleshooting process of identifying the trouble spot by systematically slicing the data on the various available breakdowns in the Analytics Drilldowns dashboard. Breakdowns dimensions include the following.
- Event
- Group
- Application
- ISP
- Country
- City
- OS
Limitations
Even with subnet mapping uploaded, sometimes the high rebuffering spots can be found in one of the default groups. To troubleshoot poor metrics for these groups, use the automatically populated Breakdown categories such as the following to filter and slice the data.
- Application
- ISP
- Country
- City
In summary
The next time you're experiencing high rebuffering, look for patterns and ask yourself questions such as the following.
- Is high rebuffering occurring company-wide or only at specific sites?
- Is rebuffering higher for specific operating systems, or application used to watch the live event?
- Did rebuffering occur at a specific minute for every user and went away some time later?
- Is there a correlation between an observed rebuffering moment and another potentially impactful event on the network?
Rebuffering is an undesirable byproduct, typically associated with network unreliability. With Microsoft eCDN's dashboards, you can gain more insight into its source to help you resolve it.