Note
Access to this page requires authorization. You can try signing in or changing directories.
Access to this page requires authorization. You can try changing directories.
In this tutorial, you build a lakehouse, ingest sample data into the Delta table, apply transformation where required, and then create reports.
Tip
This tutorial is part of a series. After you complete this tutorial, continue to Ingest data into the lakehouse to build a complete enterprise lakehouse using Data Factory pipelines, Spark notebooks, and advanced reporting techniques.
Here's a checklist of the steps you complete in this tutorial:
If you don't have Microsoft Fabric, sign up for a free trial capacity.
Prerequisites
- Before you create a lakehouse, you must create a Fabric workspace.
- Before you ingest a CSV file, you must have OneDrive configured. If you don't have OneDrive configured, sign up for the Microsoft 365 free trial: Free Trial - Try Microsoft 365 for a month. For setup instructions, see Set up OneDrive.
Why do I need OneDrive for this tutorial?
You need OneDrive for this tutorial because the data ingestion process relies on OneDrive as the underlying storage mechanism for file uploads. When you upload a CSV file to Fabric, it's temporarily stored in your OneDrive account before being ingested into the lakehouse. This integration ensures secure and seamless file transfer within the Microsoft 365 ecosystem.
The ingestion step doesn't work if you don't have OneDrive configured, because Fabric can't access the uploaded file. If you already have the data available in your lakehouse or another supported location, OneDrive isn't required.
Note
If you already have data in your lakehouse, you can use that data instead of the sample CSV file. To check if data is already associated with your lakehouse, use the Lakehouse Explorer or the SQL analytics endpoint to browse tables, files, and folders. For more information about how to check, see Lakehouse overview and Lakehouse SQL analytics endpoint use cases.
Create a lakehouse
In this section, you create a lakehouse in Fabric.
In Fabric, select Workspaces from the navigation bar.
To open your workspace, enter its name in the search box located at the top and select it from the search results.
From the workspace, select New item, enter Lakehouse in the search box, then select Lakehouse.
In the New lakehouse dialog box, enter wwilakehouse in the Name field.

Select Create to create and open the new lakehouse.

Ingest sample data
In this section, you ingest sample customer data into the lakehouse.
Note
If you don't have OneDrive configured, sign up for the Microsoft 365 free trial: Free Trial - Try Microsoft 365 for a month.
Download the dimension_customer.csv file from the Fabric samples repo.
Select your Lakehouse and go to the Home tab.
Select Get data > New Dataflow Gen2 to create a new dataflow. You use this dataflow to ingest the sample data into the lakehouse. Alternatively, under Get data in your lakehouse, you can select the New Dataflow Gen2 tile.

In the New Dataflow Gen2 pane, enter Customer Dimension Data in the Name field and select Create.

On the dataflow Home tab, select the Import from a Text/CSV file tile.
On the Connect to data source screen, select the Upload file radio button.
Browse or drag and drop the dimension_customer.csv file that you downloaded in step 1. After the file is uploaded, select Next.

On the Preview file data page you can preview the data. Then select Create to proceed and return back to the dataflow canvas.


Transform and load data into the lakehouse
In this section, you transform the data based on your business requirements and load it into the lakehouse.
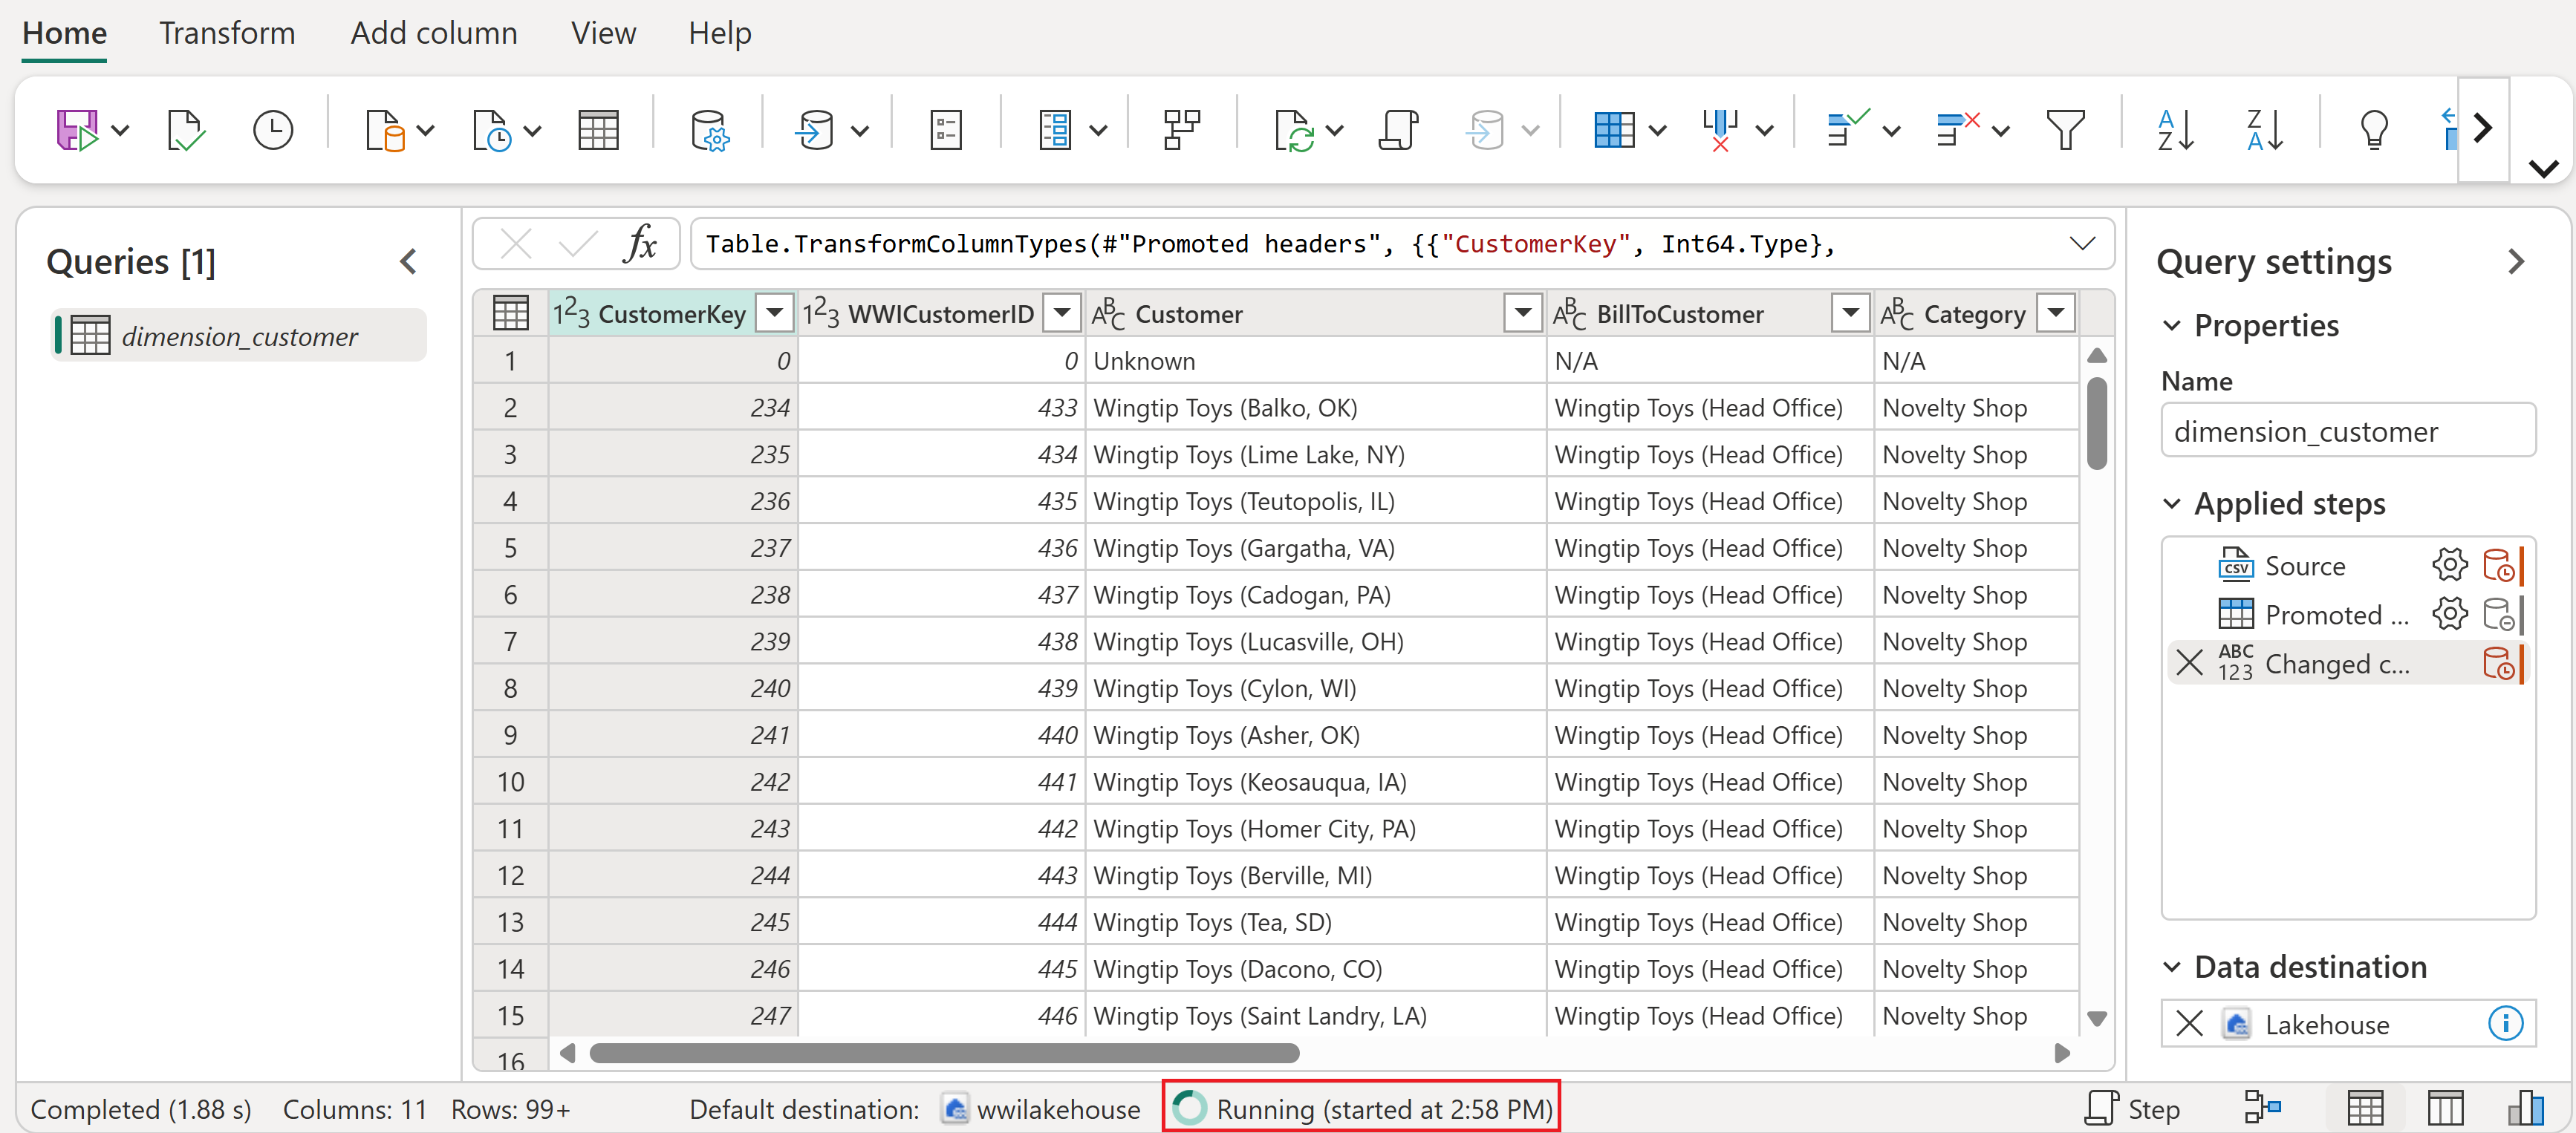
In the Query settings pane, make sure the Name field is set to dimension_customer. This name is used as the table name in the lakehouse, so it must be lowercase and must not contain spaces.

Because you created the dataflow from the lakehouse, the data destination is automatically set to your lakehouse. You can verify this by checking the Data destination in the query settings pane.
Tip
If you create a dataflow from the workspace instead of from a lakehouse, you need to manually add a data destination. For more information, see Dataflow Gen2 default destination and Data destinations and managed settings.
From the dataflow canvas, you can easily transform the data based on your business requirements. For simplicity, we aren't making any changes in this tutorial. To proceed, select Save and Run in the tool bar.

Wait for the dataflow to finish running. While it's in progress, you see a spinning status indicator.
After the dataflow run completes successfully, select your lakehouse in the top menu bar to open it.
In the lakehouse explorer, find the dbo schema under Tables, select the ... (ellipsis) menu next to it, and then select Refresh. This runs the dataflow and loads the data from the source file into the lakehouse table.

Once the refresh is complete, expand the dbo schema to view the dimension_customer Delta table. Select the table to preview its data.
You can use the SQL analytics endpoint of the lakehouse to query the data with SQL statements. Select SQL analytics endpoint from the dropdown menu at the top right of the screen.

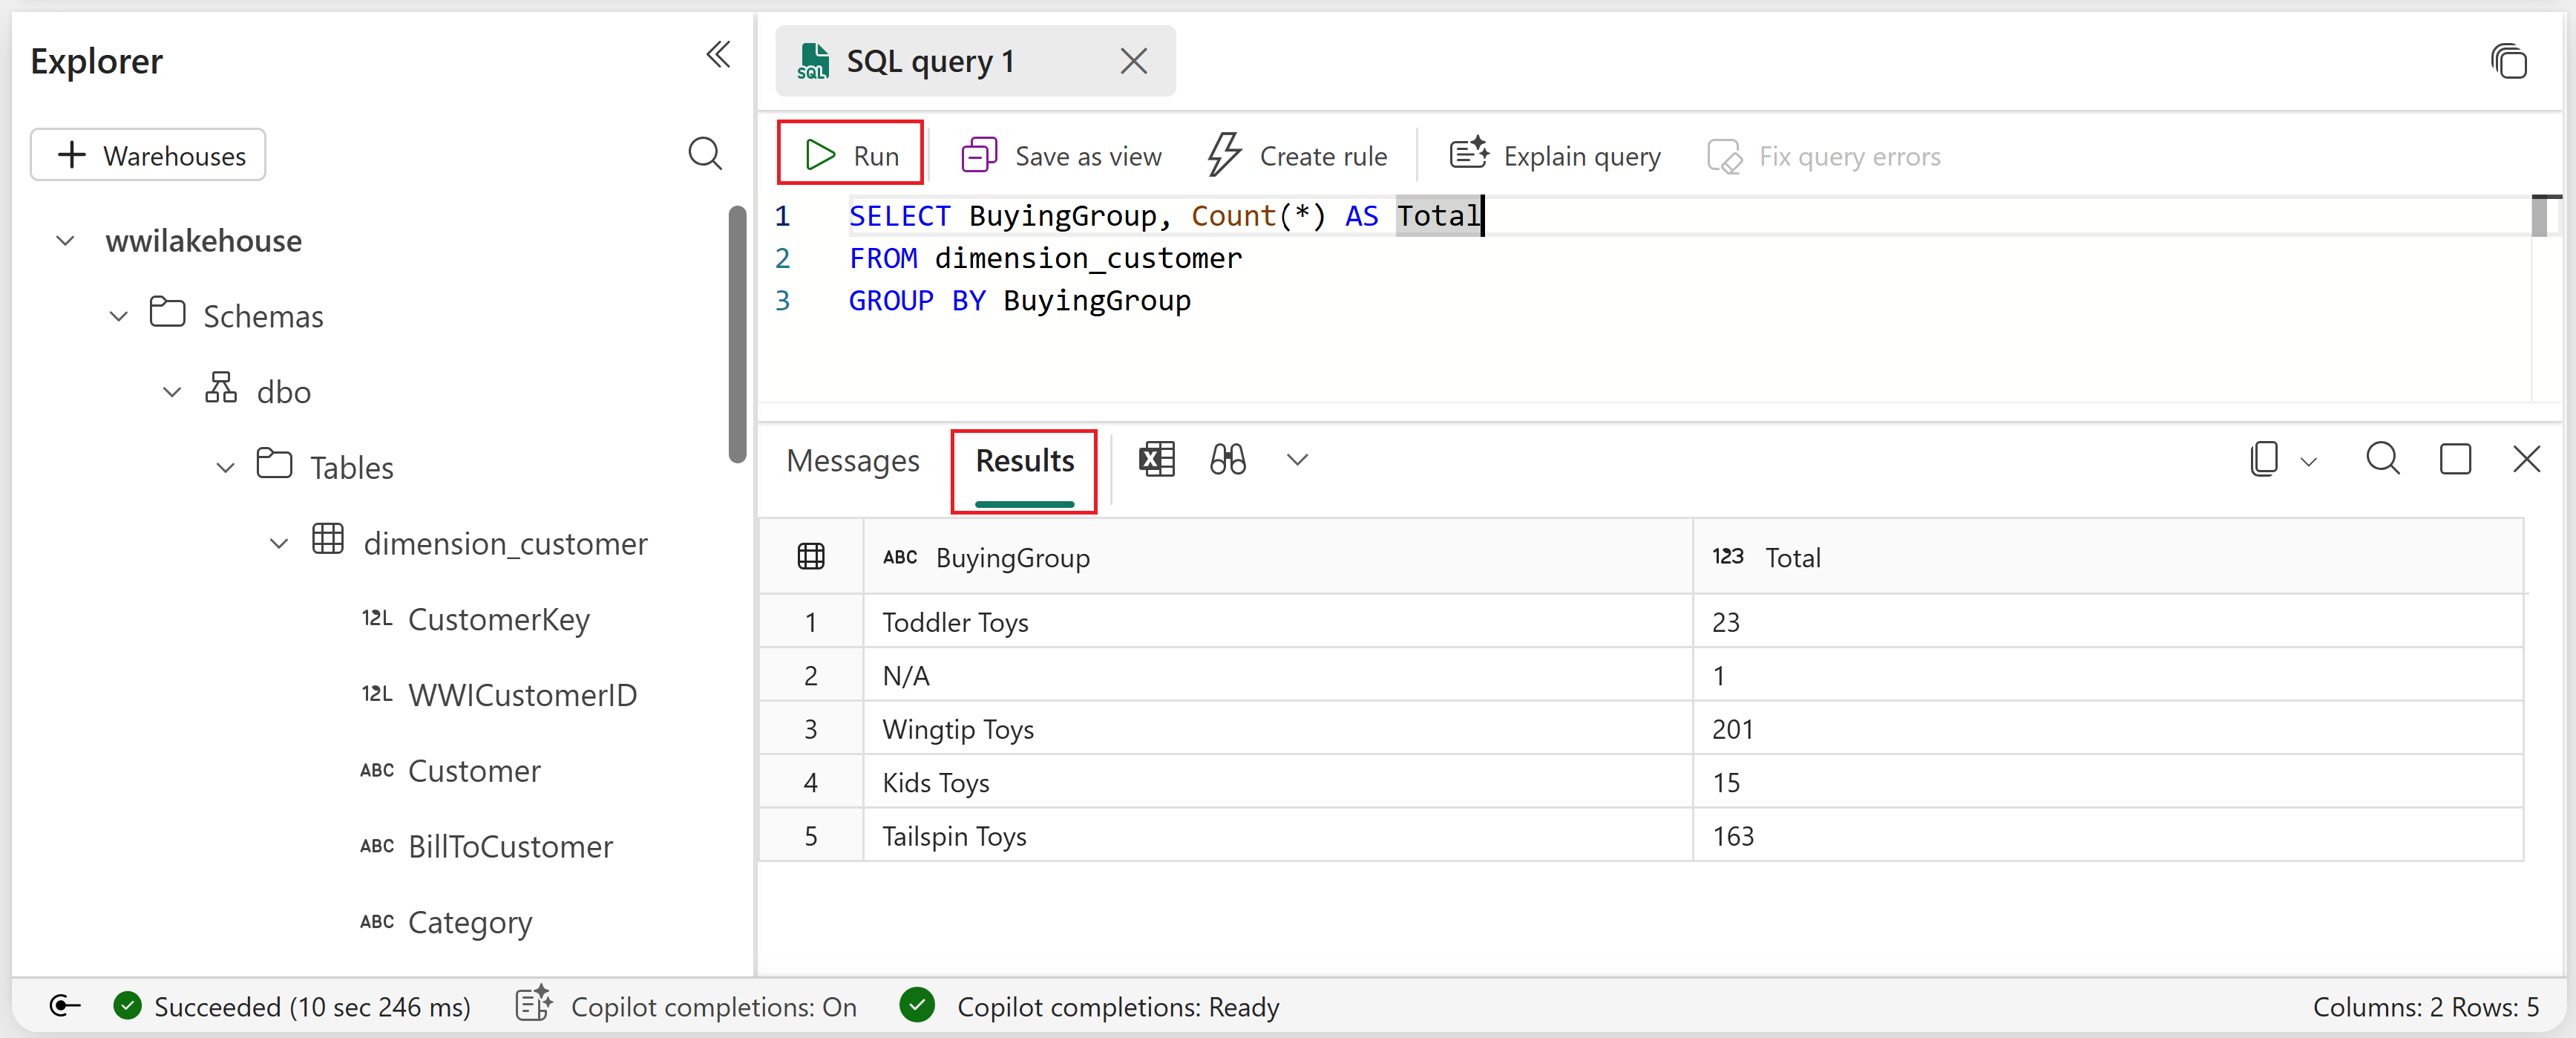
Select the dimension_customer table to preview its data. To write SQL statements, select New SQL Query from the menu or select the New SQL Query tile.

Enter the following sample query that aggregates the row count based on the BuyingGroup column of the dimension_customer table.
SELECT BuyingGroup, Count(*) AS Total
FROM dimension_customer
GROUP BY BuyingGroup
Note
SQL query files are saved automatically for future reference, and you can rename or delete these files based on your need.
To run the script, select the Run icon at the top of the script file.


Add tables to the semantic model
In this section, you add the tables to the semantic model so that you can use them to create reports.
Open your lakehouse and switch to the SQL analytics endpoint view.
Select New semantic model.
In the New semantic model pane, enter a name for the semantic model, assign a workspace, and select the tables that you want to add. In this case, select the dimension_customer table.

Select Confirm to create the semantic model.
Warning
If you receive an error message stating "We couldn't add or remove tables" due to your organization's Fabric compute capacity exceeding its limits, wait a few minutes and try again. For more information, see Fabric capacity documentation.
The semantic model is created in Direct Lake storage mode, which means it reads data directly from the Delta tables in OneLake for fast query performance without needing to import the data. After creation, you can edit the semantic model to add relationships, measures, and more.
Tip
To learn more about Direct Lake and its benefits, see Direct Lake overview.

Build a report
In this section, you build a report from the semantic model you created.
In your workspace, find the semantic model you created, select the ... (ellipsis) menu, and then select Auto-create report.

The table is a dimension and there are no measures in it. Power BI creates a measure for the row count, aggregates it across different columns, and creates different charts as shown in the following screenshot.

You can save this report for the future by selecting Save from the top ribbon. You can make more changes to this report to meet your requirements by including or excluding other tables or columns.

