Data science end-to-end scenario: introduction and architecture
This set of tutorials demonstrates a sample end-to-end scenario in the Fabric data science experience. You implement each step from data ingestion, cleansing, and preparation, to training machine learning models and generating insights, and then consume those insights using visualization tools like Power BI.
If you're new to Microsoft Fabric, see What is Microsoft Fabric?.
Introduction
The lifecycle of a Data science project typically includes (often, iteratively) the following steps:
- Business understanding
- Data acquisition
- Data exploration, cleansing, preparation, and visualization
- Model training and experiment tracking
- Model scoring and generating insights.
The goals and success criteria of each stage depend on collaboration, data sharing and documentation. The Fabric data science experience consists of multiple native-built features that enable collaboration, data acquisition, sharing, and consumption in a seamless way.
In these tutorials, you take the role of a data scientist who has been given the task to explore, clean, and transform a dataset containing the churn status of 10,000 customers at a bank. You then build a machine learning model to predict which bank customers are likely to leave.
You'll learn to perform the following activities:
- Use the Fabric notebooks for data science scenarios.
- Ingest data into a Fabric lakehouse using Apache Spark.
- Load existing data from the lakehouse delta tables.
- Clean and transform data using Apache Spark and Python based tools.
- Create experiments and runs to train different machine learning models.
- Register and track trained models using MLflow and the Fabric UI.
- Run scoring at scale and save predictions and inference results to the lakehouse.
- Visualize predictions in Power BI using DirectLake.
Architecture
In this tutorial series, we showcase a simplified end-to-end data science scenario that involves:
- Ingesting data from an external data source.
- Explore and clean data.
- Train and register machine learning models.
- Perform batch scoring and save predictions.
- Visualize prediction results in Power BI.
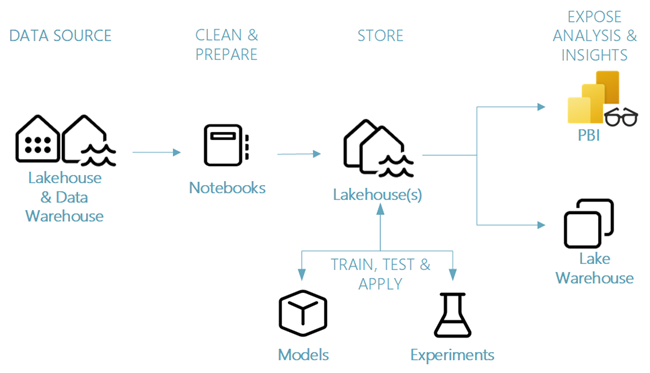
Different components of the data science scenario
Data sources - Fabric makes it easy and quick to connect to Azure Data Services, other cloud platforms, and on-premises data sources to ingest data from. Using Fabric Notebooks you can ingest data from the built-in Lakehouse, Data Warehouse, semantic models, and various Apache Spark and Python supported custom data sources. This tutorial series focuses on ingesting and loading data from a lakehouse.
Explore, clean, and prepare - The data science experience on Fabric supports data cleansing, transformation, exploration, and featurization by using built-in experiences on Spark as well as Python based tools like Data Wrangler and SemPy Library. This tutorial will showcase data exploration using Python library seaborn and data cleansing and preparation using Apache Spark.
Models and experiments - Fabric enables you to train, evaluate, and score machine learning models by using built-in experiment and model items with seamless integration with MLflow for experiment tracking and model registration/deployment. Fabric also features capabilities for model prediction at scale (PREDICT) to gain and share business insights.
Storage - Fabric standardizes on Delta Lake, which means all the engines of Fabric can interact with the same dataset stored in a lakehouse. This storage layer allows you to store both structured and unstructured data that support both file-based storage and tabular format. The datasets and files stored can be easily accessed via all Fabric experience items like notebooks and pipelines.
Expose analysis and insights - Data from a lakehouse can be consumed by Power BI, industry leading business intelligence tool, for reporting and visualization. Data persisted in the lakehouse can also be visualized in notebooks using Spark or Python native visualization libraries like matplotlib, seaborn, plotly, and more. Data can also be visualized using the SemPy library that supports built-in rich, task-specific visualizations for the semantic data model, for dependencies and their violations, and for classification and regression use cases.
Next step
Feedback
Coming soon: Throughout 2024 we will be phasing out GitHub Issues as the feedback mechanism for content and replacing it with a new feedback system. For more information see: https://aka.ms/ContentUserFeedback.
Submit and view feedback for
