Note
Access to this page requires authorization. You can try signing in or changing directories.
Access to this page requires authorization. You can try changing directories.
Applies to: ✅ SQL analytics endpoint and Warehouse in Microsoft Fabric
In this tutorial, learn how to generate a report from the OneLake catalog with the data ingested into the warehouse.
Note
This tutorial forms part of an end-to-end scenario. In order to complete this tutorial, you must first complete these tutorials:
Generate a report
In this task, learn how to generate a report from the OneLake catalog.
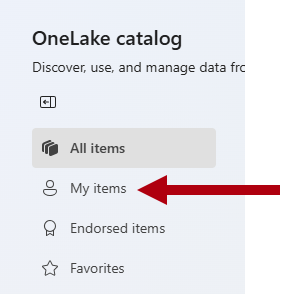
In the Fabric portal, in the navigation pane, select OneLake.
In the OneLake catalog landing page, to limit the list of items to your data, select the My items filter option.
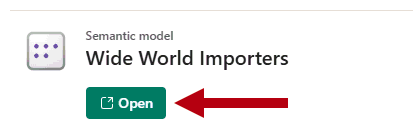
From the item list, select the item named
Sales Modelthat is of type Semantic model.Note
A semantic model can present a star schema model of the warehouse tables, which provides you with a quick way to report on warehouse data.
To open the semantic model landing page, select Open.
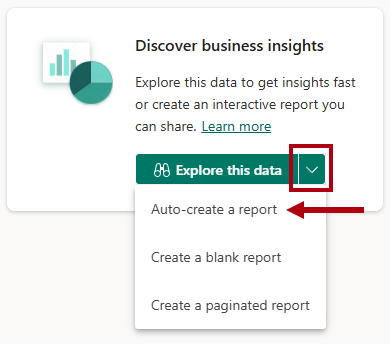
In the semantic model landing page, in the Discover business insights section, open the dropdown list, and then select Auto-create a report.
Review the report that Fabric generated for you.
On the ribbon, select File > Save.
In the Save your report window, in the Enter a name for your report box, enter
Customer Quick Summary.Select Save.