Note
Access to this page requires authorization. You can try signing in or changing directories.
Access to this page requires authorization. You can try changing directories.
Applies to: ✅ SQL analytics endpoint and Warehouse in Microsoft Fabric
This tutorial is a step-by-step walkthrough of an end-to-end data warehousing scenario, from data acquisition to data consumption. Complete this tutorial to build a basic understanding of the Microsoft Fabric user experience, the various experiences and their integration points, and the Microsoft Fabric professional and citizen developer experiences.
While many concepts in Microsoft Fabric might be familiar to data and analytics professionals, it can be challenging to apply those concepts in a new environment. The tutorials aren't intended to be a reference architecture, an exhaustive list of features and functionality, or a recommendation of specific best practices.
Data warehouse end-to-end scenario
Before you start this tutorial, follow these steps:
- Sign in to your Power BI online account, or if you don't have an account, sign up for a free trial.
- Enable Microsoft Fabric in your tenant.
In this tutorial, you take on the role of a Warehouse developer at the fictional Wide World Importers company. You'll implement an end-to-end data warehouse solution:
- Create a workspace.
- Create a Warehouse.
- Ingest data from the source to the data warehouse dimensional model with a pipeline.
- Clone a table with T-SQL with the SQL query editor.
- Transform data with a stored procedure to create aggregated datasets.
- Time travel with T-SQL to see data as it appeared at a point in time.
- Create a query with the visual query editor to retrieve results from the data warehouse.
- Analyze data in a notebook.
- Create and execute a cross-warehouse query with SQL query editor.
- Create a DirectLake semantic model and Power BI report to analyze the data in place.
- Generate a report from the OneLake catalog.
- Clean up tutorial resources by deleting the workspace and other items.
Data warehouse end-to-end architecture
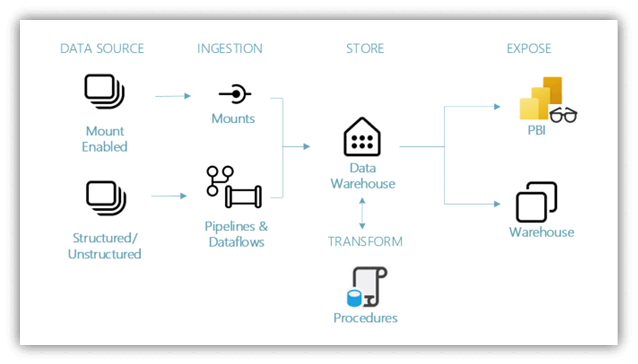
Data sources - Microsoft Fabric makes it easy and quick to connect to Azure Data Services, other cloud platforms, and on-premises data sources.
Ingestion - With 200+ native connectors as part of the Microsoft Fabric pipeline and with drag and drop data transformation with dataflow, you can quickly build insights for your organization. Shortcut is a new feature in Microsoft Fabric that provides a way to connect to existing data without having to copy or move it. You can find more details about the Shortcut feature later in this tutorial.
Transform and store - Microsoft Fabric standardizes on Delta Lake format, which means all the engines of Microsoft Fabric can read and work on the same data stored in OneLake - no need for data duplicity. This storage allows you to build a data warehouse or data mesh based on your organizational need. For transformation, you can choose either low-code or no-code experience with pipelines/dataflows or use T-SQL for a code first experience.
Consume - Use Power BI, the industry-leading business intelligence tool, to report and visualize data from the warehouse. Each warehouse has a built-in TDS endpoint for connecting to and querying data from other reporting tools when needed. In this tutorial, you create a semantic model on your sample warehouse to start visualizing data in a star schema in just a few steps.
Sample data
For sample data, we use the Wide World Importers (WWI) sample database. For our data warehouse end-to-end scenario, we have generated sufficient data for a sneak peek into the scale and performance capabilities of the Microsoft Fabric platform.
Wide World Importers (WWI) is a wholesale novelty goods importer and distributor based in the San Francisco Bay area. WWI's customers are mostly companies that resell to individuals. WWI also sells to retail customers across the United States, like specialty stores, supermarkets, computing stores, tourist attraction shops, and some individuals. WWI sells to other wholesalers through a network of agents who promote the products for WWI. To learn more about the company profile and operations, see Wide World Importers sample databases for Microsoft SQL.
Typically, you would bring data from transactional systems (or line of business applications) into a data lake or data warehouse staging area. However, for this tutorial, we use the dimensional model provided by WWI as our initial data source. We use it as the source to ingest the data into a data warehouse and transform it through T-SQL.
Data model
The WWI dimensional model has multiple fact tables in a star schema. In this tutorial, you focus on the fact_sale table and its related dimensions to demonstrate an end-to-end data warehouse scenario:
