Note
Access to this page requires authorization. You can try signing in or changing directories.
Access to this page requires authorization. You can try changing directories.
This article is an outline of the features of the Console.
Contents:
Open the Console
You can open the Console tool either in the Activity Bar or in the Quick View toolbar.
Open the Console tool in the Activity Bar
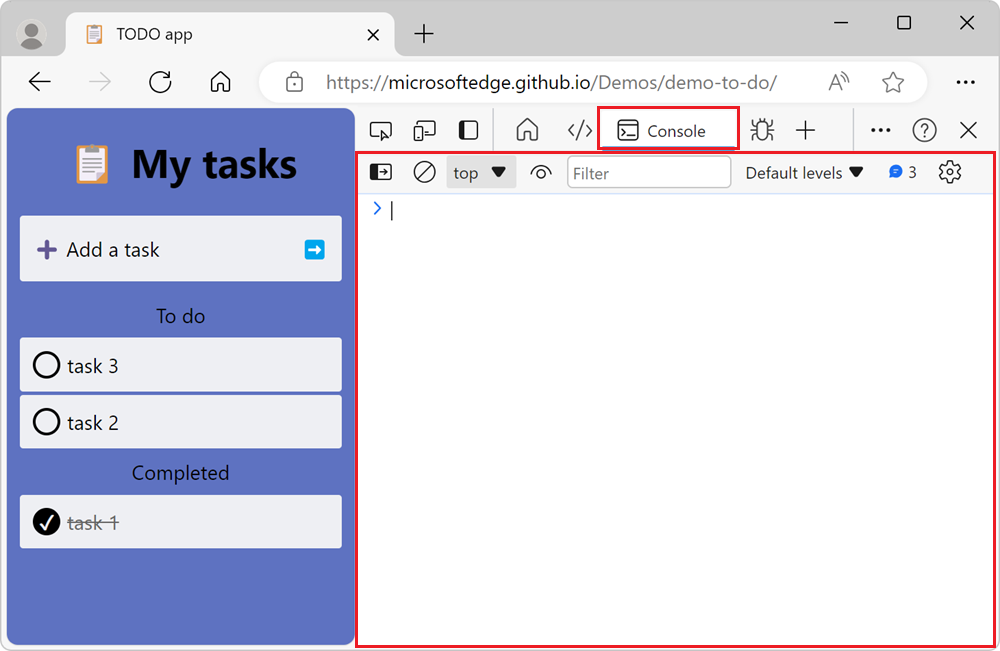
Press Ctrl+Shift+J (Windows, Linux) or Command+Option+J (macOS). DevTools opens, with the tab for the Console tool selected in the Activity Bar:
Open the Console tool in the Quick View toolbar
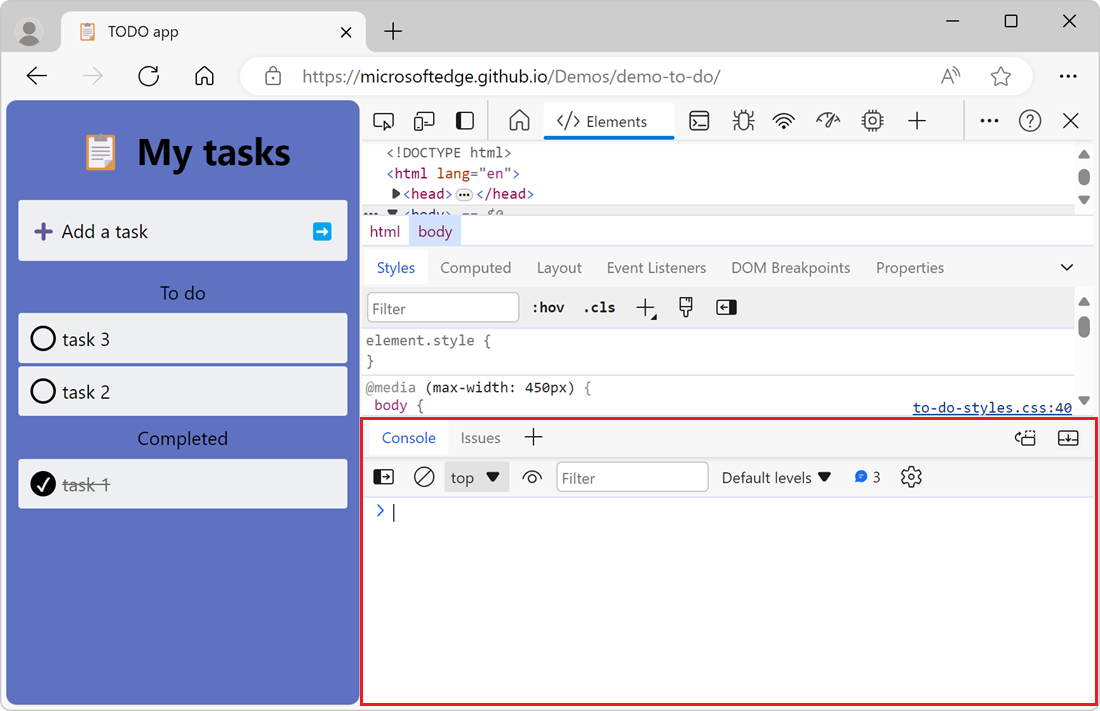
To open the Console tool in the Quick View toolbar, at the bottom of the DevTools window, press Esc. If the Quick View toolbar was previously hidden, it appears:
Or, click Customize and control DevTools (...) > Toggle Quick View panel.
Open the Console from the Command Menu
To open the Console tool from the Command Menu:
Press Ctrl+Shift+P (Windows, Linux) or Command+Shift+P (macOS).
The Command Menu initially opens with a
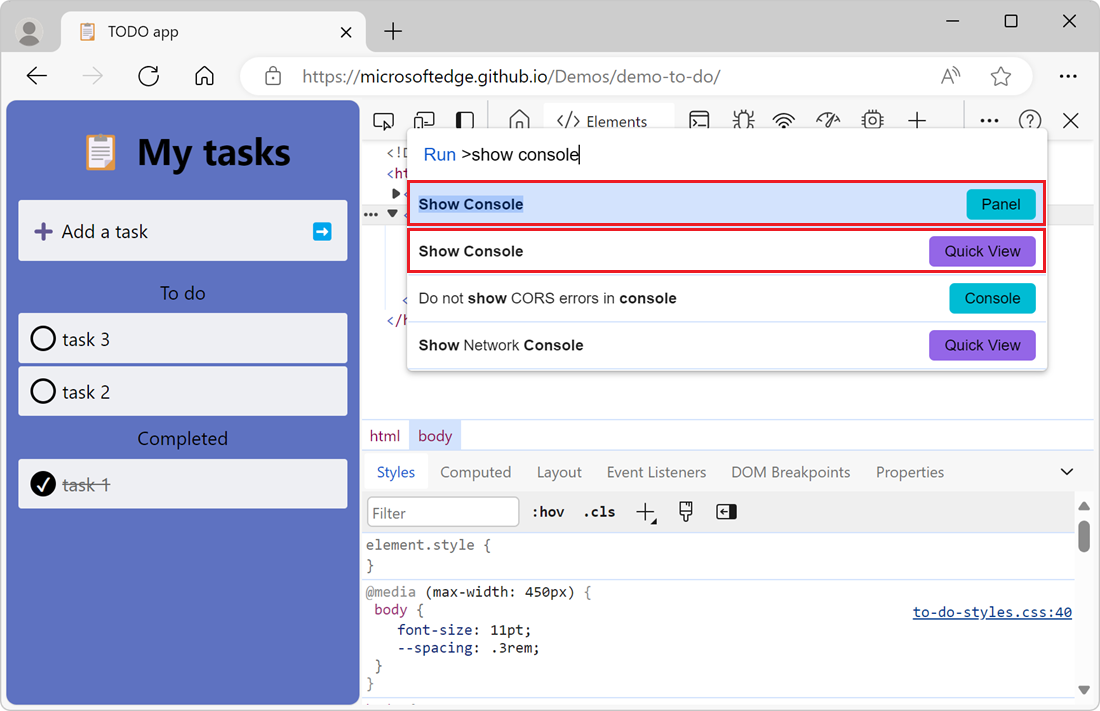
>character prepended to its text box.Type Show Console and then select either of the Show Console options:
- To open the Console in the Activity Bar, select the option with the Panel badge next to it.
- To open the Console in the Quick View toolbar, select the option with the Quick View badge next to it.
To learn more about the Command Menu, see Run commands in the Command Menu.
Open Console settings
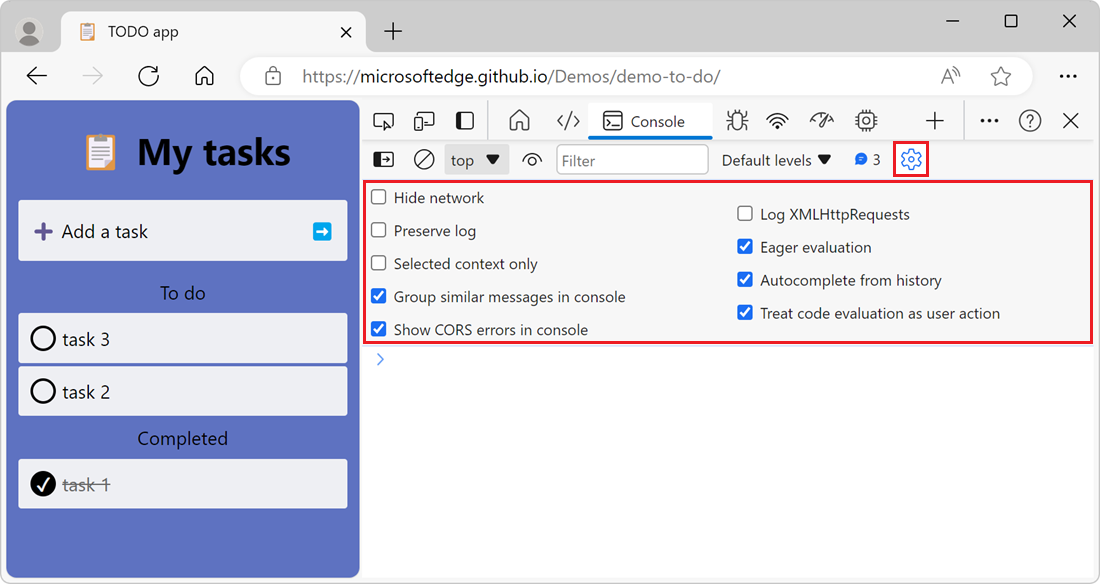
To change settings of the Console tool, click the Console settings (![]() ) button. The settings section appears:
) button. The settings section appears:
Open the sidebar to filter messages
To display the sidebar in the Console, to filter messages, click Show console sidebar (![]() ). The sidebar appears:
). The sidebar appears:
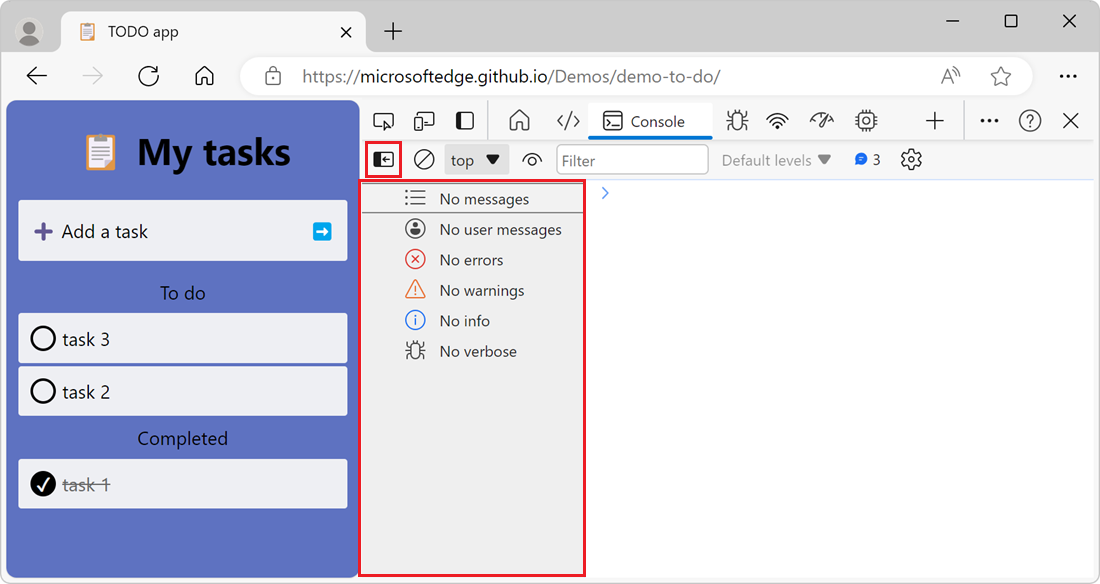
To learn more about filtering messages in the Console tool, see Filter messages.
View messages
This following sections describe features that change how messages are presented in the Console tool. For a hands-on walkthrough, see Inspect and filter information on the current webpage in Console overview.
Turn off message grouping
By default, the Console groups similar messages together. For example, if multiple subsequent messages are logged, only one message is displayed in the Console. The message includes a count of how many times the message was logged, and you can expand the message to see all the instances.
To turn off the default message grouping behavior of the Console, click the Console settings (![]() ) button and then select the Group similar messages in console checkbox.
) button and then select the Group similar messages in console checkbox.
Log XHR and Fetch requests
To log all the network requests that are triggered by the XMLHttpRequest and Fetch JavaScript APIs:
Open the demo webpage Inspect Network Activity Demo in a new window or tab.
In the Console tool, click the Console Settings (
 ) button, and then elect the Log XMLHttpRequests checkbox.
In the rendered webpage, click the Get Data button. This triggers a
FetchAPI request, and the Console then logs the request and response details: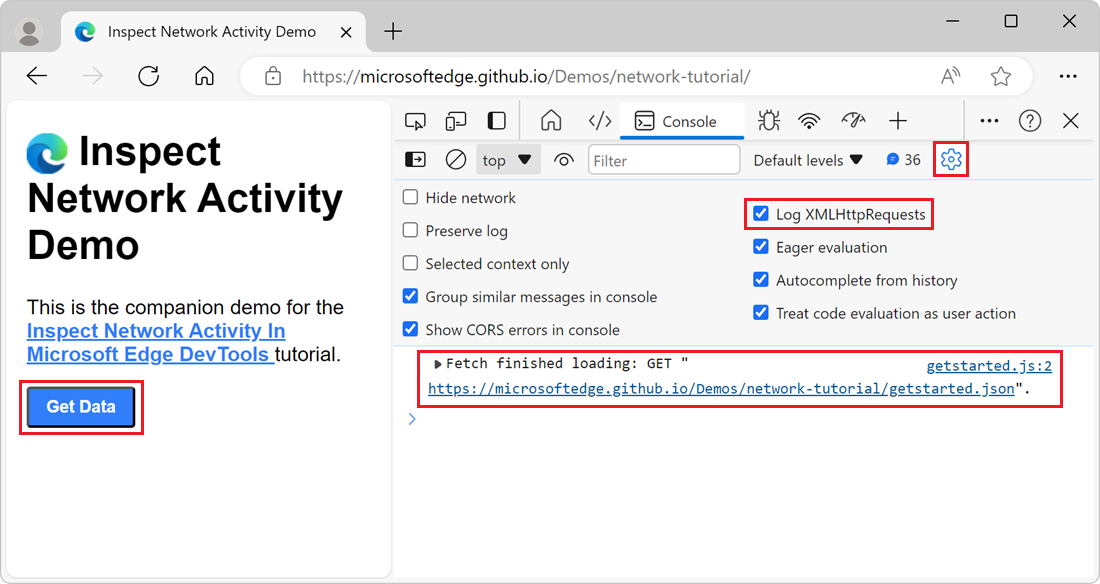
Persist messages across page loads
When you load a new webpage, the messages in the Console are cleared. To persist messages across page loads, click the Console Settings (![]() ) button and then select the Preserve log checkbox.
) button and then select the Preserve log checkbox.
Hide network errors
By default, the Console tool logs network errors:
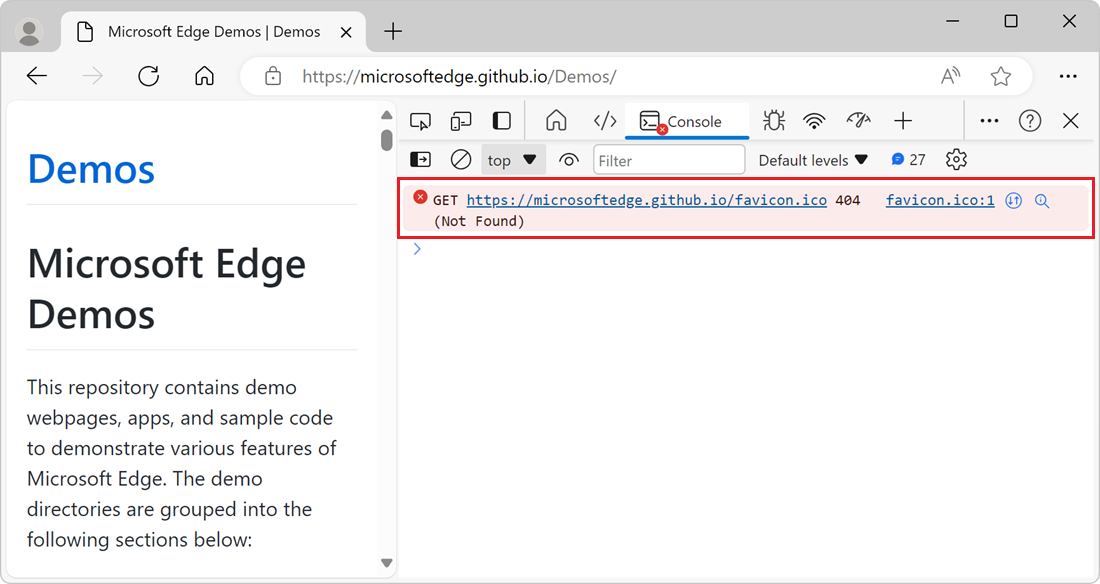
The error shown above is due to an HTTP response with the status code of 404.
To hide network errors, click the Console Settings (![]() ) button, and then select the Hide network checkbox.
) button, and then select the Hide network checkbox.
Explain Console errors and warnings using Copilot in Edge
When inspecting a webpage with DevTools, you often see errors and warnings in the Console tool. These errors and warnings can sometimes be difficult to understand and fix. By using the Explain this error feature, you get more information about the error or warning in Copilot in Edge:
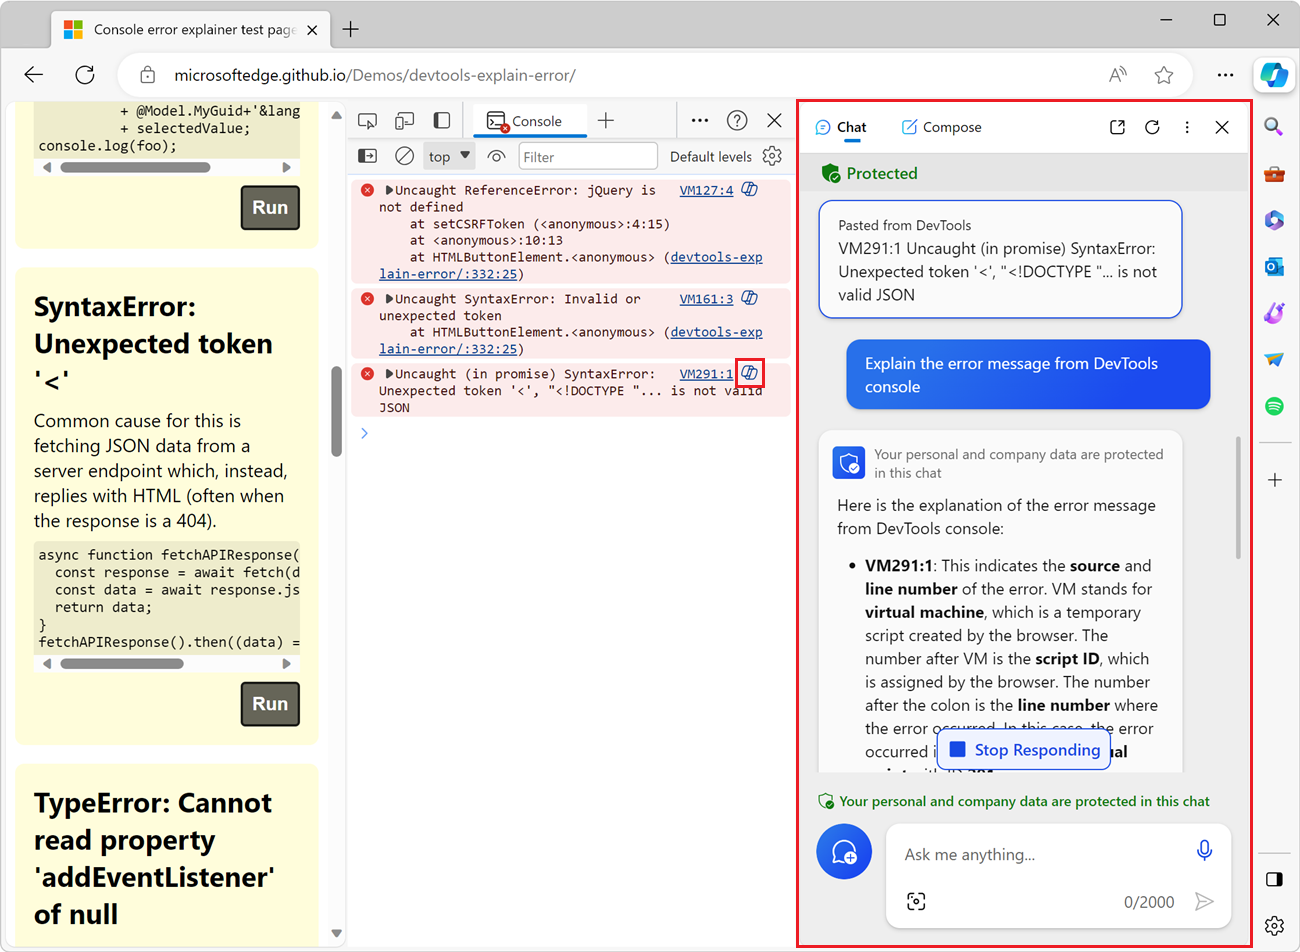
To learn more about this feature, see Explain Console errors and warnings using Copilot in Edge.
Filter messages
There are multiple ways to filter out messages in the Console.
Filter out browser messages
To only display messages that came from the JavaScript of the webpage:
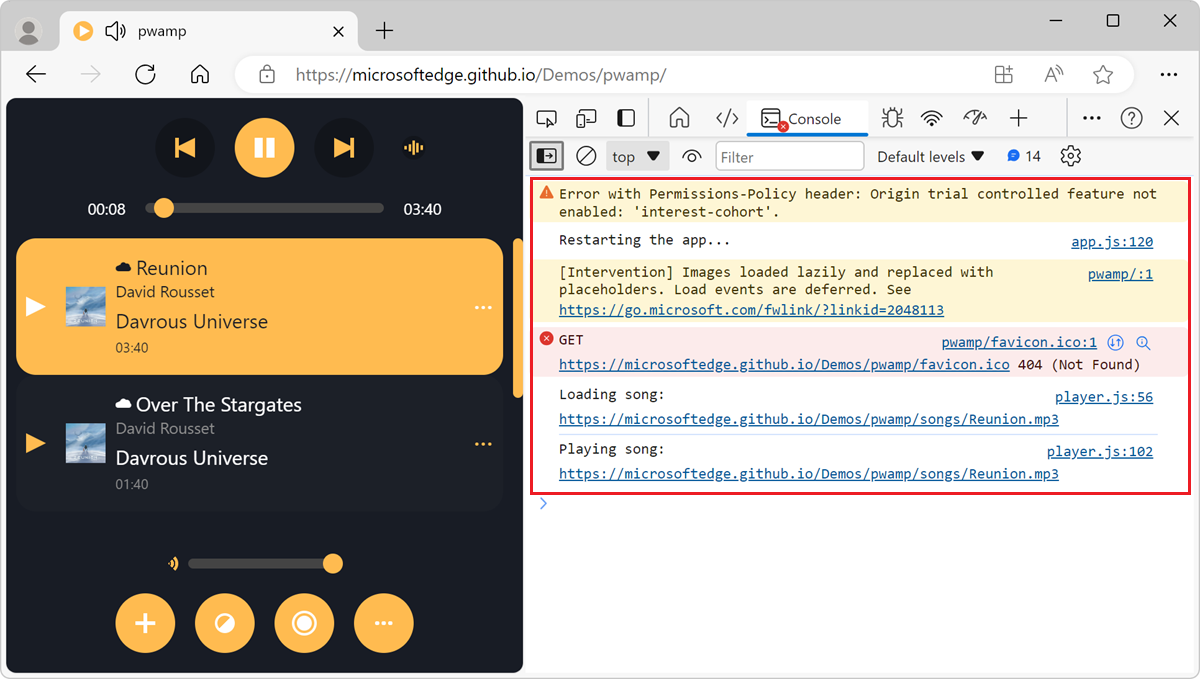
Open the demo webpage PWAmp in a new window or tab, and then click the Play button.
The demo webpage logs messages to the Console and several browser messages are also logged:
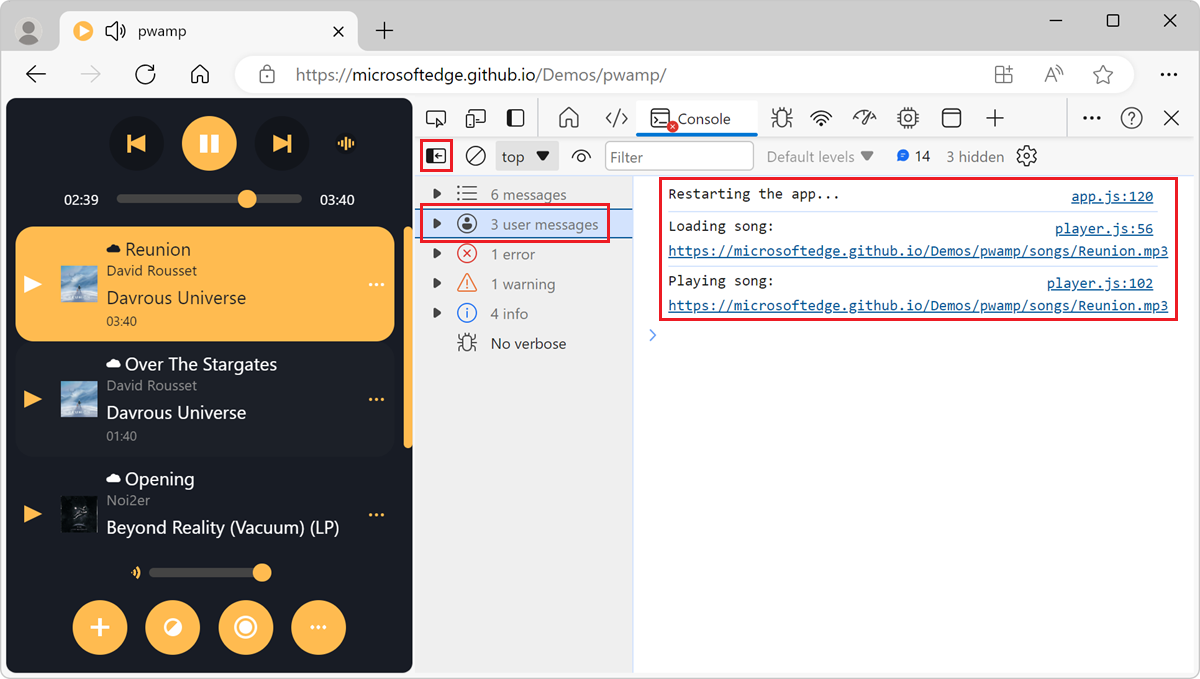
In the Console tool, to display the sidebar, click Show console sidebar (
 ).
).In the sidebar, click 3 user messages. The number of user messages might vary depending on the number of messages that the webpage logs.
The Console tool only displays the messages that the webpage logs, and the browser messages are hidden:
Filter by log level
DevTools assigns each message logged to the Console tool one of the four severity levels:
ErrorInfoVerboseWarning
The four severity levels apply to:
- Messages that you log from your webpage by using
consolemethods such asconsole.log(),console.error(), andconsole.warn(). - Messages that the browser logs.
You can hide any level of messages that you're not interested in. For example, if you're only interested in Error messages, you can hide the other three levels.
To filter messages by level:
In the toolbar of the Console tool, click the Log level dropdown list.
If the dropdown list isn't available, first hide the sidebar by clicking Hide console sidebar (
 ).
).In the dropdown list, enable or disable any of the
Verbose,Info,Warnings, orErrorslevels: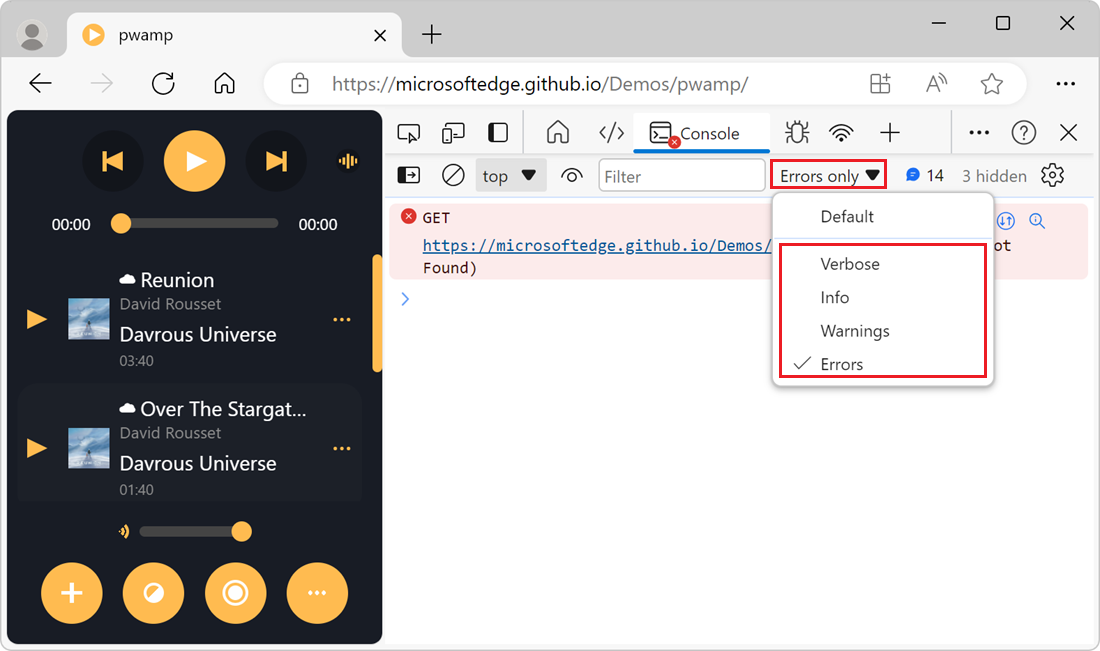
Filter messages by script URL
To filter messages by the URL of the script that logged the messages, use the Filter text box:
Open the demo webpage PWAmp in a new window or tab. Messages from various scripts are logged to the Console.
In the toolbar of the Console tool, click the Filter text box, and then type
url:. A dropdown list containing the URLs of the scripts that logged messages appears: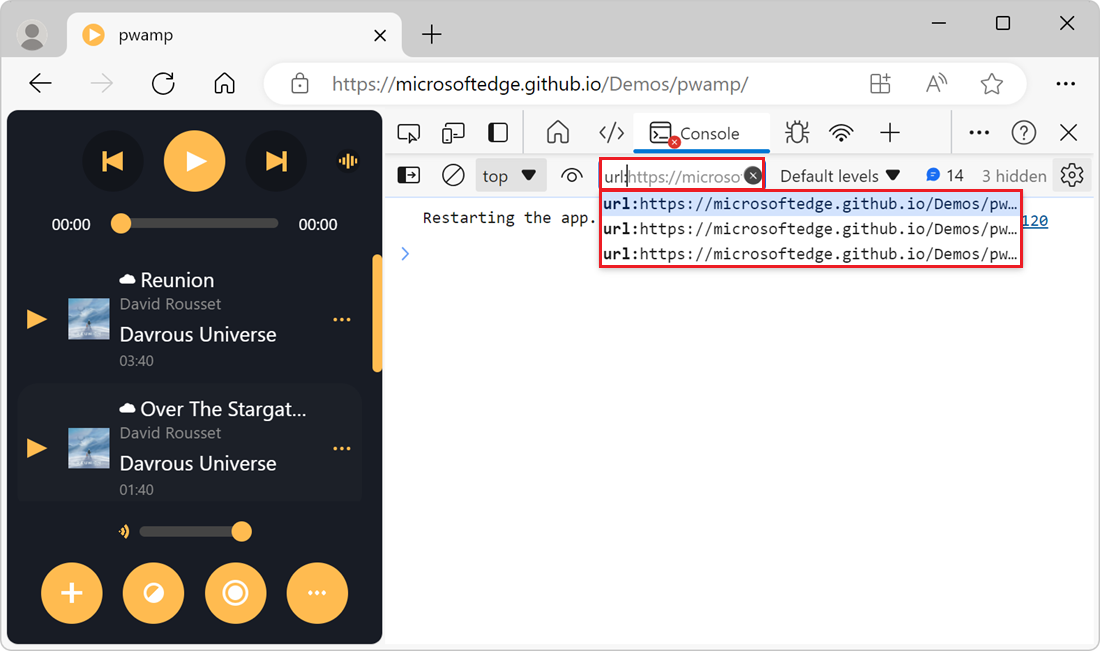
Select the URL of the script that you want to focus on. The Console tool only displays messages from that script:
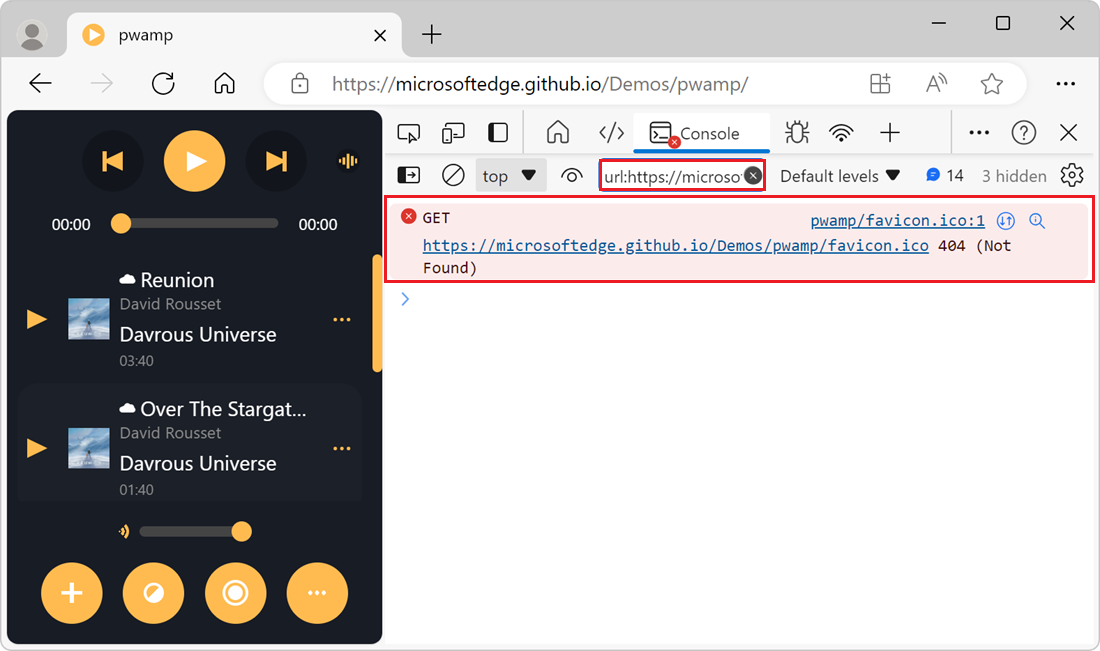
You don't have to choose from the list of URLs that the Console tool provides in the Filter dropdown list. You can type the URL, or part of the URL, that you want to filter by. For example, if https://example.com/a.js and https://example.com/b.js are logging messages, url:example.com allows you to focus on the messages from these two scripts.
Reverse the filter with a negative URL filter
To hide messages logged from a script, in the Filter text box, type -url: followed by the URL, or part of the URL, of the script. For example, to hide messages from https://example.com/a.js, type -url:example.com/a.js.
Display messages from a single script by using the sidebar
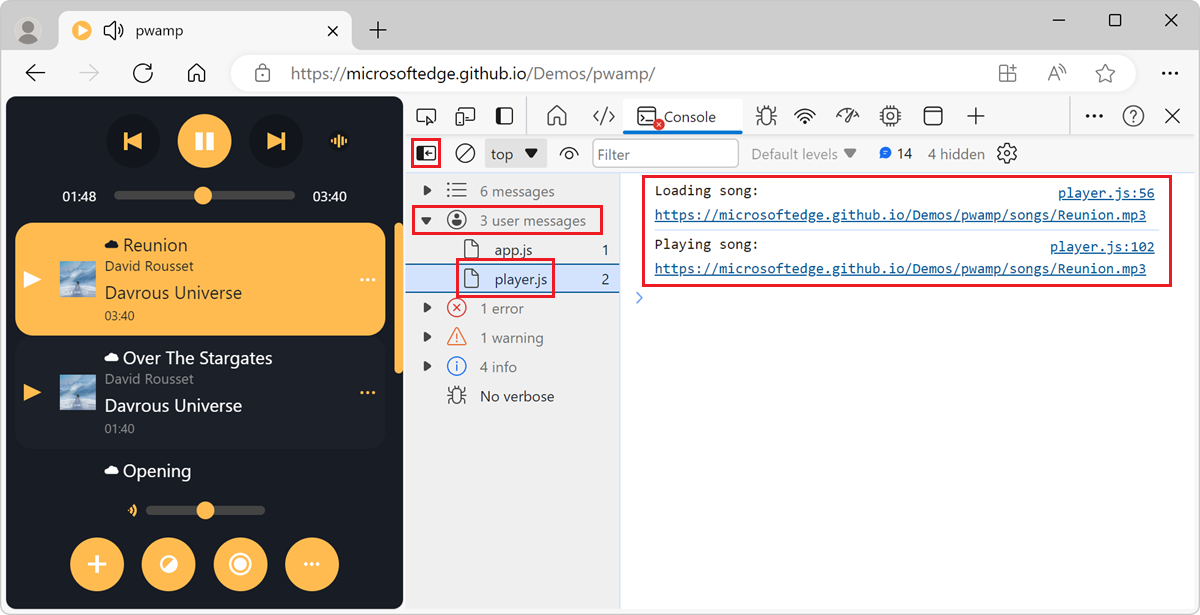
To display messages from a single script, by using the sidebar:
To display the sidebar in the Console, click Show console sidebar (
). The sidebar appears.Expand the 3 user messages section. The number might vary depending on the number of messages that the webpage logs. The list of scripts that logged messages appears.
Select the script script that contains the messages that you want to focus on. The Console only displays messages from that script:
Filter out messages from different JavaScript contexts
By default, the Console tool displays messages from all the JavaScript contexts that are running on the webpage. This might include messages from cross-domain <iframe> elements that are embedded in the webpage, or service workers that are running in the background.
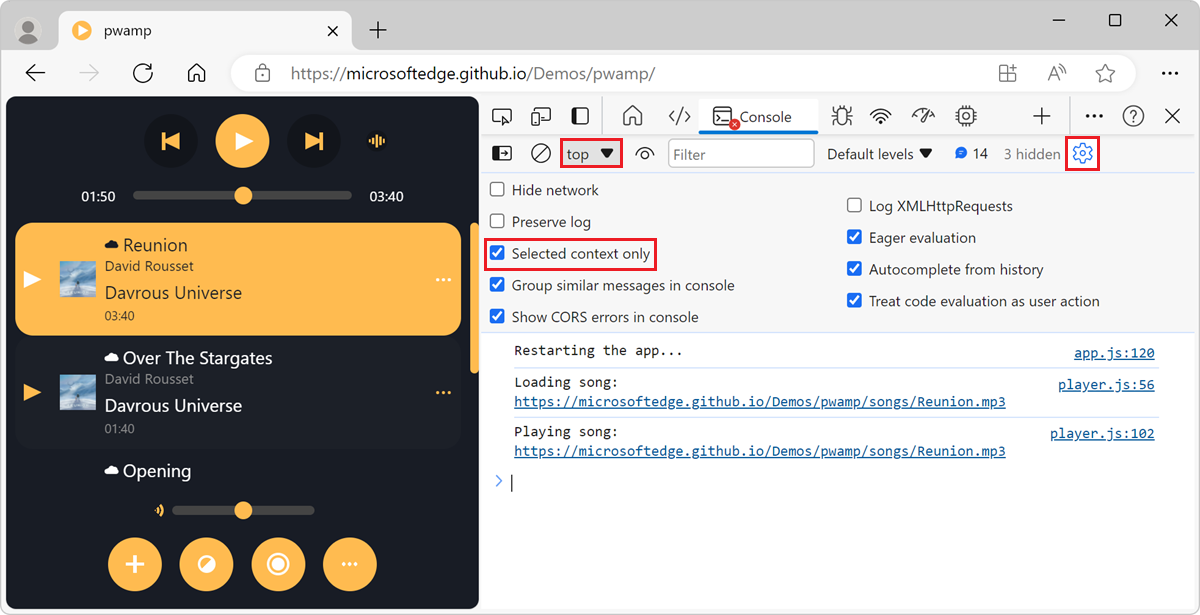
To only display messages from one JavaScript context:
Click the Console Settings (
) button. The settings section appears.Select the Selected context only checkbox. Only the messages that are logged by the top JavaScript context are displayed in the Console.
To choose a difference context, in the toolbar of the Console tool, click the JavaScript context dropdown list, and then select the context that you want to focus on:
To learn more about selecting other JavaScript context, see Select a context to run JavaScript expressions.
Filter messages by using a regular expression pattern
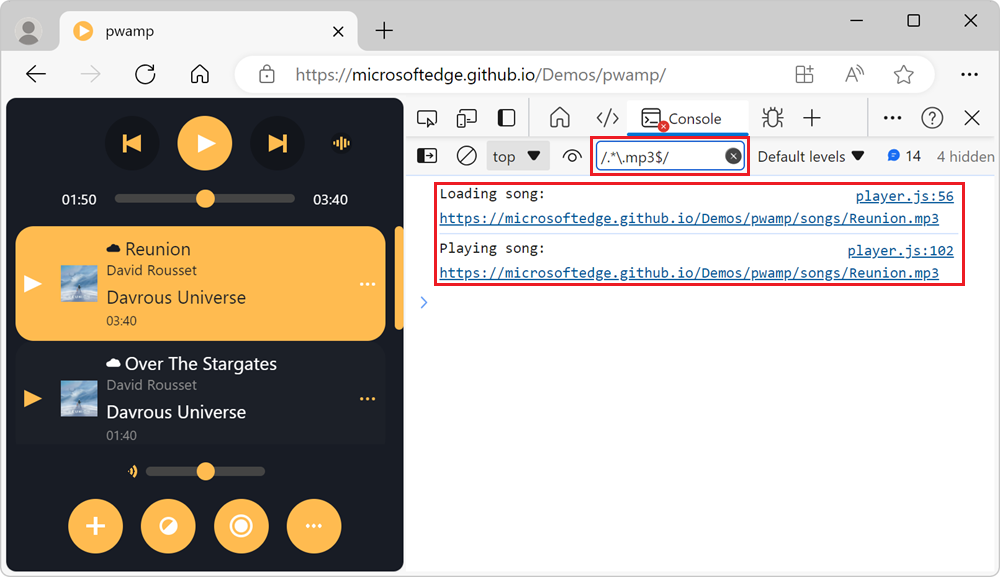
To only display the messages that match a regular expression pattern:
In the toolbar of the Console tool, click the Filter text box.
Type a regular expression pattern, such as
/.*\.mp3$/to match messages that end with .mp3.The Console only shows the message that match the regular expression pattern:
Run JavaScript
This section contains features related to running JavaScript in the Console. For a hands-on walkthrough, see Run JavaScript in the Console.
Run expressions again by using the Console history
To run an JavaScript expression that you ran earlier in the Console:
Press Up Arrow to cycle through the history of the JavaScript expressions that you ran earlier.
Press Enter to run the expression again.
Watch the value of an expression in real time by using a live expression
To watch the value of a JavaScript expression in real-time, instead of running the expression repeatedly, create a live expression:
In the toolbar of the Console tool, click the Create live expression button (
 ). The Expression text box appears below the toolbar.
Enter a JavaScript expression, and then click outside of the Expression text box. The new expression and its value appear at the top of the Console tool.
For more information, see Monitor changes in JavaScript using Live Expressions.
Disable evaluating JavaScript expressions as you type
By default, the Console tool displays a preview of the value of an expression, as you type the JavaScript expression in the Console.
To turn off the live preview as you type:
Click the Console Settings (
) button.Clear the Eager evaluation checkbox.
Turn off autocomplete from history
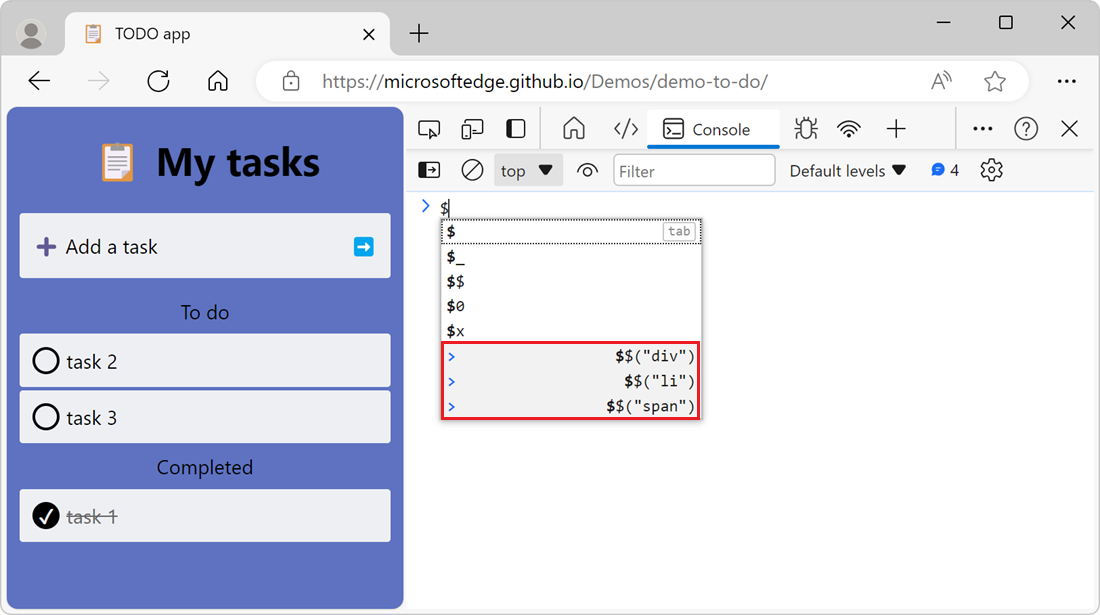
When you type a JavaScript expression in the Console tool, an autocomplete popup window appears. The autocomplete popup window contains:
- Suggestions for global JavaScript objects and functions that match the characters that you've typed.
- Suggestions for JavaScript expressions that you ran earlier.
The suggestions for JavaScript expressions that you ran earlier are prefixed with the > character and appear at the bottom of the autocomplete window:
To stop displaying suggestions from your previously ran expressions:
Click the Console Settings (
) button.Clear the Autocomplete from history checkbox.
Select a context to run JavaScript expressions
Webpages have a main browsing context where the webpage's JavaScript runs. However, webpages can have additional JavaScript contexts, such as cross-domain <iframe> elements that are embedded in the webpage, or service workers that are running in the background.
By default, the JavaScript context dropdown list that's located in the toolbar of the Console tool is set to top, which represents the main webpage's browsing context:
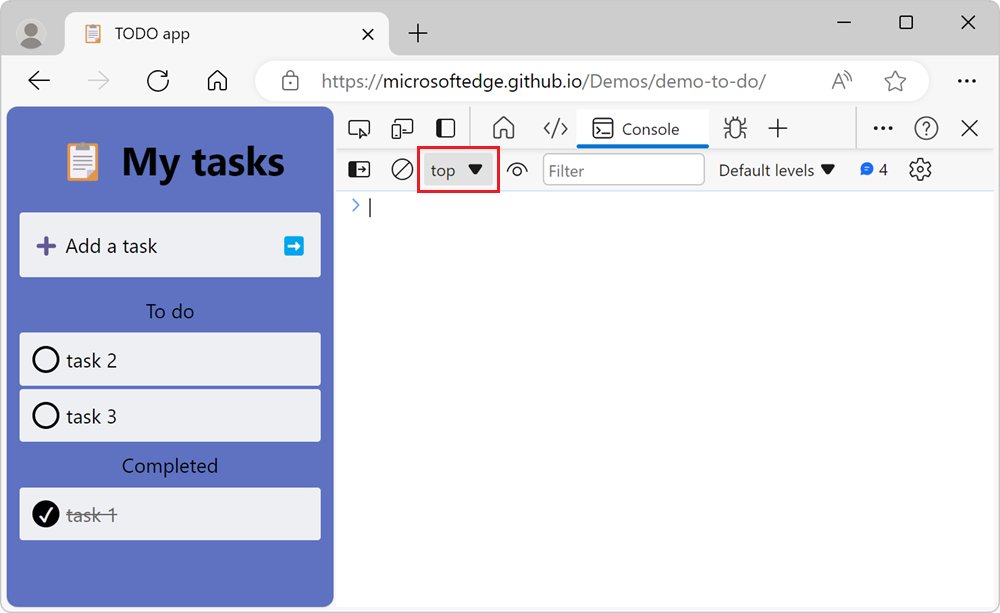
Any JavaScript expression that you run in the Console tool is evaluated in the context that's selected in the JavaScript context dropdown list.
To run JavaScript expressions in a different context, such as within a cross-domain <iframe> element, click the JavaScript context dropdown list, and then select another browsing context.
Clear the Console
To clear the Console, use any of the following approaches:
Click the Clear console (
 ) button.
Right-click a message and then select Clear console.
Type
clear()in the Console tool and then press Enter.Call
console.clear()from your webpage's JavaScript.Press Ctrl+L while the Console tool is in focus.
See also
- Log messages in the Console tool - How to filter log messages such as Info, Warnings, and Errors in the Console.
- Get started with running JavaScript in the Console - Steps to walk you through issuing JavaScript statements and expressions in the Console.
- Console object API Reference - Functions and expressions that you can enter in the Console to write messages to the Console, such as
console.log(). - Console tool utility functions and selectors - Convenience functions that you can enter in the Console tool, such as
monitorEvents().
Note
Portions of this page are modifications based on work created and shared by Google and used according to terms described in the Creative Commons Attribution 4.0 International License. The original page is found here and is authored by Kayce Basques.
![]() This work is licensed under a Creative Commons Attribution 4.0 International License.
This work is licensed under a Creative Commons Attribution 4.0 International License.