Note
Access to this page requires authorization. You can try signing in or changing directories.
Access to this page requires authorization. You can try changing directories.
These are the latest features in the Stable release of Microsoft Edge DevTools.
Video: Microsoft Edge | What's New in DevTools 96
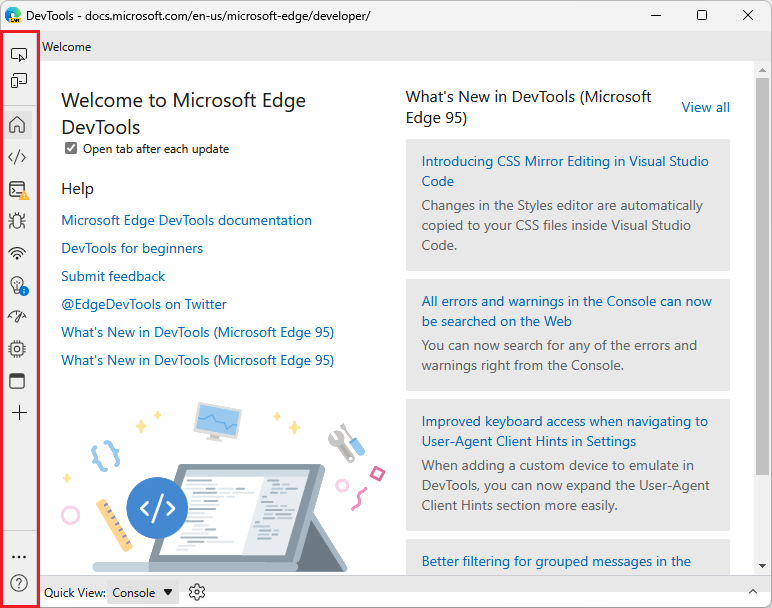
New DevTools UI available (in preview)
The Microsoft Edge DevTools team is experimenting with a new DevTools UI: Focus Mode. Focus Mode reduces distractions and clutter with a more modern and simplified layout. The new Activity Bar allows you to pin your favorite tools in a horizontal or vertical toolbar to use screen space more efficiently.
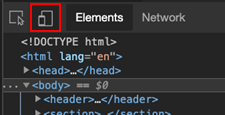
To give this new UI a try in Microsoft Edge version 96, select Settings (![]() ) > Experiments > Focus Mode.
) > Experiments > Focus Mode.
Starting with Microsoft Edge version 96, the experiment's checkbox is labeled Focus Mode rather than Focus Mode and DevTools Tooltips.
This UI is still in development and may change in future versions of Microsoft Edge. We're eager to hear your feedback about this new DevTools UI. Send us your feedback by tweeting @EdgeDevTools. Or, with the Focus Mode experiment turned on, at the bottom of the Activity Bar, select Help (![]() ) > Feedback, to show the Send feedback window.
) > Feedback, to show the Send feedback window.
See also:
- DevTools: Focus Mode UI in the
MSEdgeExplainersrepo.
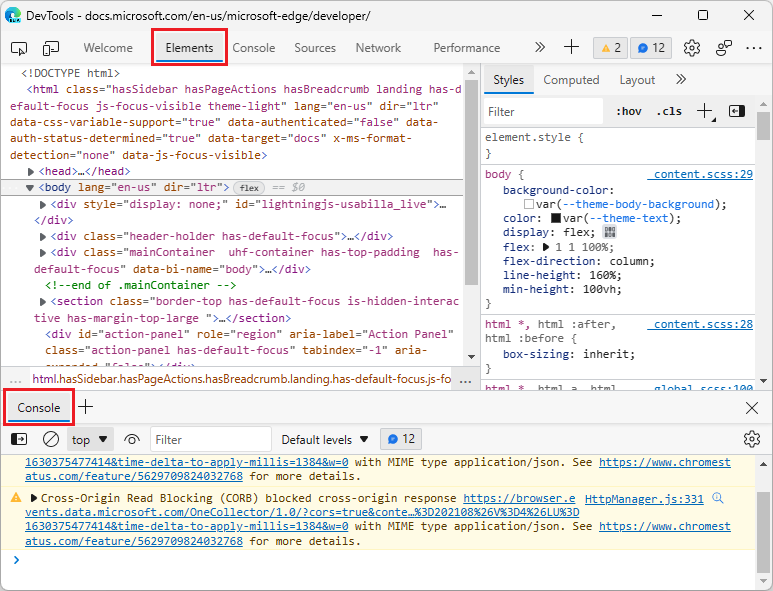
Console can once again appear in the top and bottom panels
Since Microsoft Edge version 87, you've been able to move any tool between the top and bottom panels, including the Console tool. However, we heard from developers that moving the Console tool repeatedly was cumbersome. As of Microsoft Edge version 96, the default experience for the Console tool has been restored, allowing you to quickly switch between a full-screen view of the Console (in the top panel) and a split-screen view (with the Console displayed in the bottom panel), without moving the Console tool.
The Console can be opened in the Drawer (now Quick View) at the bottom of DevTools, alongside another tool:
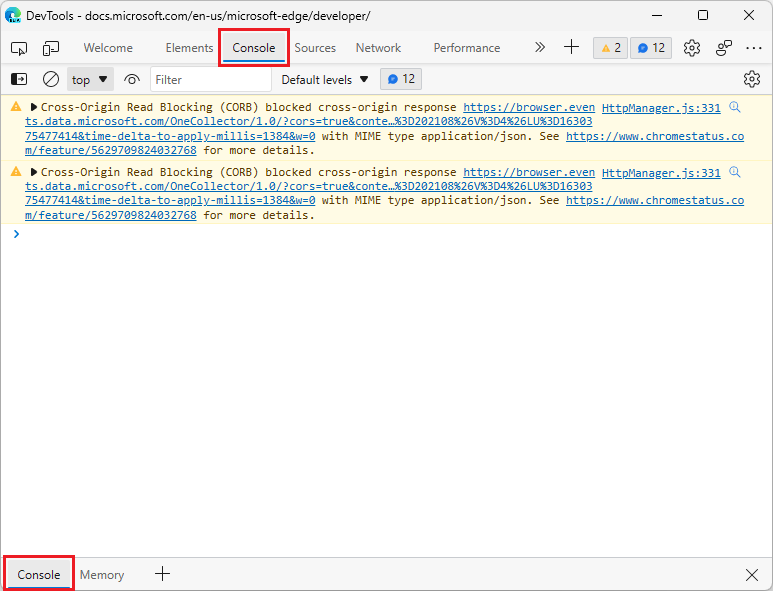
When Console is selected in the top panel, the bottom panel is automatically minimized, if the bottom panel was displaying the Console:
If you want to only allow the Console tool to open in a single place, you can configure the behavior of the Console:
In the main toolbar or the Drawer toolbar, right-click the Console tab, and then select Configure console. The Settings > Preferences page is displayed.
In the Console section, clear the checkbox Show Console tab in main panel and drawer, and then click Close (x).
See also:
- Activity Bar tools vs. Quick View tools in About the list of tools
- Move tools between top and bottom panels in What's New in DevTools (Microsoft Edge 87).
Microsoft Edge DevTools Visual Studio Code extension
For general information about this extension, see Microsoft Edge DevTools extension for Visual Studio Code.
Display your web project inside the editor, and simulate different devices
The Microsoft Edge DevTools for Visual Studio Code extension now features a dockable screencast and device emulation:
You can see your web project in a dedicated tab inside of Visual Studio Code, and also simulate various devices:
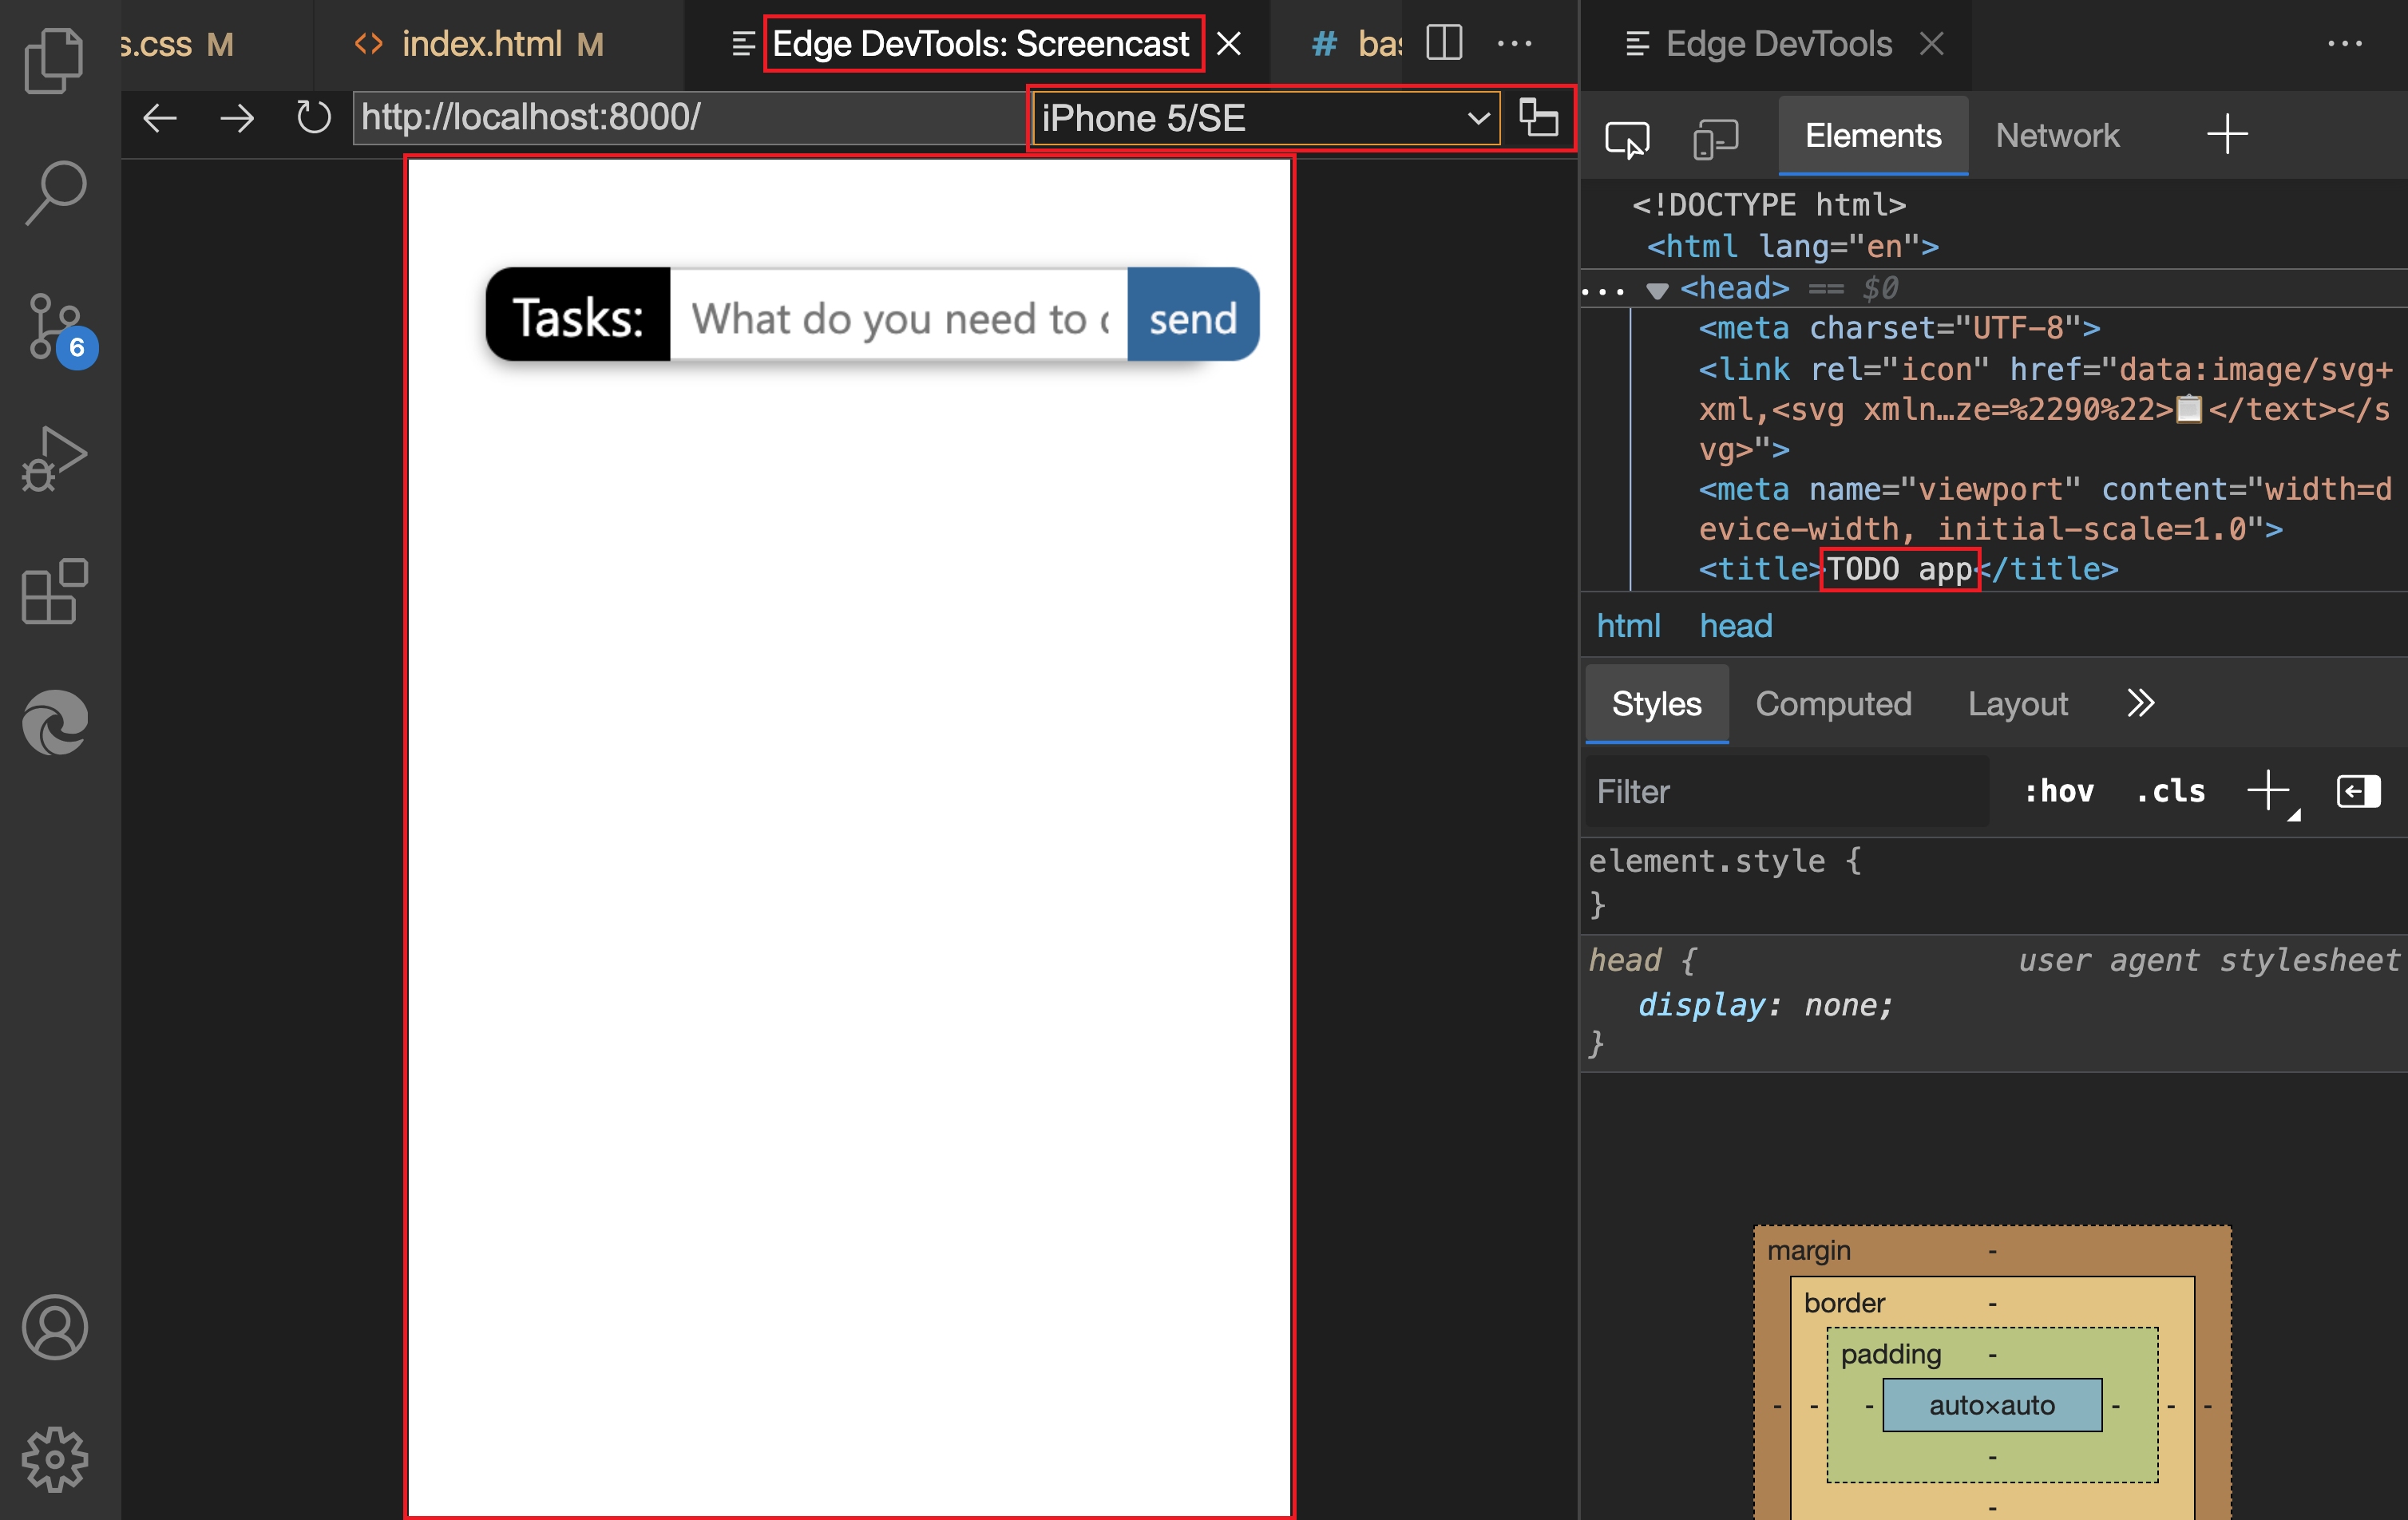
For details about device emulation, see Device and state emulation.
Live, inline issue reporting
The extension also now features live, inline issue reporting. Instead of finding out about issues in a separate tool, Visual Studio Code highlights the issues in your source code and reports them live while you enter your code:
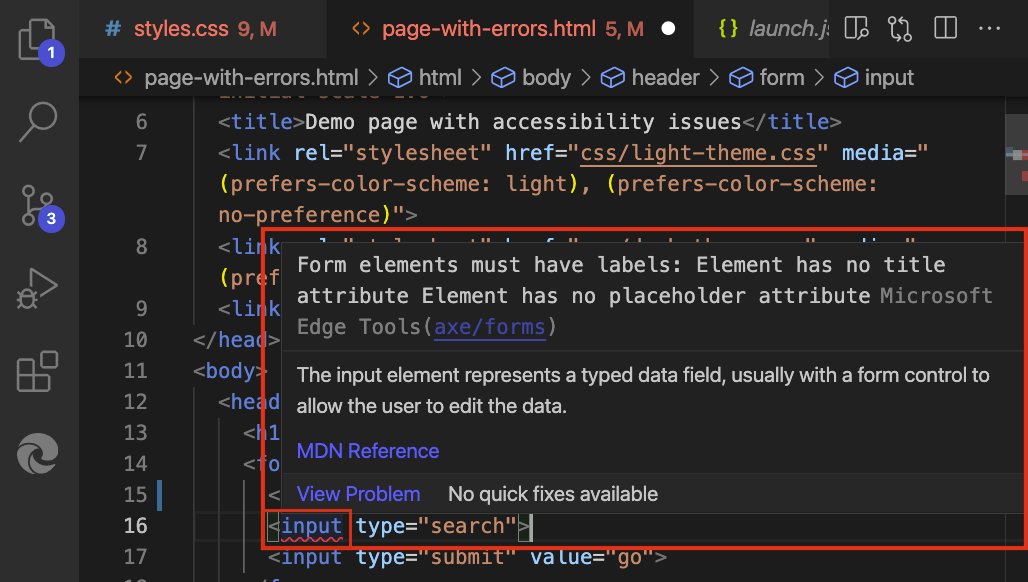
For details, see Inline and live issue analysis.
Sources tool now notifies you when sourcemaps can't be loaded
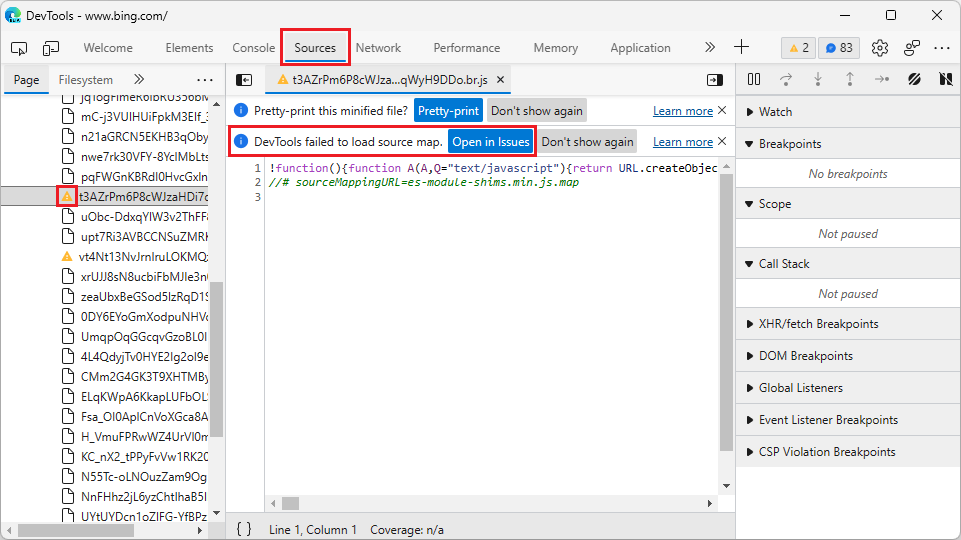
In Microsoft Edge version 96, the Sources tool now provides several indications in the UI when DevTools cannot load your sourcemaps. In the Page tab in the Navigator pane in the Sources tool, files that DevTools can't load sourcemaps for have a warning icon in place of the file icon.
Selecting a file with the warning icon opens the file in the Sources tool with an infobar indicating that DevTools either couldn't fetch the sourcemap correctly from the server or couldn't parse the sourcemap correctly:
From the infobar, you can learn more about the issue by selecting the Open in Issues button. The Issues tool then opens in the Drawer (now Quick View panel) at the bottom of DevTools, and provides information about how to resolve the issue and get your sourcemap loaded correctly in DevTools:
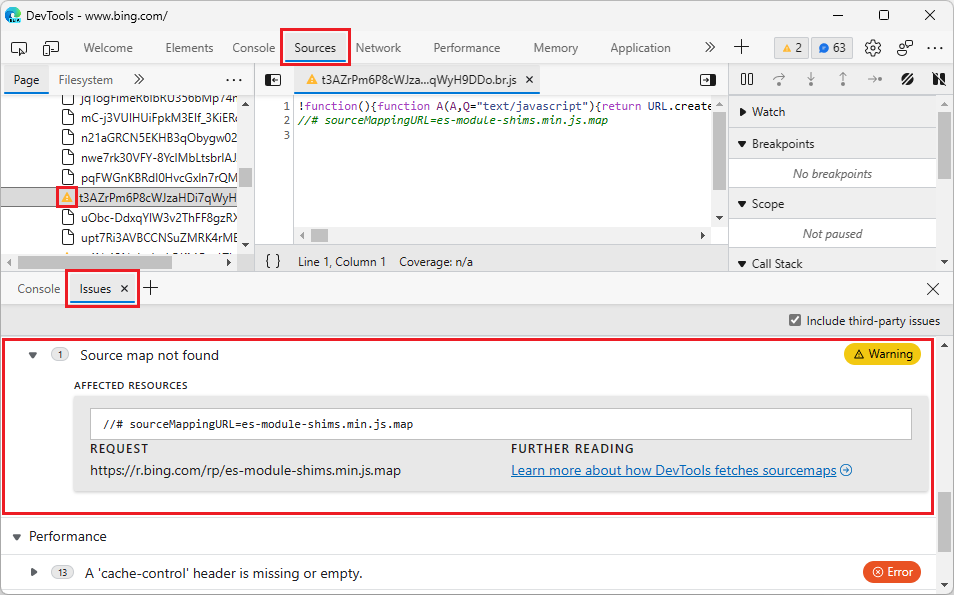
To prevent the infobar about sourcemaps from cluttering the Sources tool, select the Don't show again button. To prevent issues related to sourcemaps from cluttering the Issues tool, clear the Include third-party issues checkbox in the Issues tool.
See also:
Opening source files in Visual Studio Code now integrates better with the Sources tool
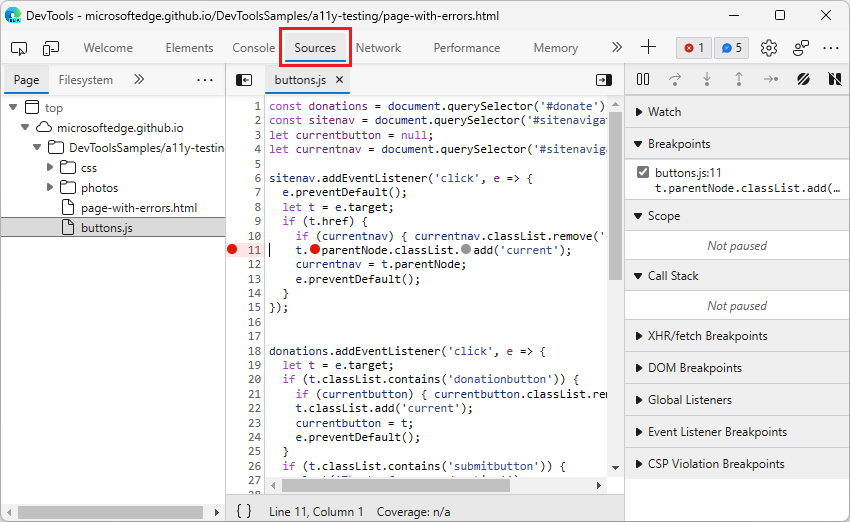
In previous versions of Microsoft Edge, turning on the Open source files in Visual Studio Code experiment had unexpected behavior when you had already been using the Sources tool in DevTools. Setting breakpoints would direct you to Visual Studio Code or to documentation to configure the experiment correctly.
In Microsoft Edge version 96, the Open source files in Visual Studio Code experiment now integrates better with the Sources tool.
If the Sources tool is open and you then turn on the Open source files in Visual Studio Code experiment, setting breakpoints or opening files now opens the Sources tool, rather than directing you to Visual Studio Code or to documentation to configure the experiment correctly.
As with earlier versions of Microsoft Edge, if the Sources tool isn't open in DevTools and you then turn on the Open source files in Visual Studio Code experiment, setting breakpoints or opening files from tools other than the Sources tool opens the file in Visual Studio Code.
See also:
- Opening source files in Visual Studio Code - how DevTools integrates with Visual Studio Code.
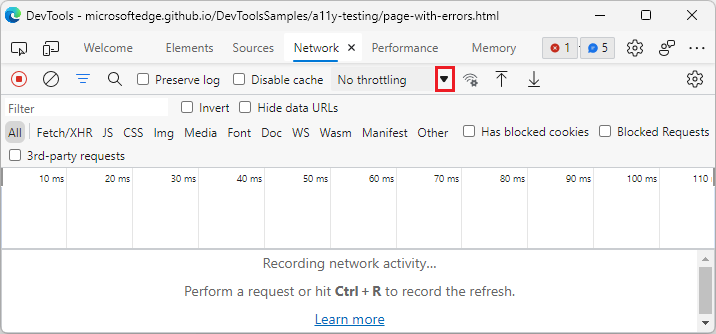
Selecting the dropdown triangle icon in the DevTools UI now opens the menu
In earlier versions of Microsoft Edge DevTools, selecting the triangle icon next to a dropdown menu didn't display the dropdown menu. To open the dropdown menu, you had to click the currently selected menu item to the left of the triangle icon, such as No throttling:
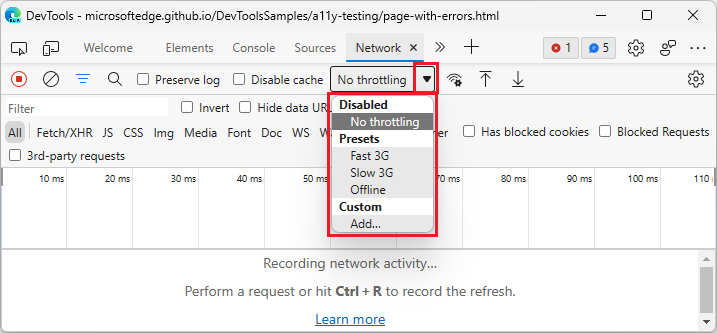
In Microsoft Edge version 96, this issue has been fixed. Selecting the triangle icon for any dropdown menu in DevTools now opens the dropdown menu:
Note
Portions of this page are modifications based on work created and shared by Google and used according to terms described in the Creative Commons Attribution 4.0 International License. The original page for announcements from the Chromium project is What's New in DevTools (Chrome 96) and is authored by Jecelyn Yeen.
![]() This work is licensed under a Creative Commons Attribution 4.0 International License.
This work is licensed under a Creative Commons Attribution 4.0 International License.