What's New in DevTools (Microsoft Edge 87)
To check out the latest features of Microsoft Edge DevTools and the Microsoft Edge DevTools extension for Microsoft Visual Studio Code and Visual Studio, read these announcements.
To stay up to date and get the latest DevTools features, download an Insiders preview version of Microsoft Edge. Whether you're on Windows, Linux, or macOS, consider using Canary (or another preview channel) as your default development browser. The Beta, Dev, and Canary versions of Microsoft Edge run as separate apps, side-by-side with the stable, released version of Microsoft Edge. See Microsoft Edge Insider Channels.
For the latest announcements, follow the Microsoft Edge team on Twitter. To report a problem with DevTools or ask for a new feature, file an issue in the MicrosoftEdge/DevTools repo.
Improving DevTools localization
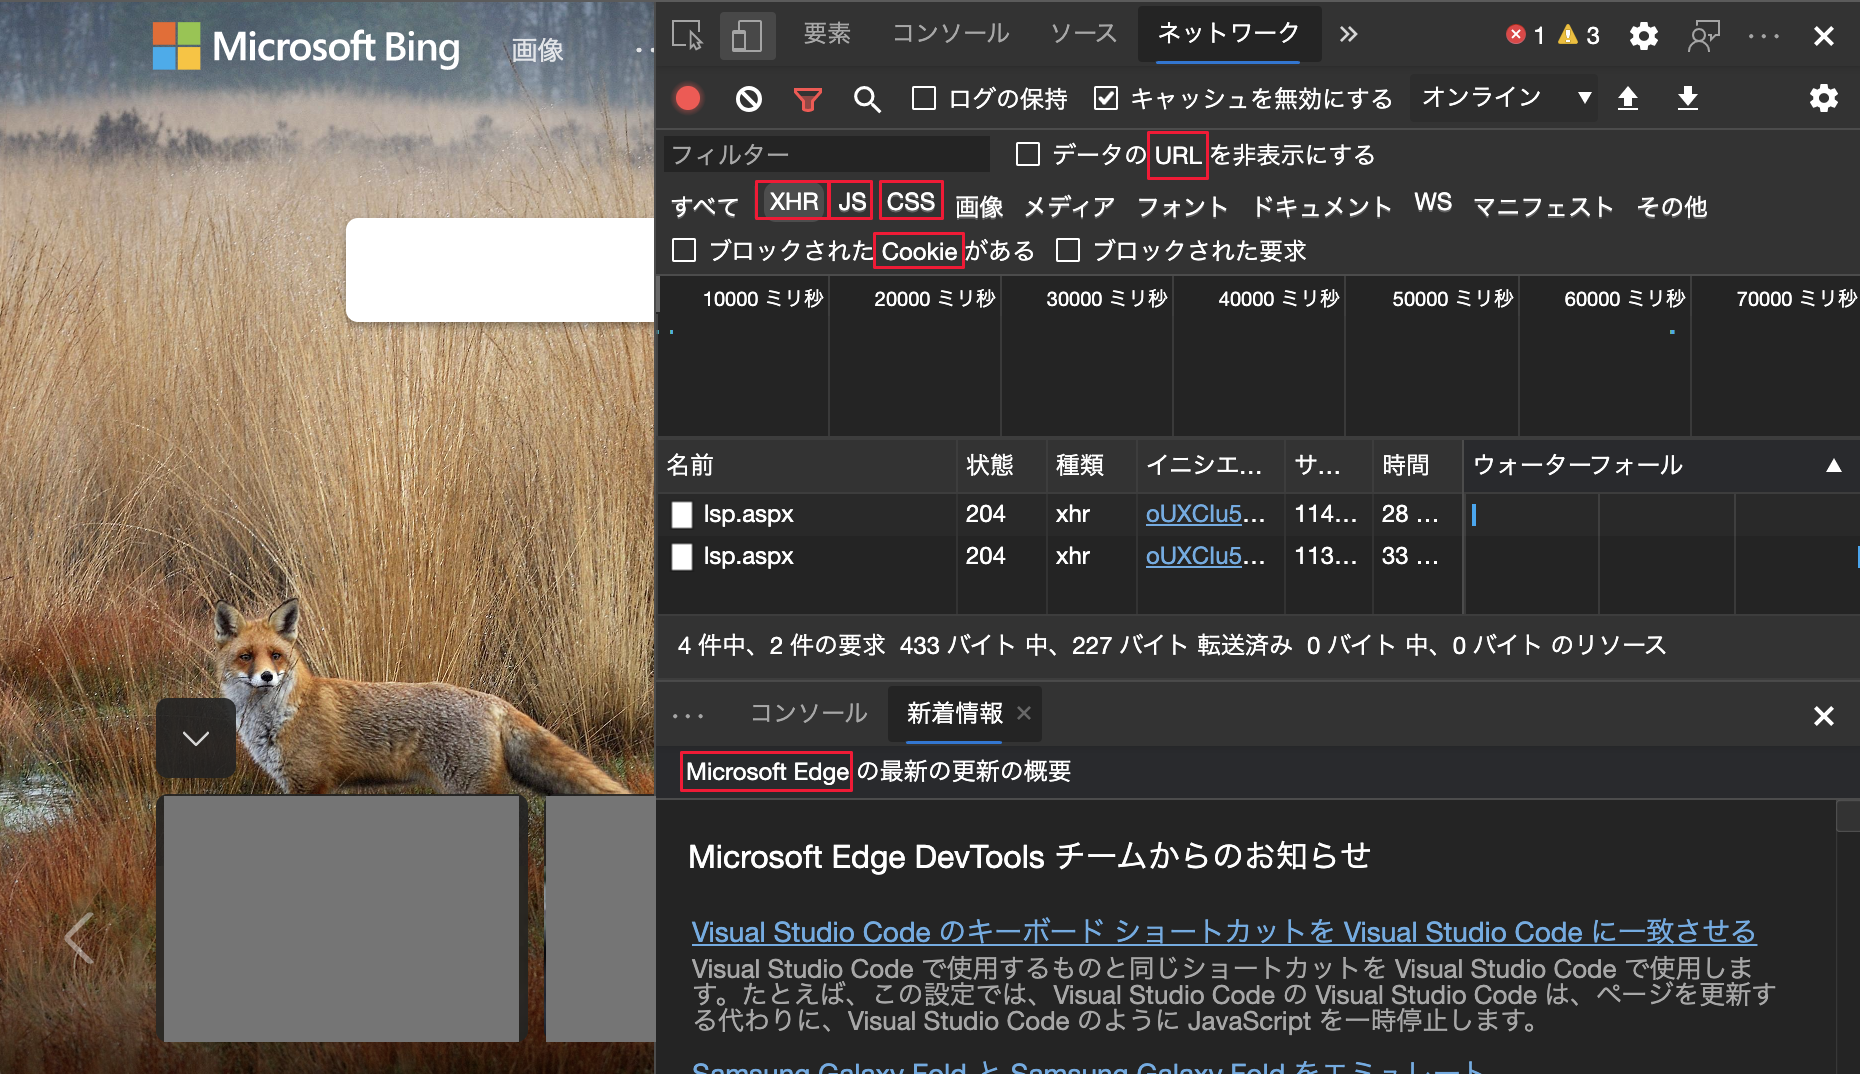
To meet your translation needs, the Microsoft Edge DevTools team is focused on improving translation quality. Starting in Microsoft Edge version 87, several strings and terms are locked and don't change, even when the rest of the DevTools are displayed in other languages. The list of affected strings and terms include the following:
- The strings in the Lighthouse tool.
- The term
service worker. - Some of the Network tool filters such as
URL,XHR,JS, andCSS. - The $0 Console Utilities API.
$0 is now available in the Console for users on localized versions of the DevTools. Thank you to the global developer community for helping improve localization of the Microsoft Edge DevTools. Continue to send feedback on localization quality to improve support for DevTools in all locales. For real-time updates on this feature in the Chromium open-source project, see Issue #1136655.
See also:
Move tools between top and bottom panels
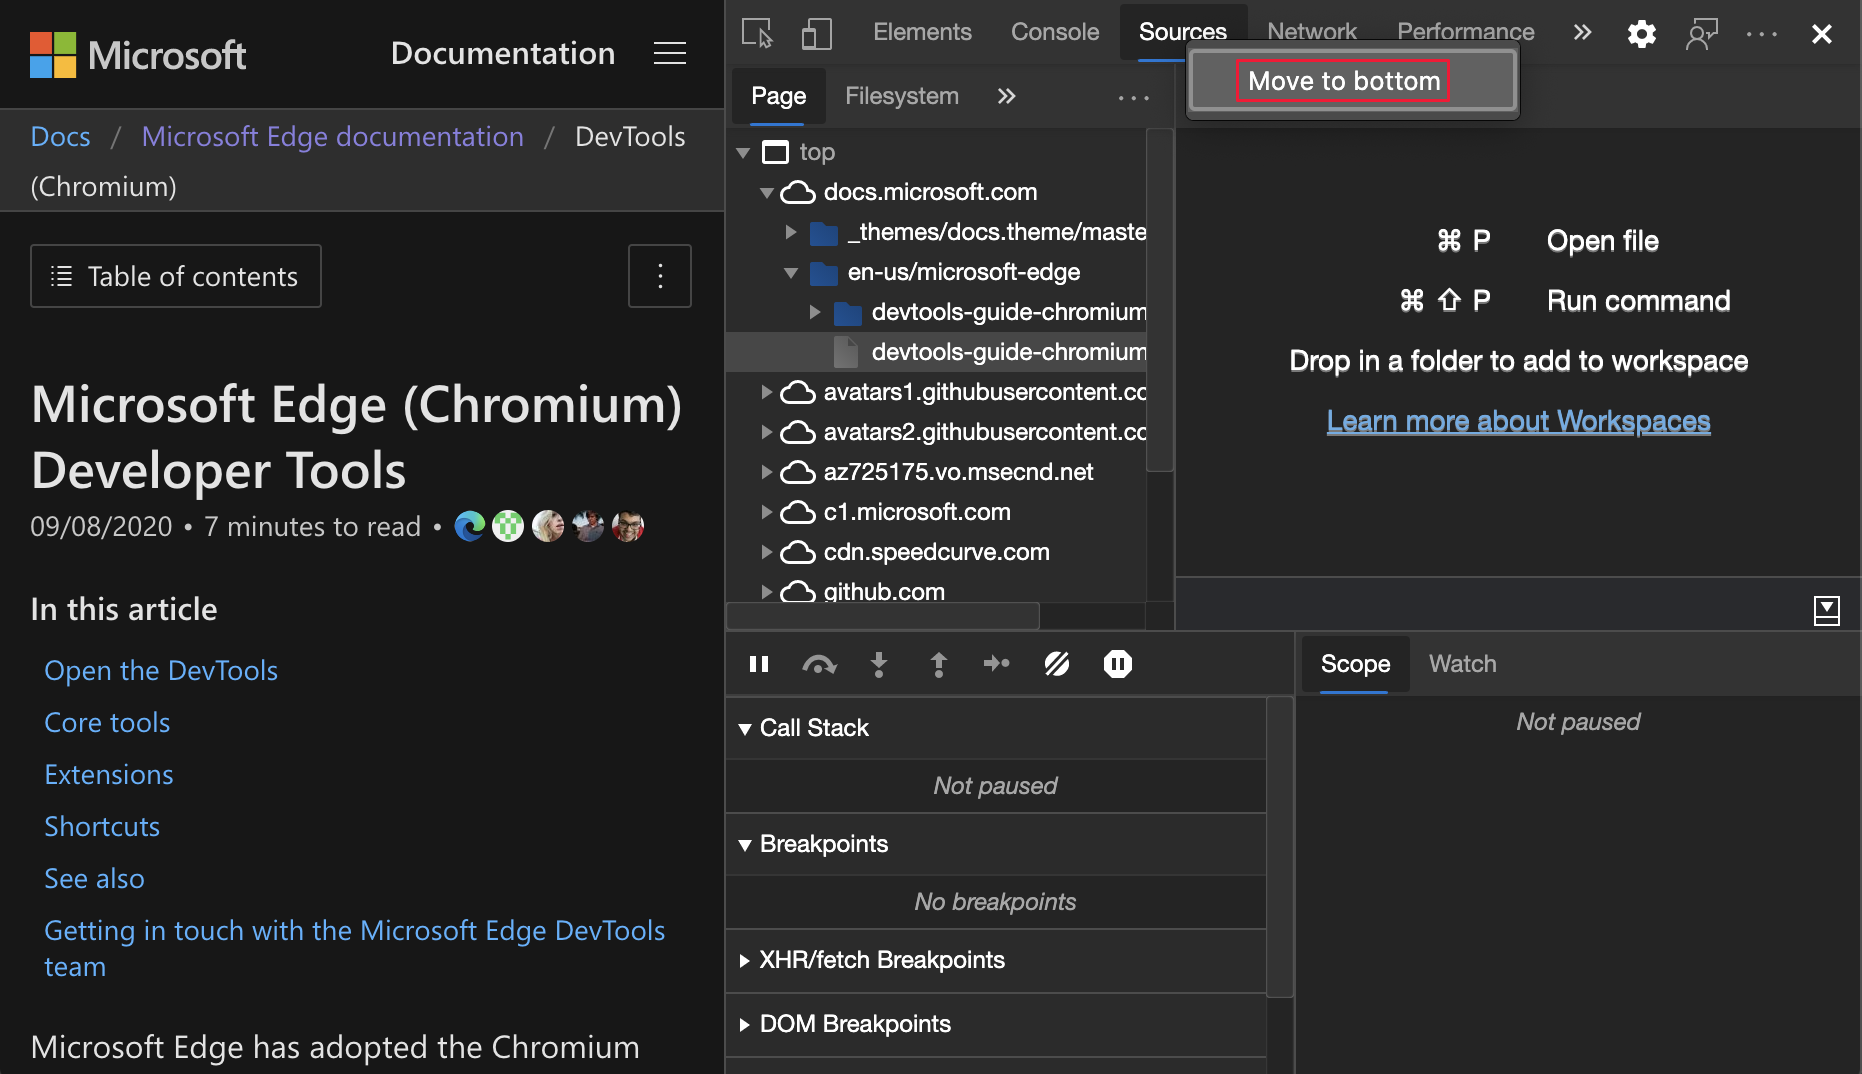
DevTools now supports moving tools between the top and bottom panels. Customize your DevTools and improve your productivity by viewing any combination of two tools at the same time. For example, view the Elements and the Sources tools at the same time (by moving the Sources tool to the bottom).
To move any top tool to the bottom, right-click a tab and then select Move to bottom:
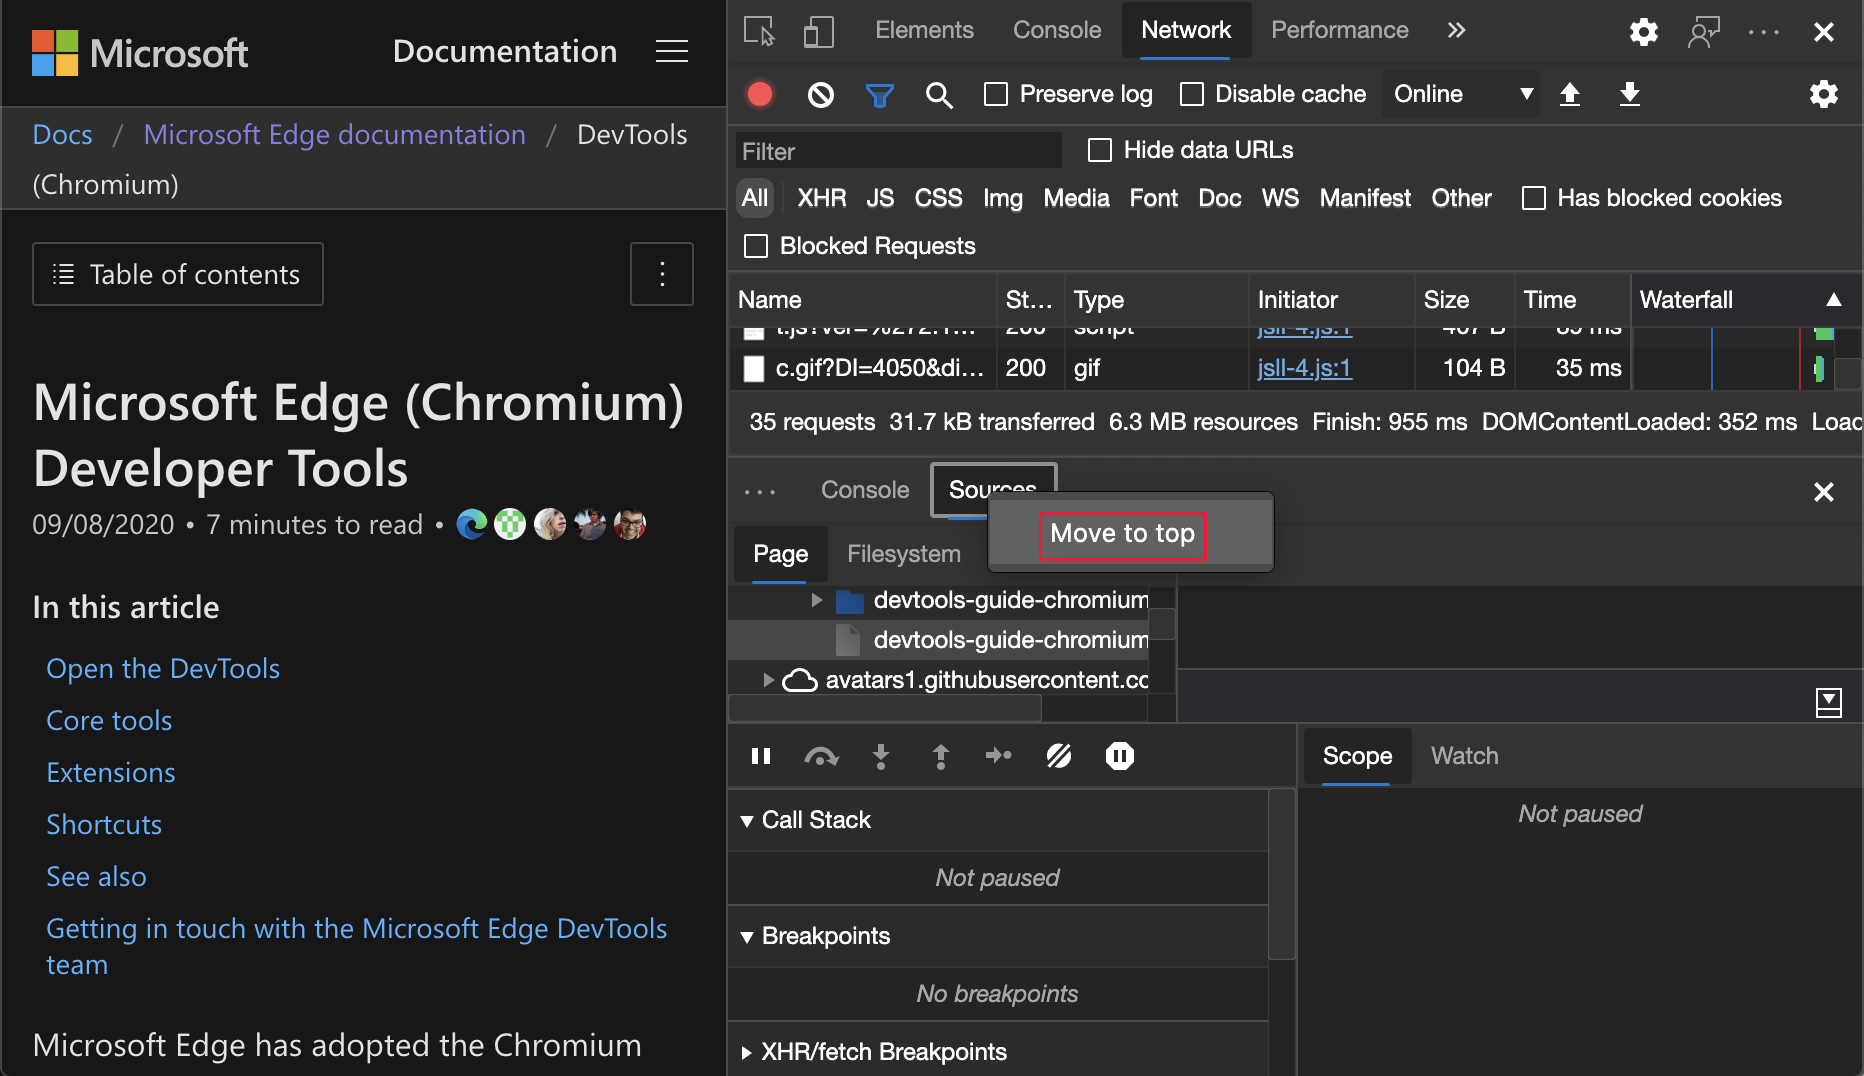
To move any bottom tool to the top, right-click a tab and then select Move to top:
For the history of this feature in the Chromium open-source project, see Issue #1075732.
See also:
- Activity Bar tools vs. Quick View tools in About the list of tools
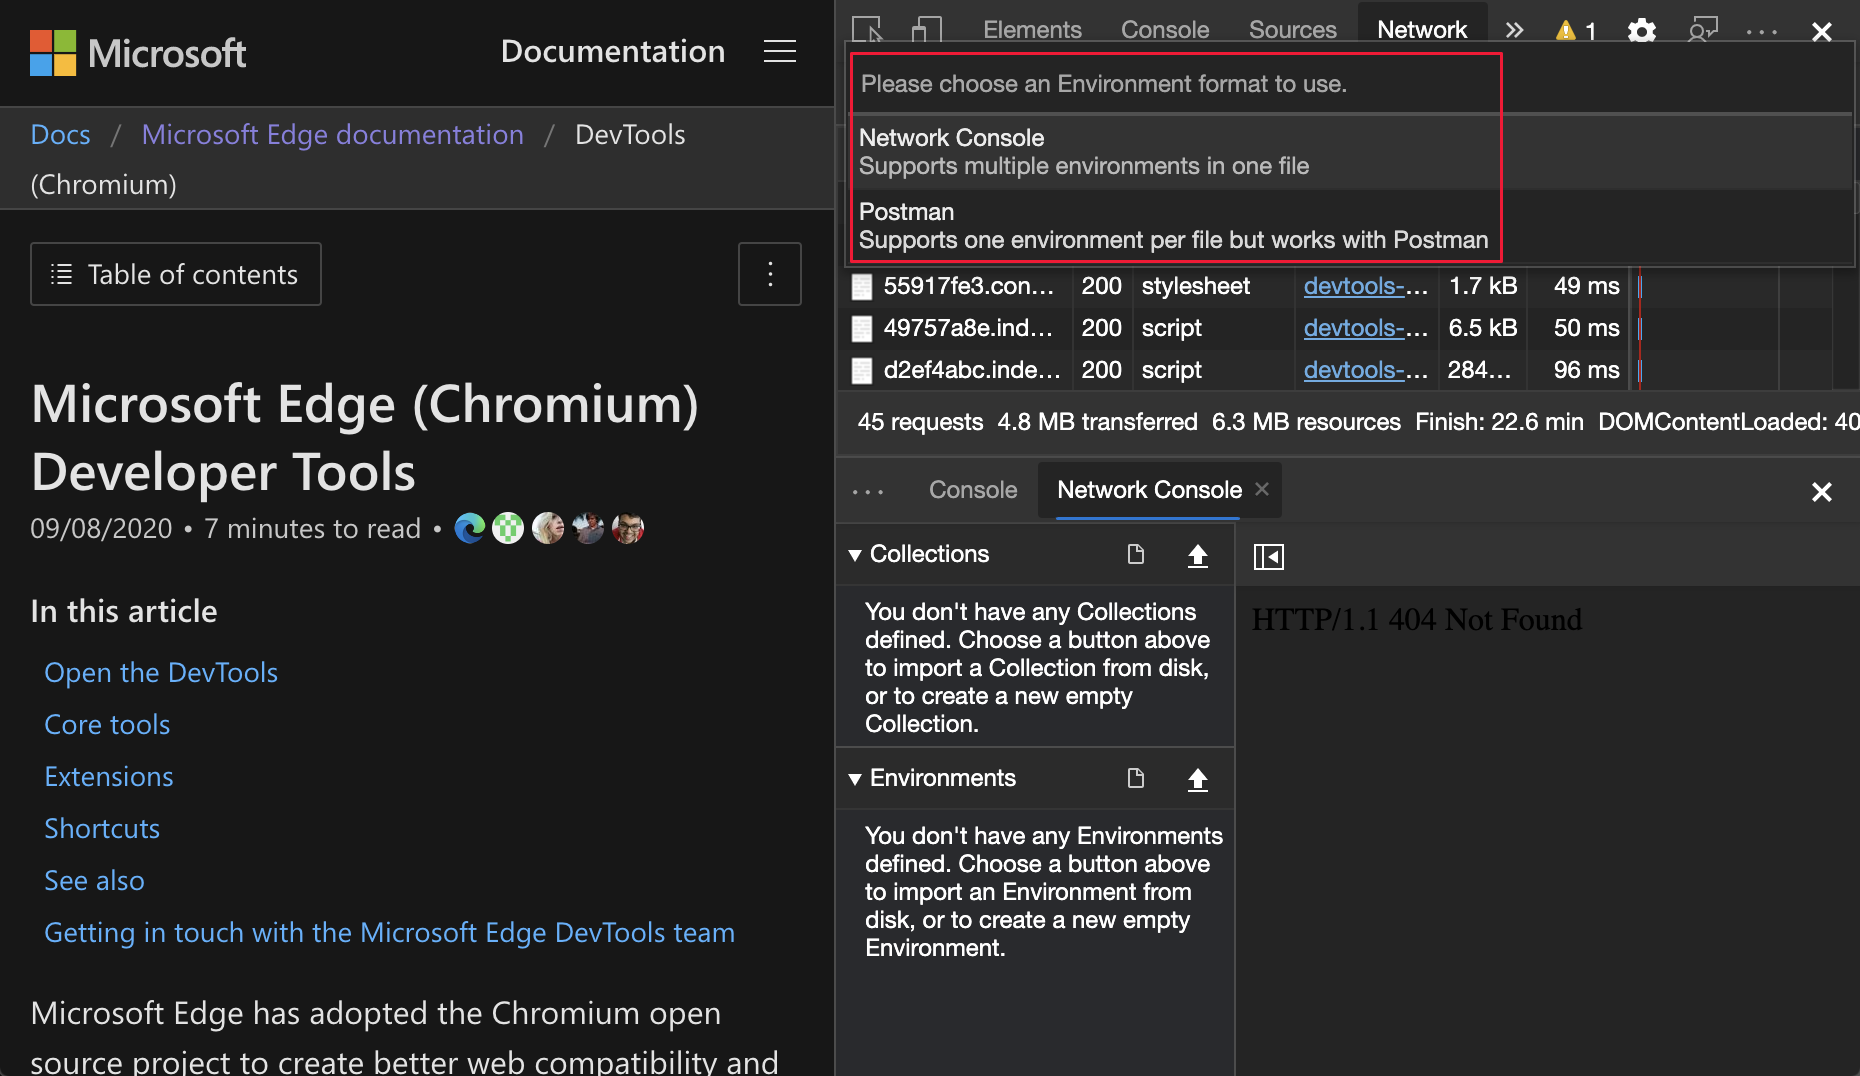
Save and export using the Network Console
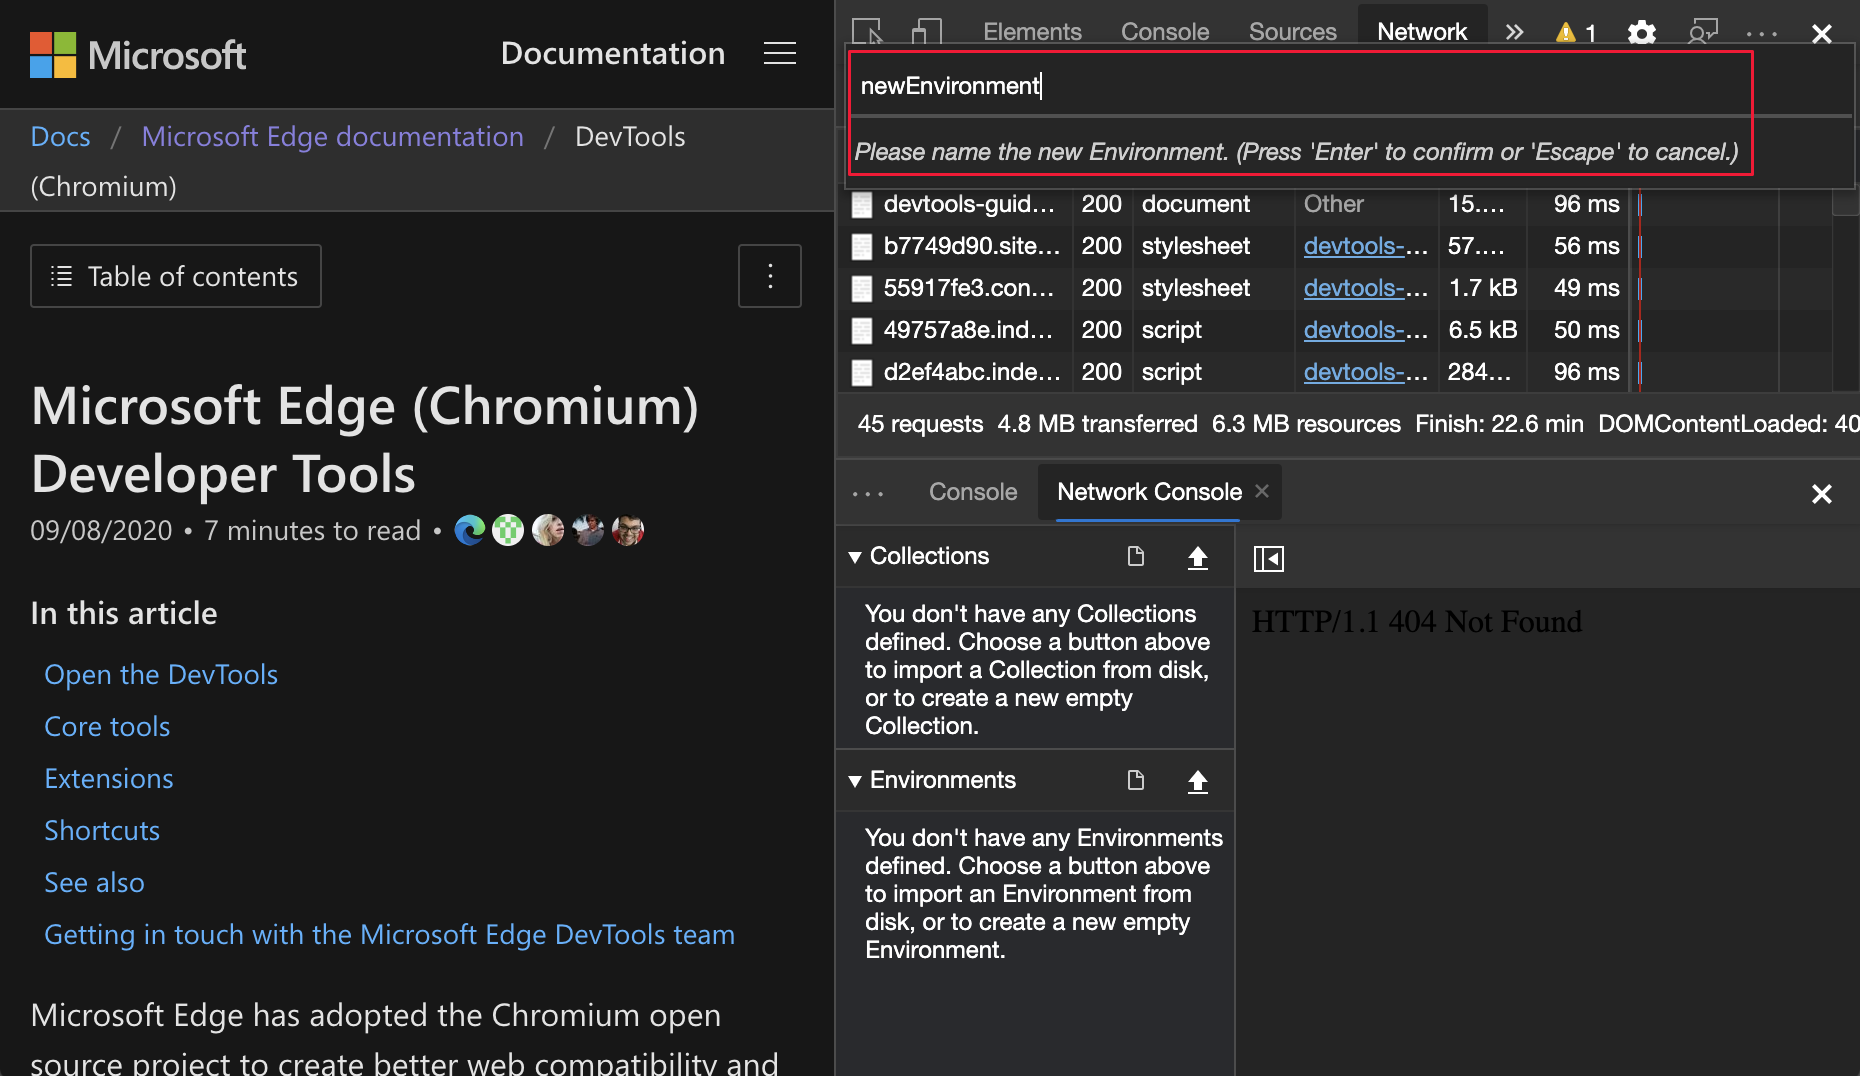
The Network Console tool now has improved compatibility with the Postman v2.1 and OpenAPI v2 schemas.
The Network Console tool now supports the following actions:
- Save and export Collections and Environments.
- Edit and export sets of environment variables within the Network Console tool.
Entering a name for the new environment:
Selecting the format for the new environment:
Update: This feature has been released and is no longer experimental.
See also:
- Save and export Collections, Environments, and environment variables in Compose and send web API requests using the Network Console tool.
For history, in the Chromium open-source project, see Issue #1093687.
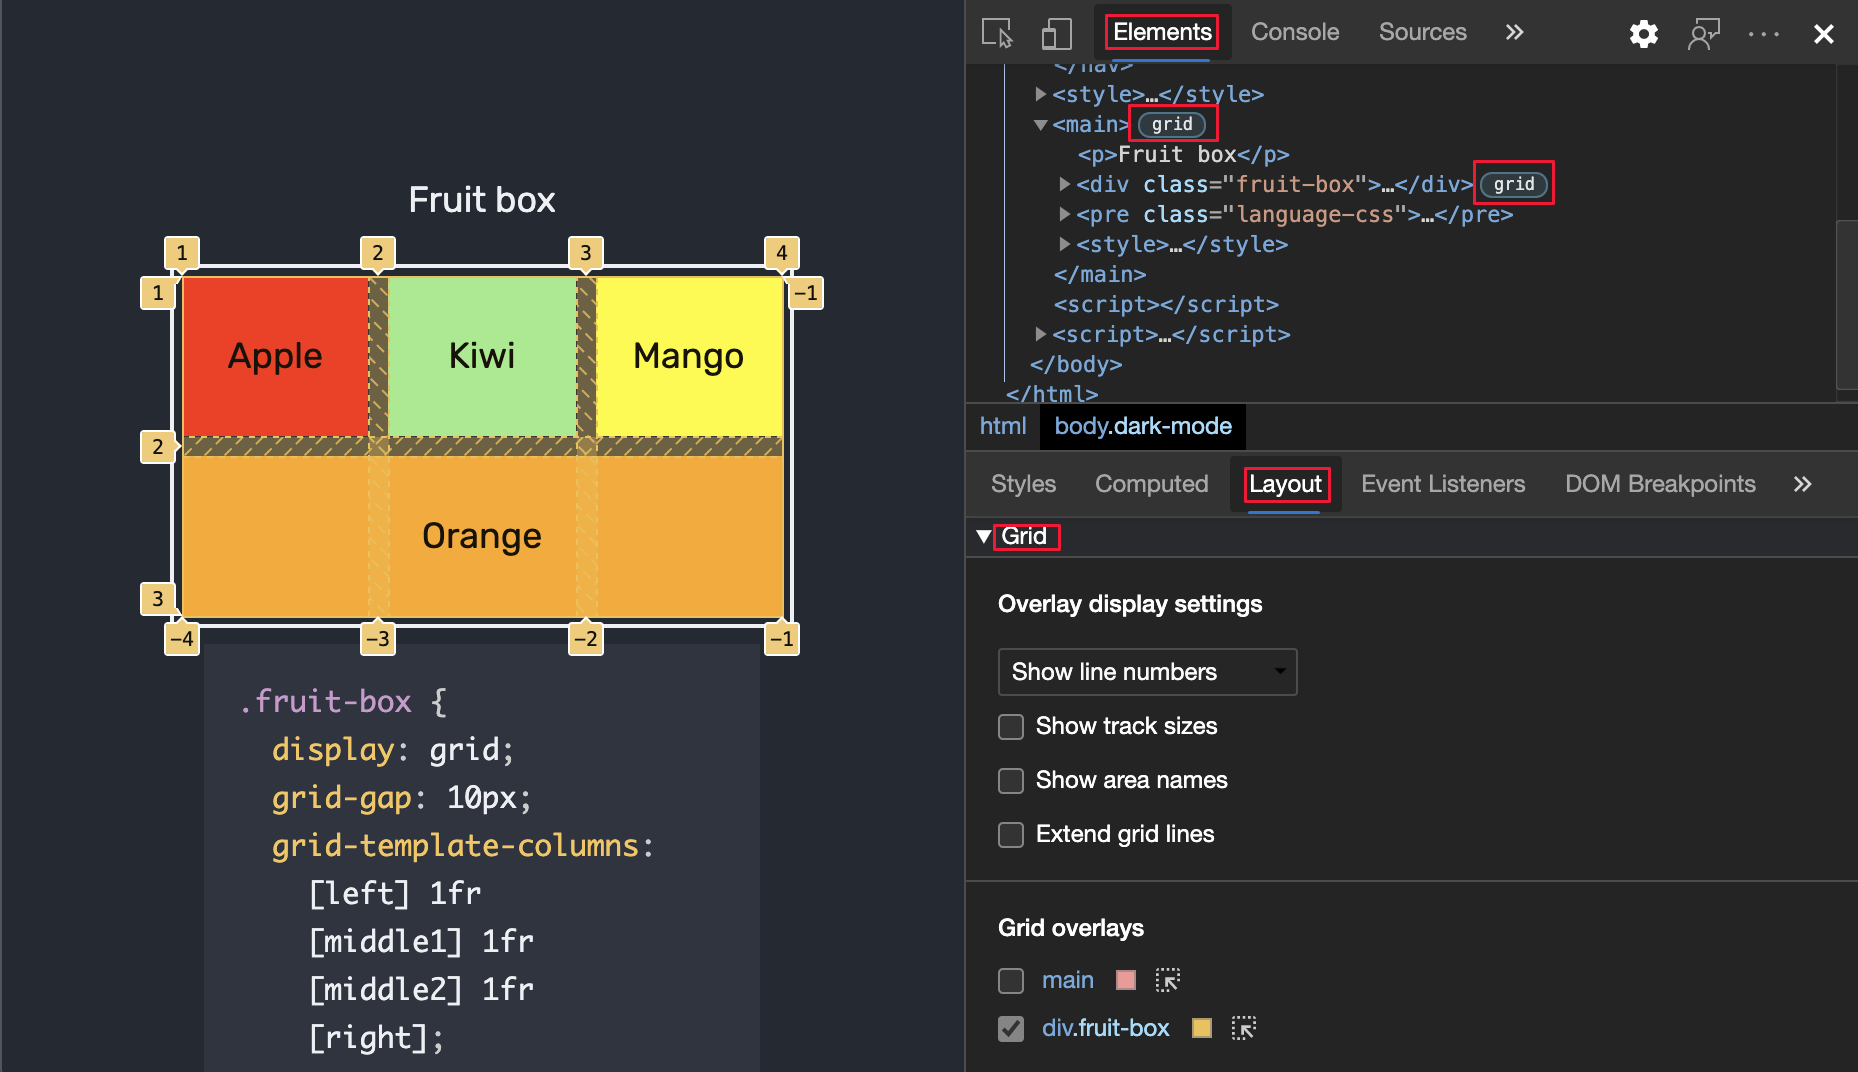
Improved CSS Grid tooling
The Microsoft Edge DevTools now support the following features for inspecting, viewing, and debugging your CSS grids.
Display a simplified grid overlay using the Inspect tool, or get more detailed information with persistent overlays.
To enable persistent grid overlays, click the grid icon next to a grid container element in the Elements tool, or click the grid in the Layout tool.
You can enable persistent overlays for multiple grids.
The new Layout tool allows you to easily toggle grid overlays and configure the appearance and the content for each.
The features are turned on by default.
Update: This feature has been released and is no longer experimental.
See also:
For history, in the Chromium open-source project, see Issue #1047356.
The Microsoft Edge DevTools team is collaborating with the Chrome DevTools team and Chromium community to add new flexbox tooling features to DevTools. For updates on flexbox tooling in the Chromium open-source project, see Issue #1136394.
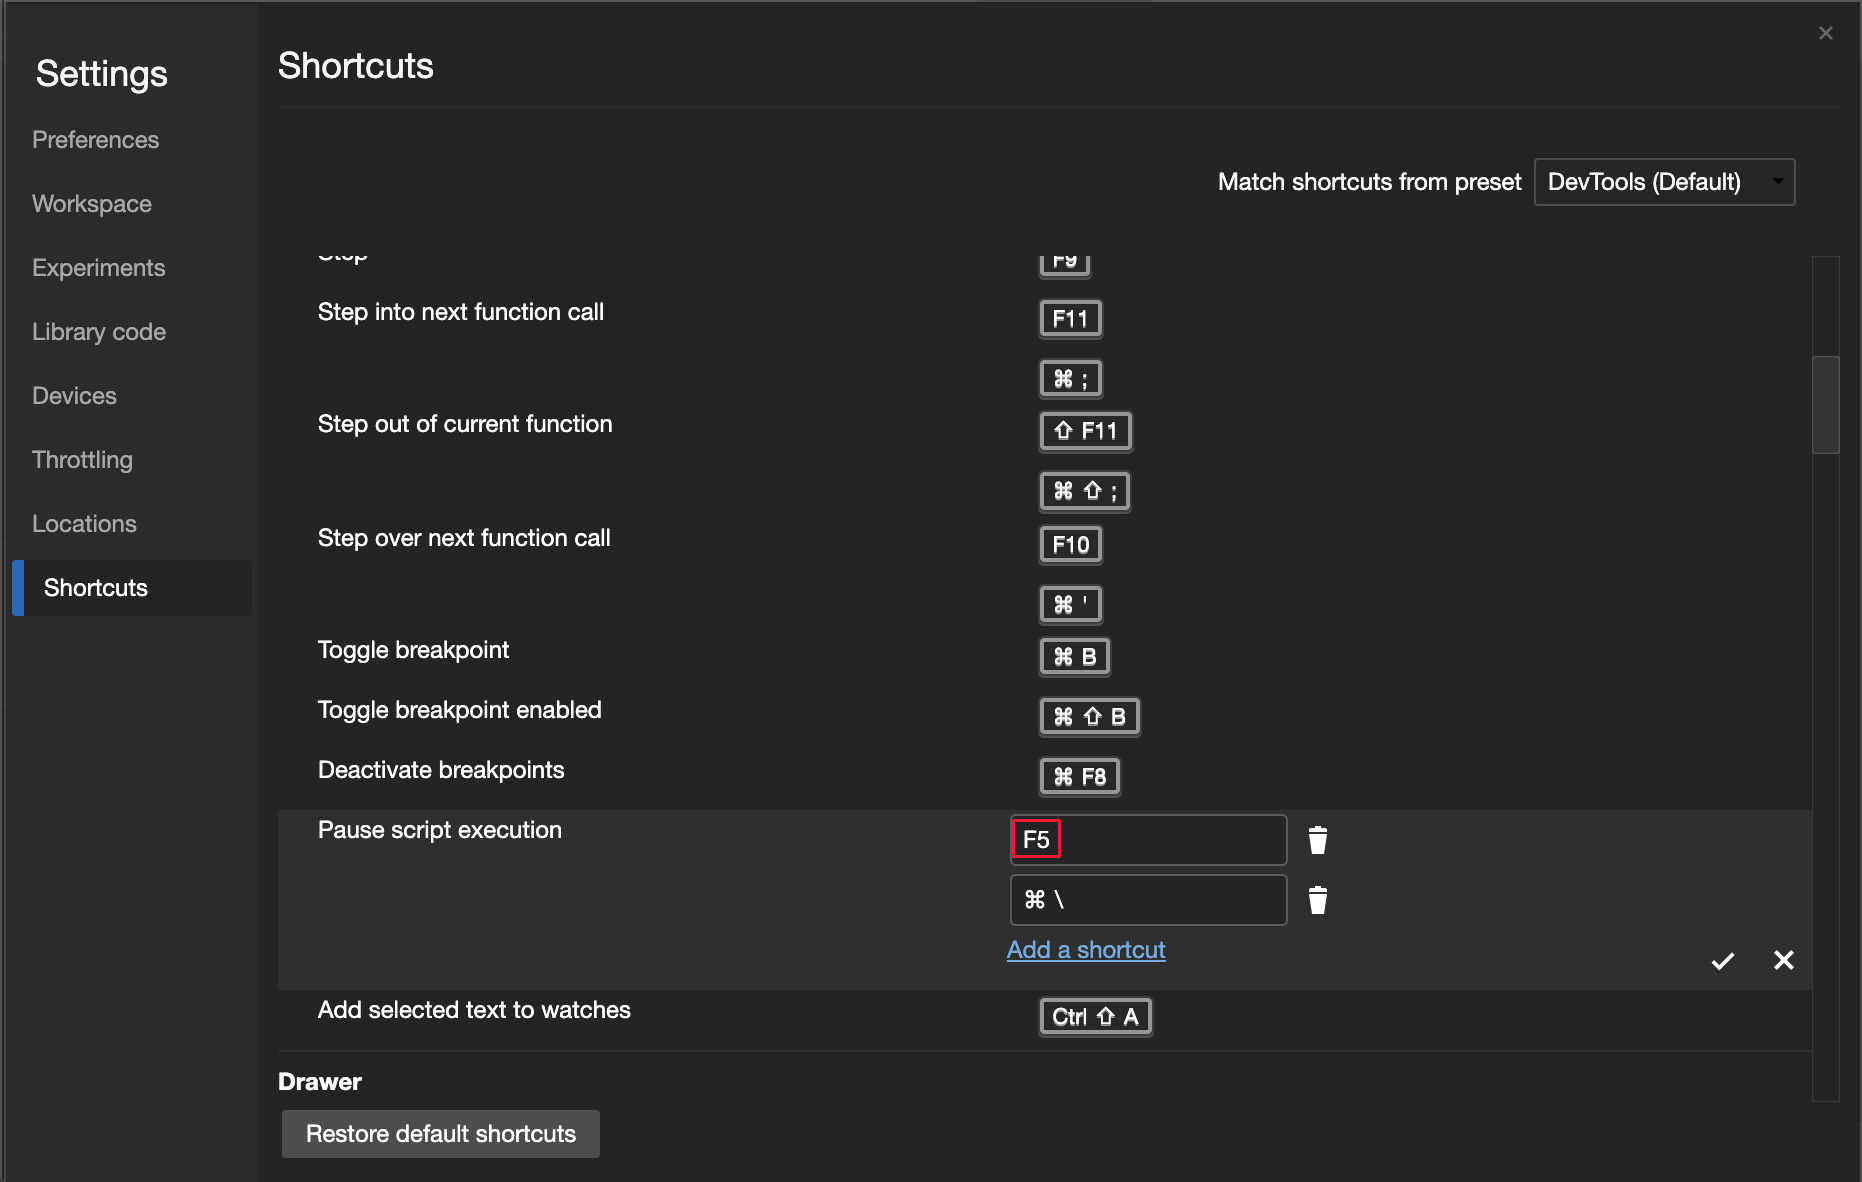
Customize keyboard shortcuts in Settings
You can now customize the keyboard shortcut for any action in the DevTools. Since Microsoft Edge version 84, you can choose between Visual Studio Code and DevTools (default) presets for keyboard shortcuts. Starting in Microsoft Edge version 87, you can further customize keyboard shortcuts.
Update: This feature has been released and is no longer experimental.
See also:
- Edit the keyboard shortcut for a DevTools action in Customize keyboard shortcuts.
For history, in the Chromium open-source project, see Issue #174309.
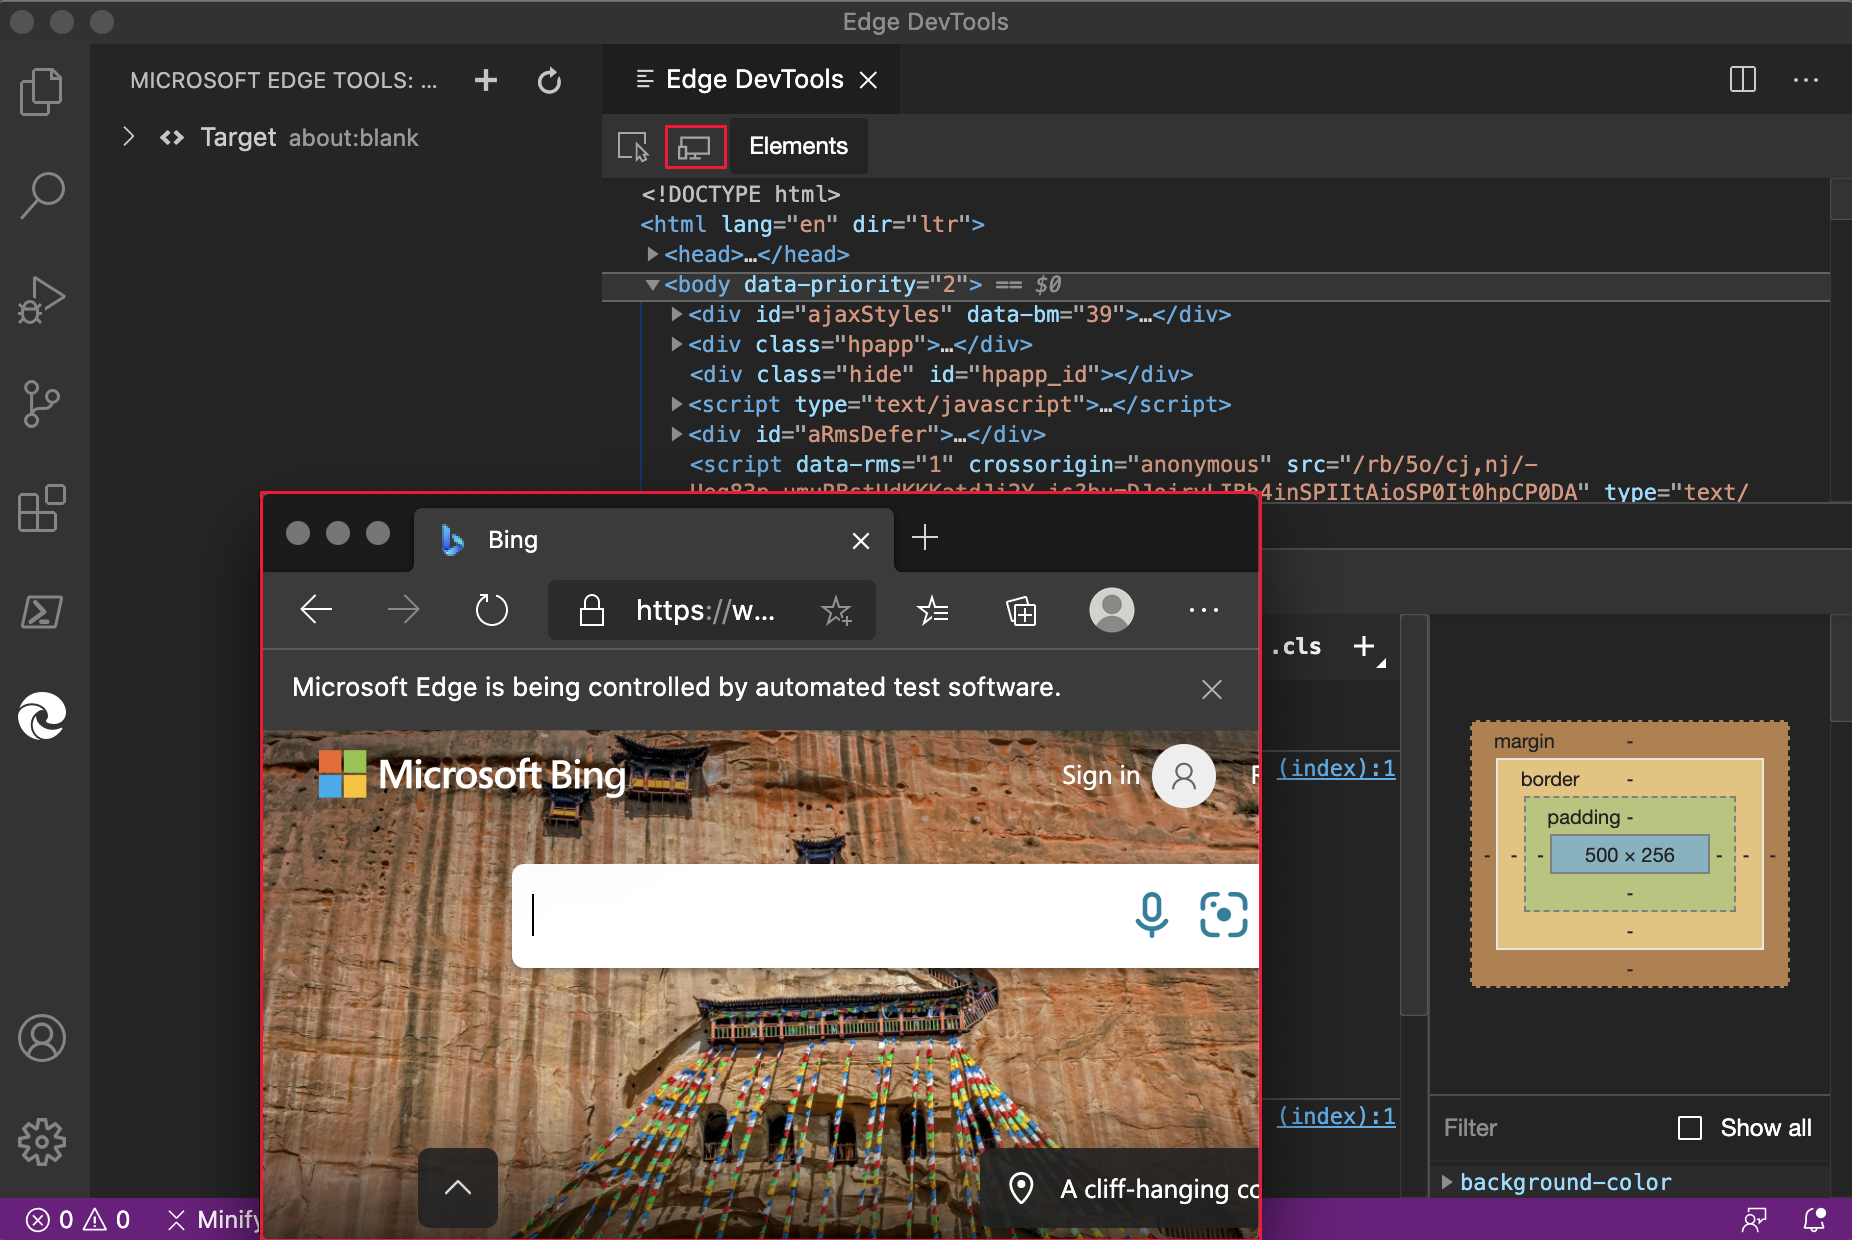
Introducing the Microsoft Edge Tools for Visual Studio Code extension
The Elements for Visual Studio Code and Network for Visual Studio Code extensions are now merged into the new Microsoft Edge Developer Tools for Visual Studio Code extension. Use the Microsoft Edge DevTools for the following activities without leaving Microsoft Visual Studio Code.
- Debug the DOM
- Edit CSS
- Inspect network traffic
With the extension, launch Microsoft Edge, connect to an existing instance of the browser, or use a headless browser directly from your editor. To start contributing and filing issues with your feedback about this extension, see the Microsoft Edge Developer Tools for Visual Studio Code repo on GitHub.
Using the extension in full browser mode:
Using the extension in headless mode:
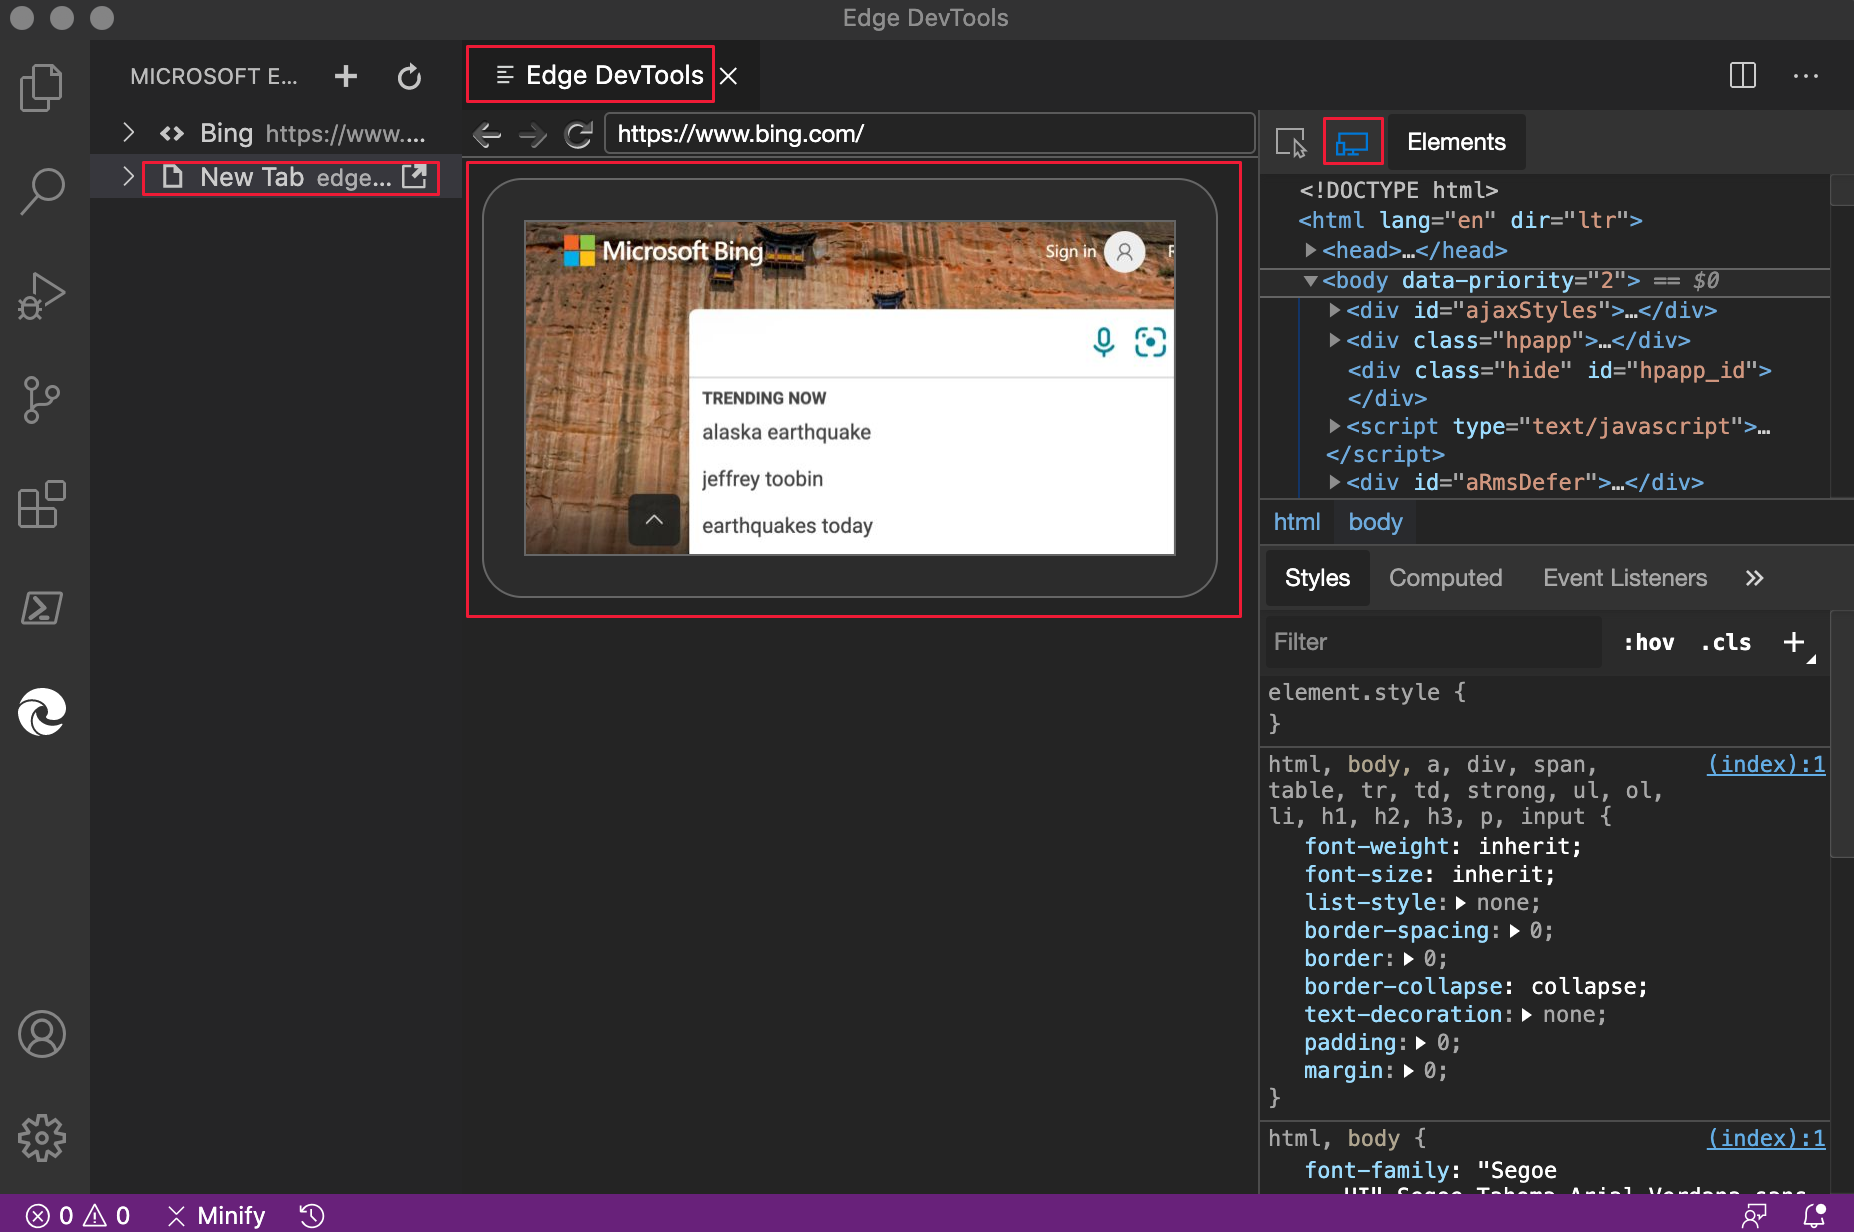
For more information, see Microsoft Edge DevTools extension for Visual Studio Code.
Announcements from the Chromium project
The following sections announce additional features available in Microsoft Edge that were contributed to the open-source Chromium project.
New WebAuthn tool
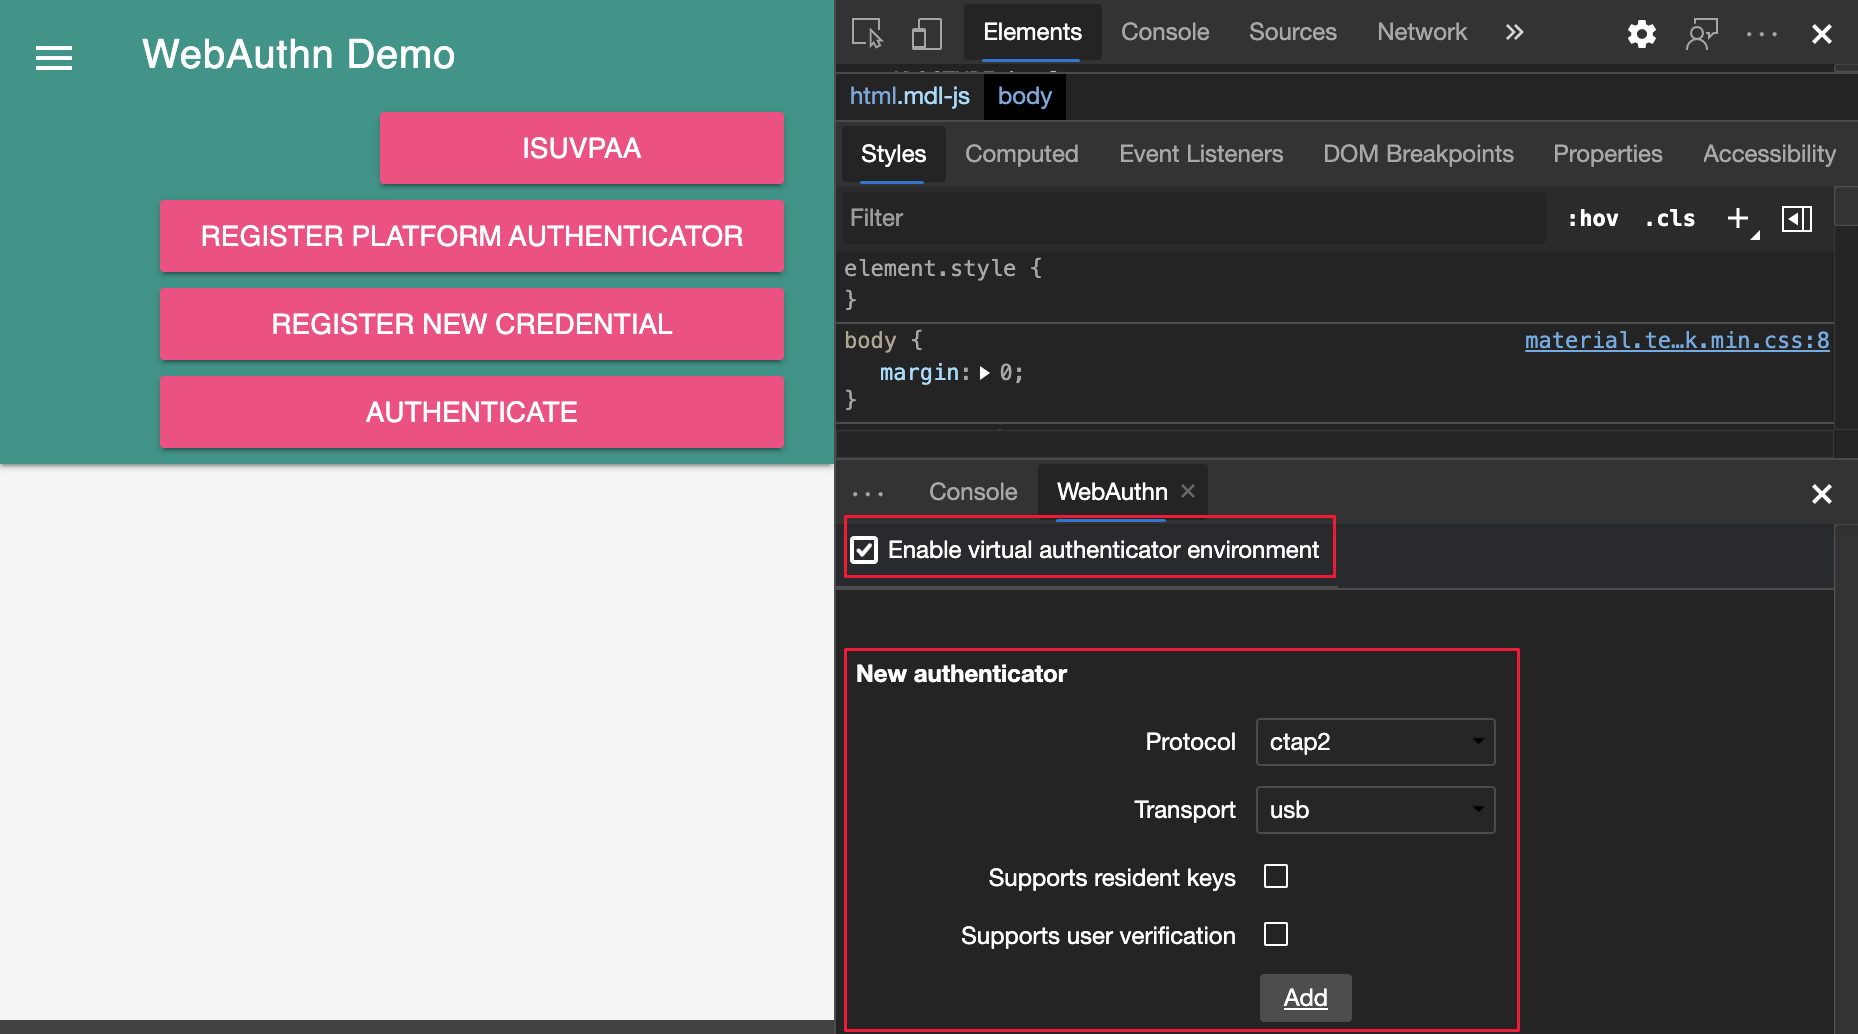
In earlier versions of Microsoft Edge, there was no native WebAuthn debugging support. You needed physical authenticators to test your web application with the Web Authentication API. With the new WebAuthn tool, you can do the following without the use of any physical authenticators:
- Emulate authenticators.
- Customize attributes of authenticators.
- Inspect states of authenticators.
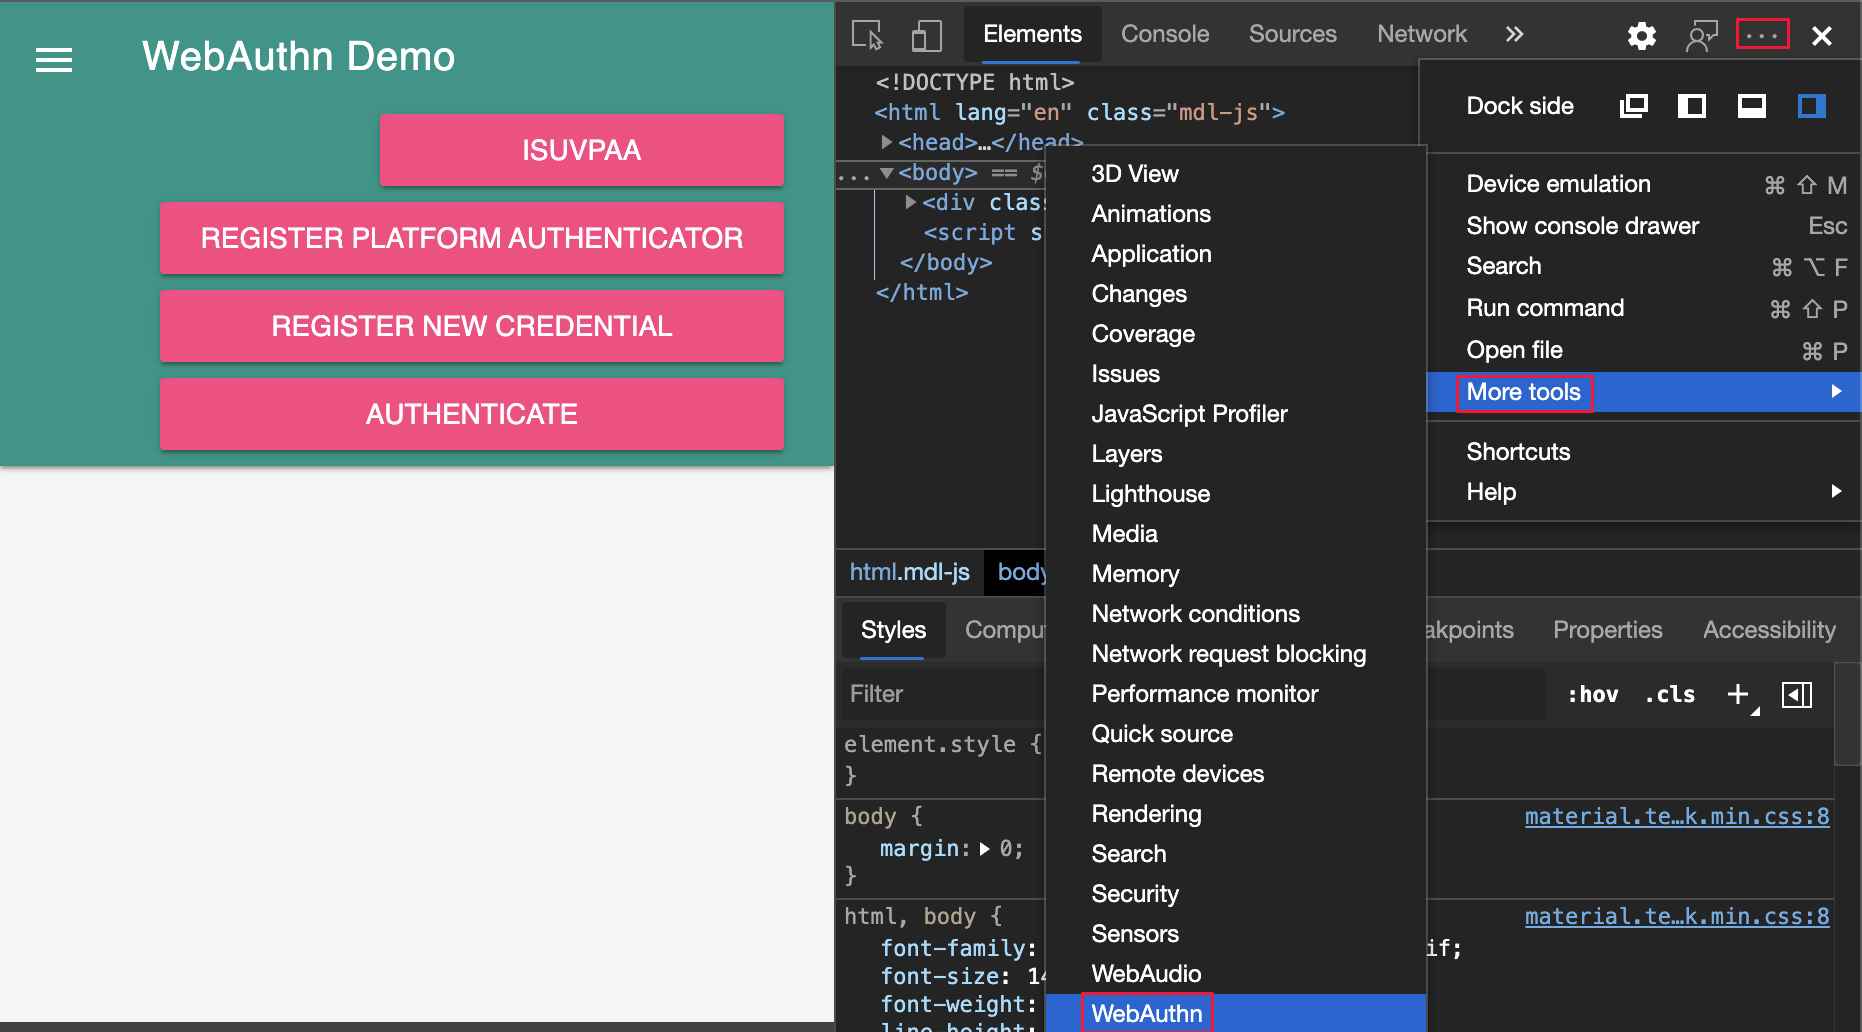
You can emulate authenticators and debug the Web Authentication API with the new WebAuthn tool. To open the WebAuthn tool, click the Customize and control DevTools (...) icon > More tools > WebAuthn. For real-time updates on this feature in the Chromium open-source project, see Issue #1034663.
Opening the WebAuthn tool:
The WebAuthn tool:
For more information, see Emulate authenticators and debug WebAuthn.
Elements tool updates
See also:
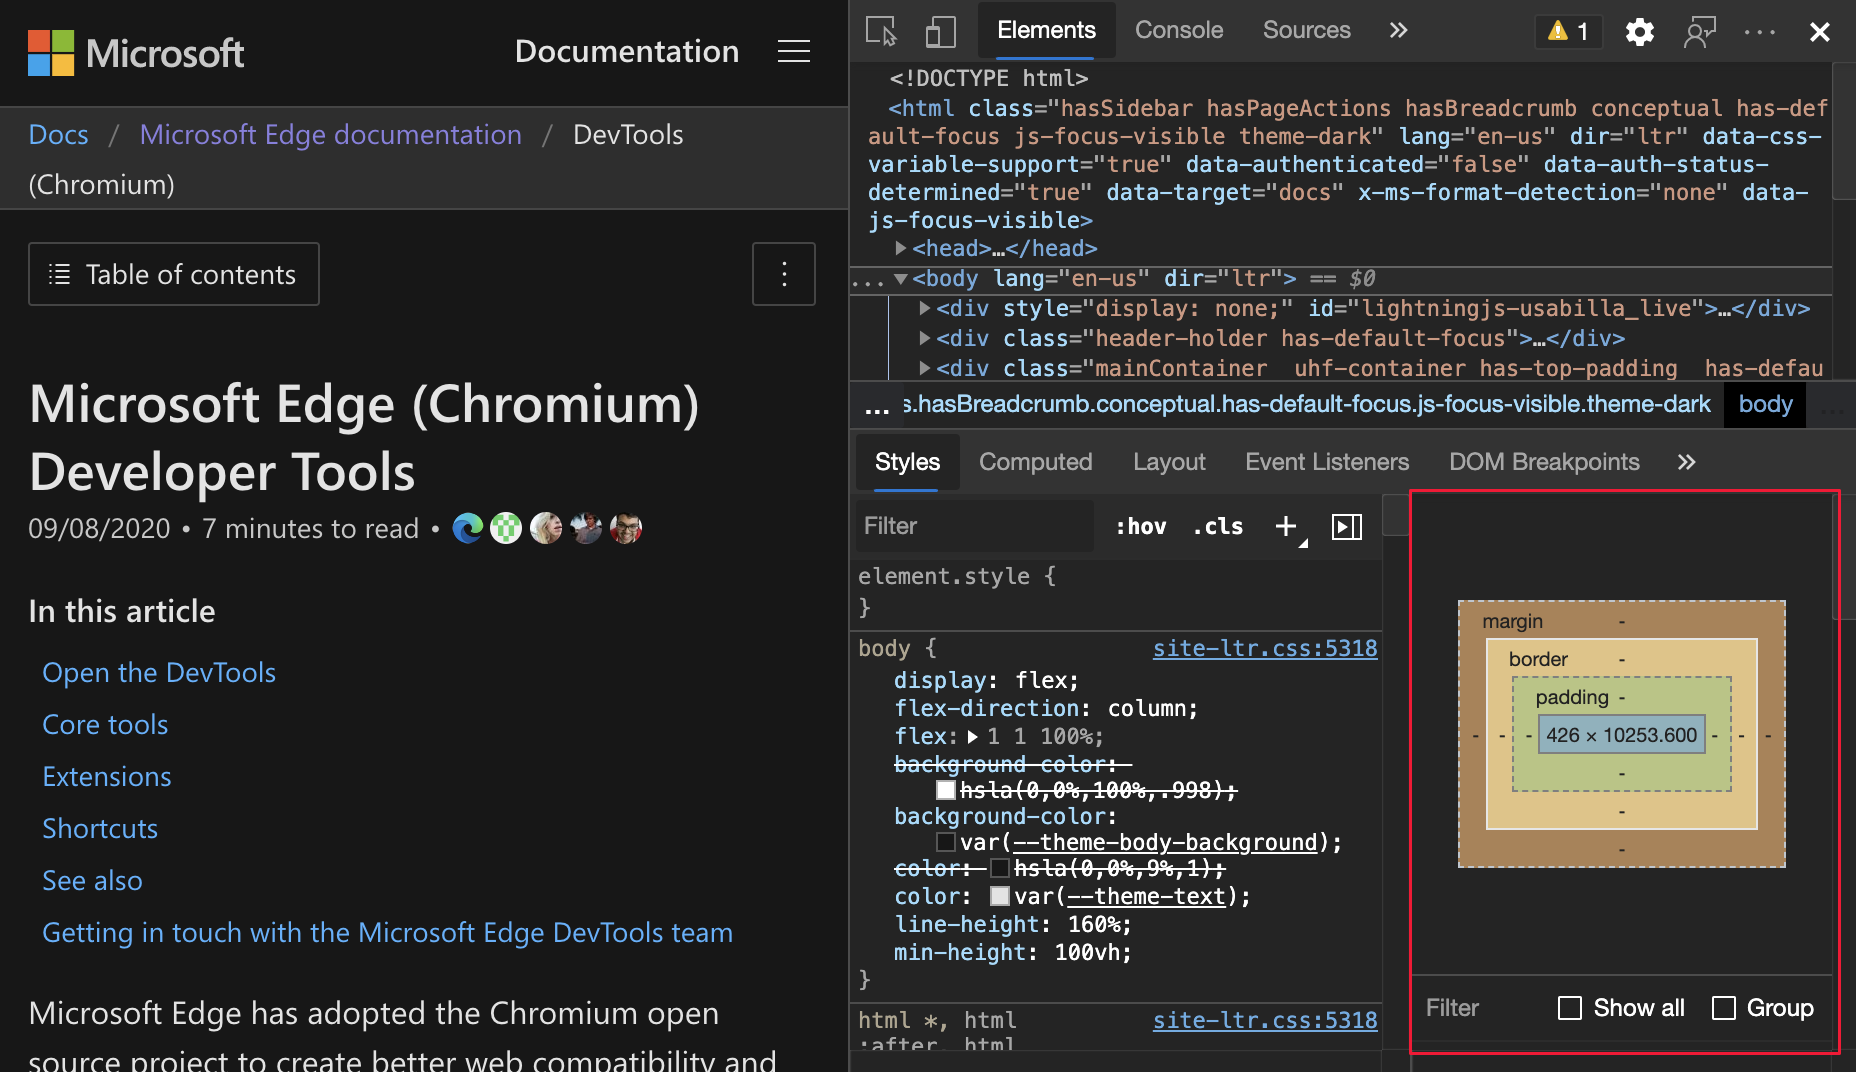
View the Computed sidebar pane in the Styles pane
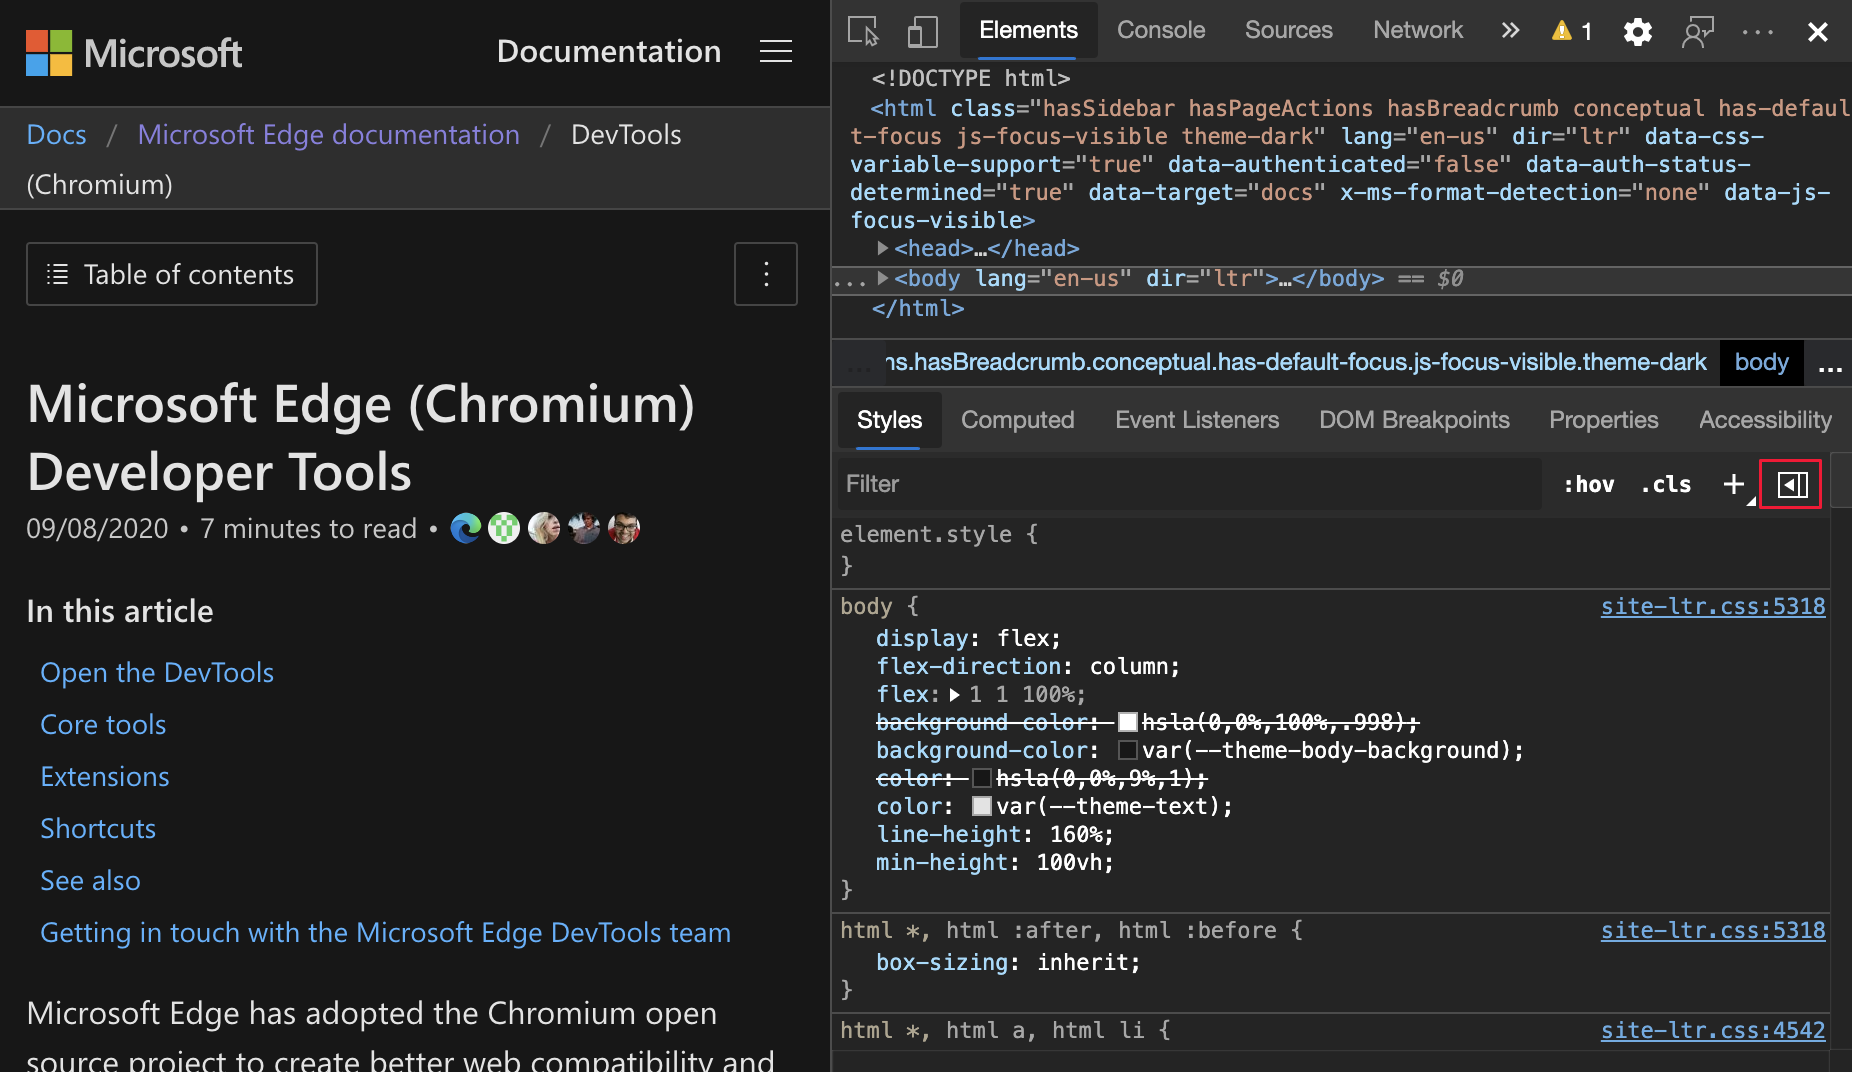
Toggle the Computed pane in the Styles pane. The Computed pane in the Styles pane is collapsed by default. To display or hide the Computed pane within the Styles pane, click the Show Computed Styles sidebar (![]() ) button.
) button.
Opening the Computed sidebar pane:
The Computed sidebar pane:
For real-time updates on this feature in the Chromium open-source project, see Issue #1073899.
See also:
- View only the CSS that is actually applied to an element in CSS features reference
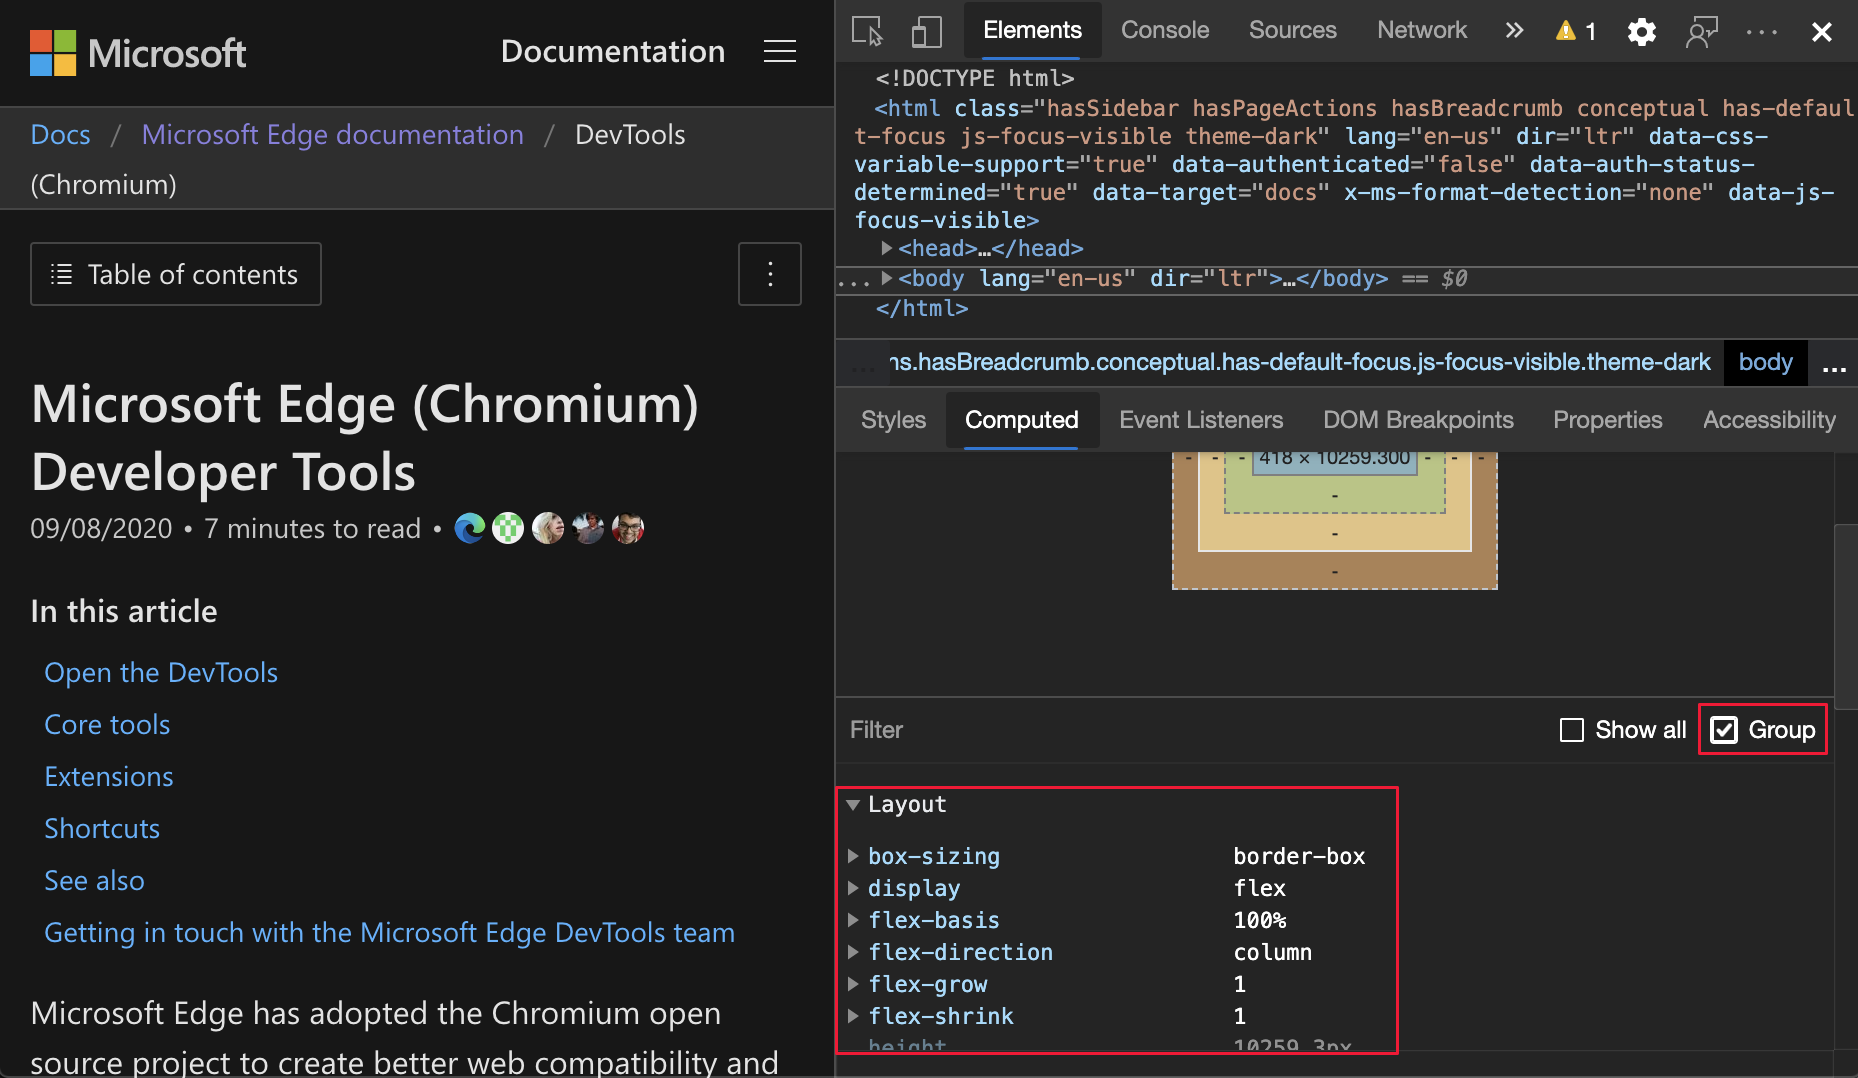
Grouping CSS properties in the Computed pane
To view your applied CSS with less scrolling, group the CSS properties by categories in the Computed pane. You can also selectively focus on a set of related properties while you inspect your CSS. From the Elements tool, select an element. To group (or ungroup) the CSS properties, toggle the Group checkbox.
For real-time updates on this feature in the Chromium open-source project, see Issues #1096230, #1084673, and #1106251.
See also:
- View only the CSS that is actually applied to an element in CSS features reference
Lighthouse 6.4 in the Lighthouse tool
The Lighthouse tool is now running Lighthouse 6.4. For a full list of changes, see the Lighthouse release notes. For real-time updates on this feature in the Chromium open-source project, see Issue #772558.
See also:
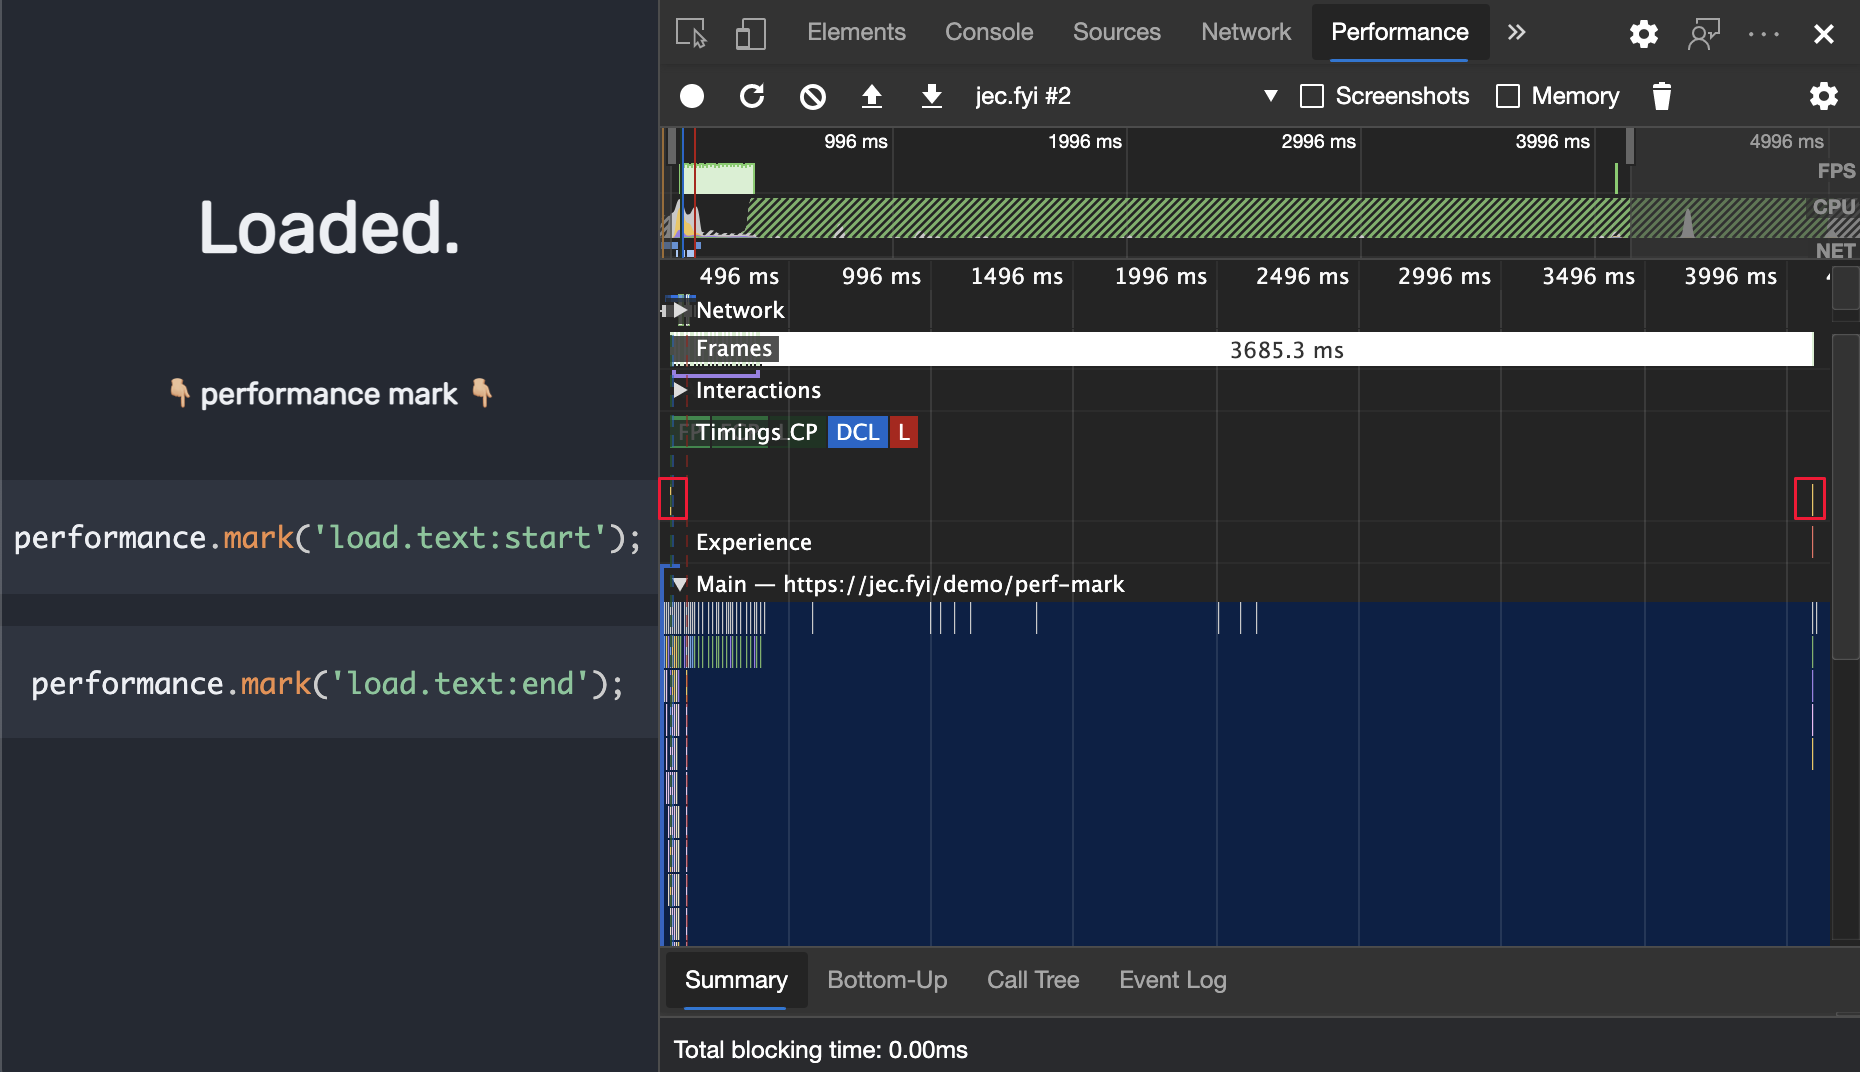
performance.mark() events in the Timings section
The Timings section of a recording in the Performance tool now marks performance.mark() events. To try this feature and measure the performance of your JavaScript code, add performance.mark() events to your code.
The following code adds start and end performance markers before and after a for loop:
performance.mark('start');
for (var i = 0; i < 1000; i+=7;){
  console.log(i);
}
performance.mark('end');
Then, open the Performance tool and see the Timings section to record your JavaScript code. The performance.mark() events you added are now displayed in the recording.
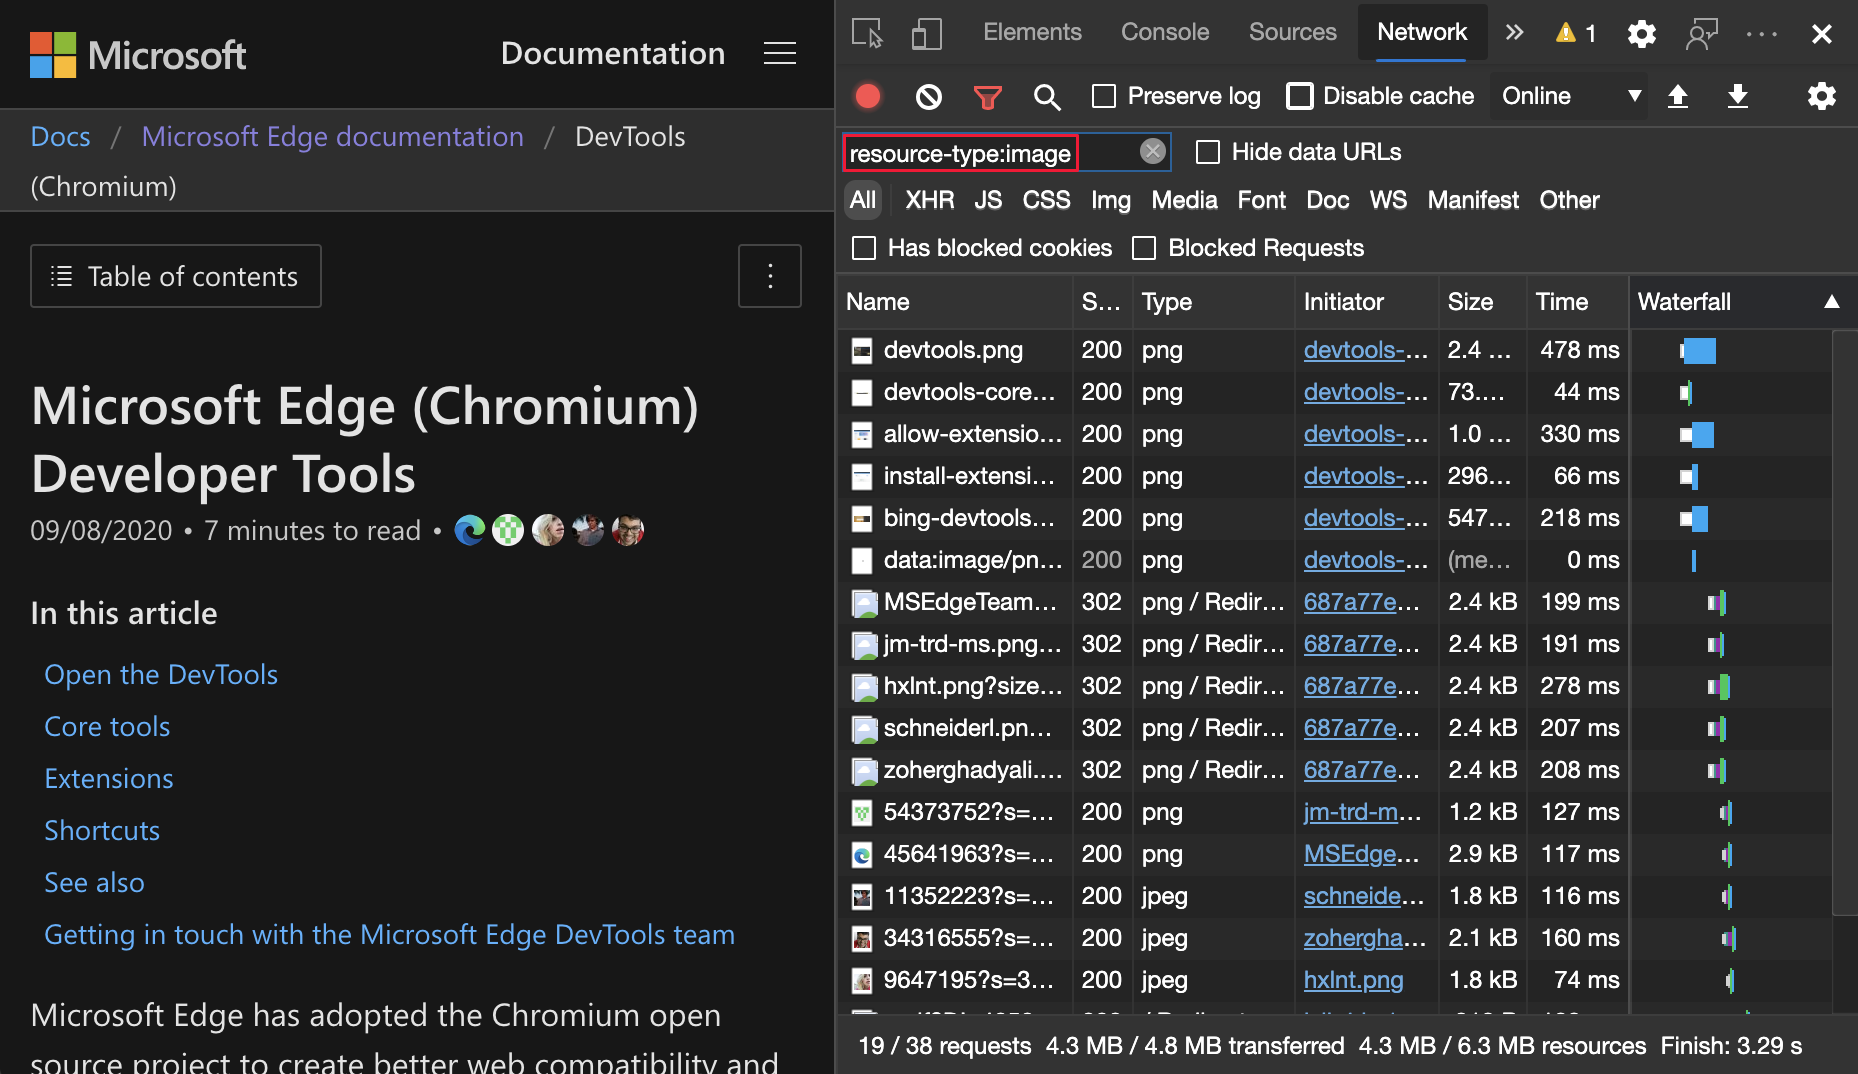
New resource-type and url filters in the Network tool
Use the new resource-type and url keywords in the Network tool to filter network requests. For example, use resource-type:image to focus on the network requests that are images:
To discover more special keywords such as resource-type and url, see filter requests by properties.
For real-time updates on this feature in the Chromium open-source project, see Issues #1121141 and #1104188.
Frame details view updates
In the Application tool, in the list of pages on the left, the bottom page is Frames, which often lists a frame named top.
Display COEP and COOP reporting to endpoint
In the Application tool, in the list of pages on the left, the bottom page is Frames, which often lists a frame named top. Select the frame to view the frame detail view, which includes the Security & Isolation section.
In the Security & Isolation section of the frame detail page, view the Cross-Origin Embedder Policy (COEP) and Cross-Origin Opener Policy (COOP) reporting to endpoint. The Reporting API defines Report-To, which is a new HTTP header that gives you a way to specify the server endpoints for the browser to send warnings and errors.
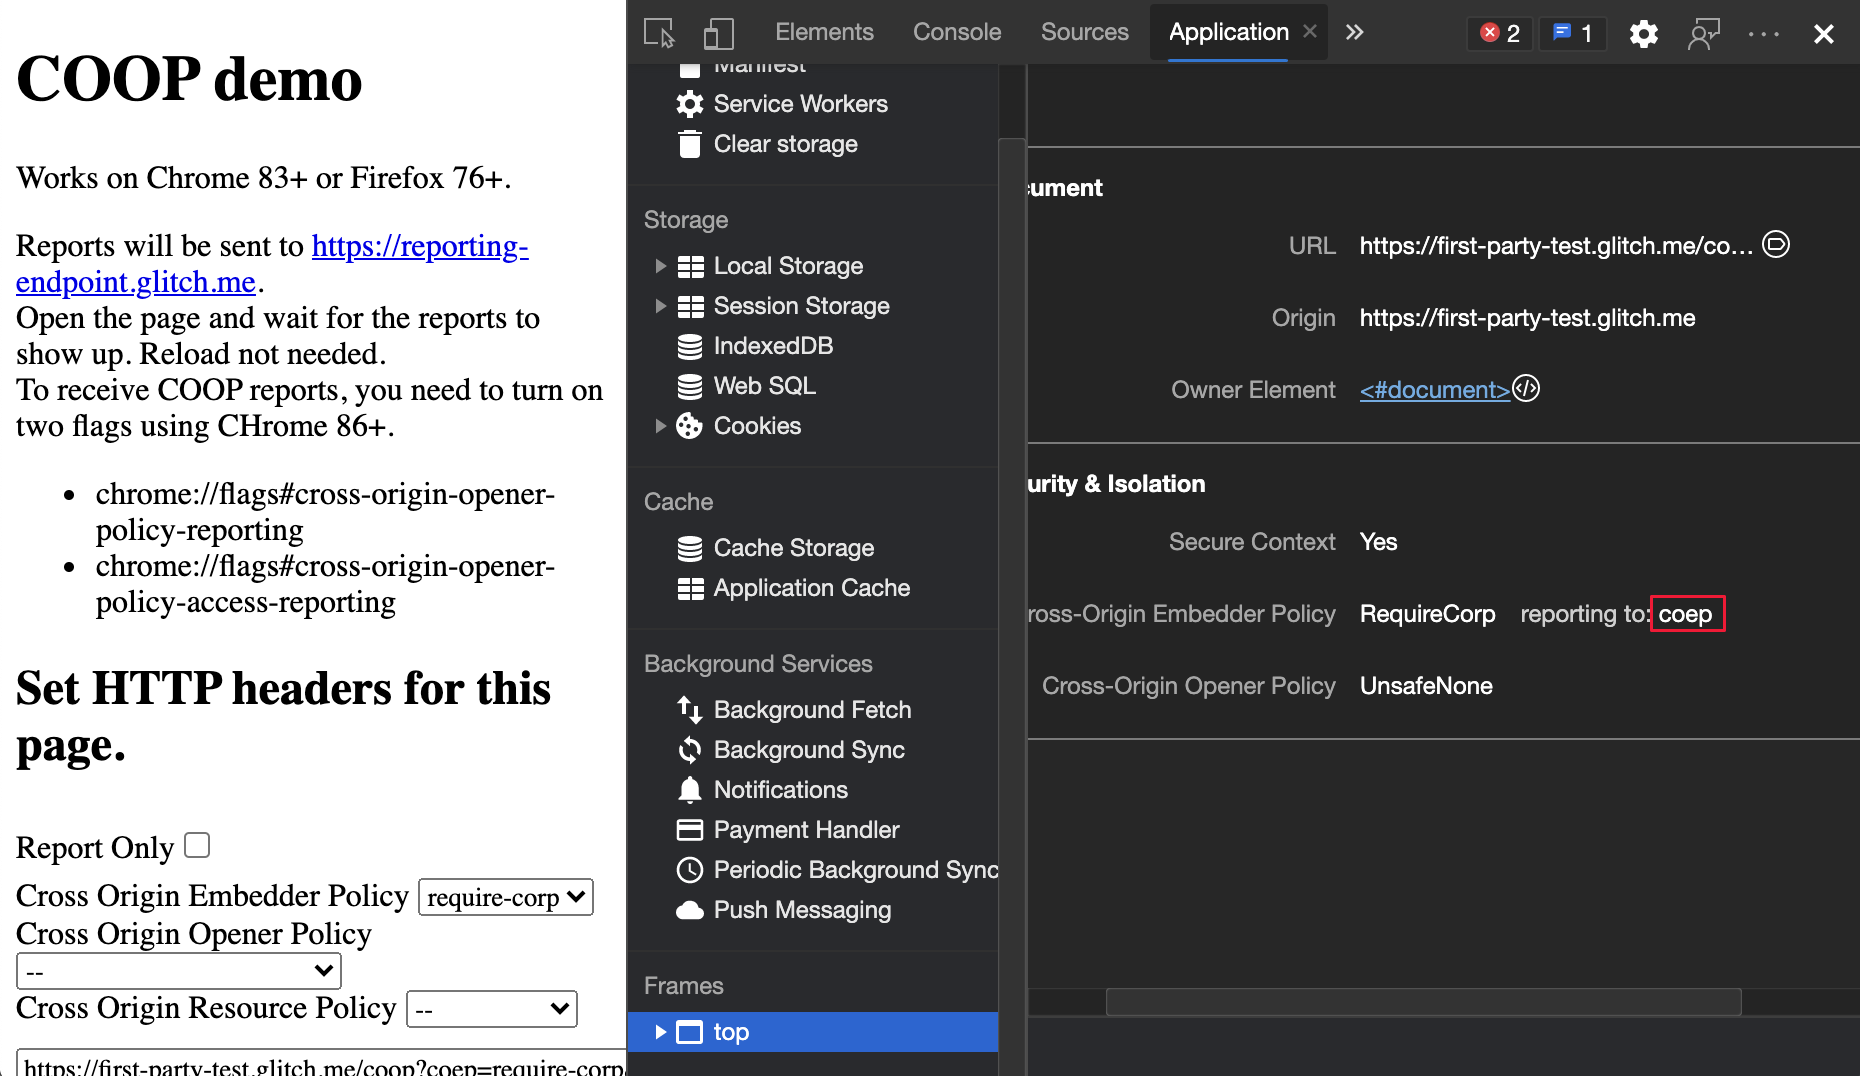
For real-time updates on this feature in the Chromium open-source project, see Issue #1051466.
See also:
- Display opener frame details for opened windows in What's New in DevTools (Microsoft Edge 88)
- The Application tool, to manage storage
Display COEP and COOP report-only mode
In the Application tool, in the list of pages on the left, the bottom page is Frames, which often lists a frame named top. Select the frame to view the frame detail view, which includes the Security & Isolation section.
The Security & Isolation section of the frame detail page now displays the report-only label for COEP and COOP that are set to report-only mode.
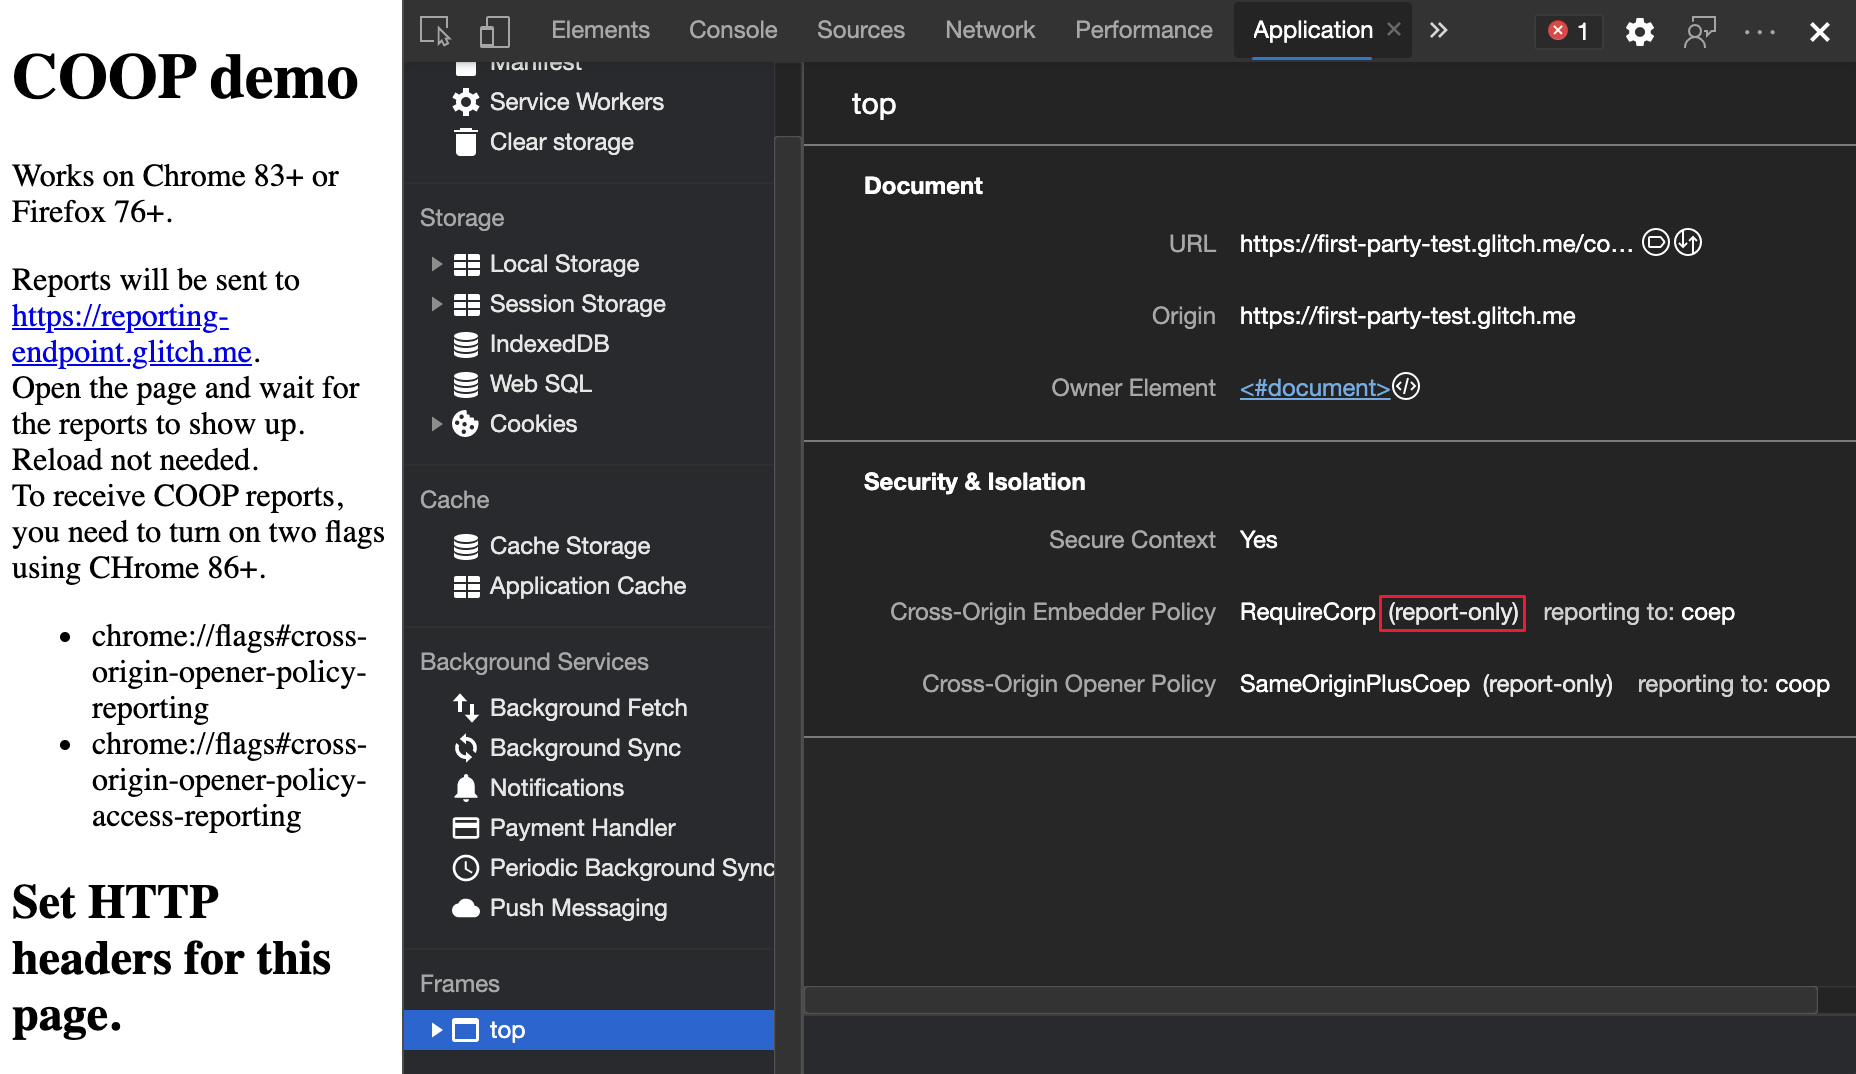
For real-time updates on this feature in the Chromium open-source project, see Issue #1051466.
See also:
- Display opener frame details for opened windows in What's New in DevTools (Microsoft Edge 88)
- The Application tool, to manage storage
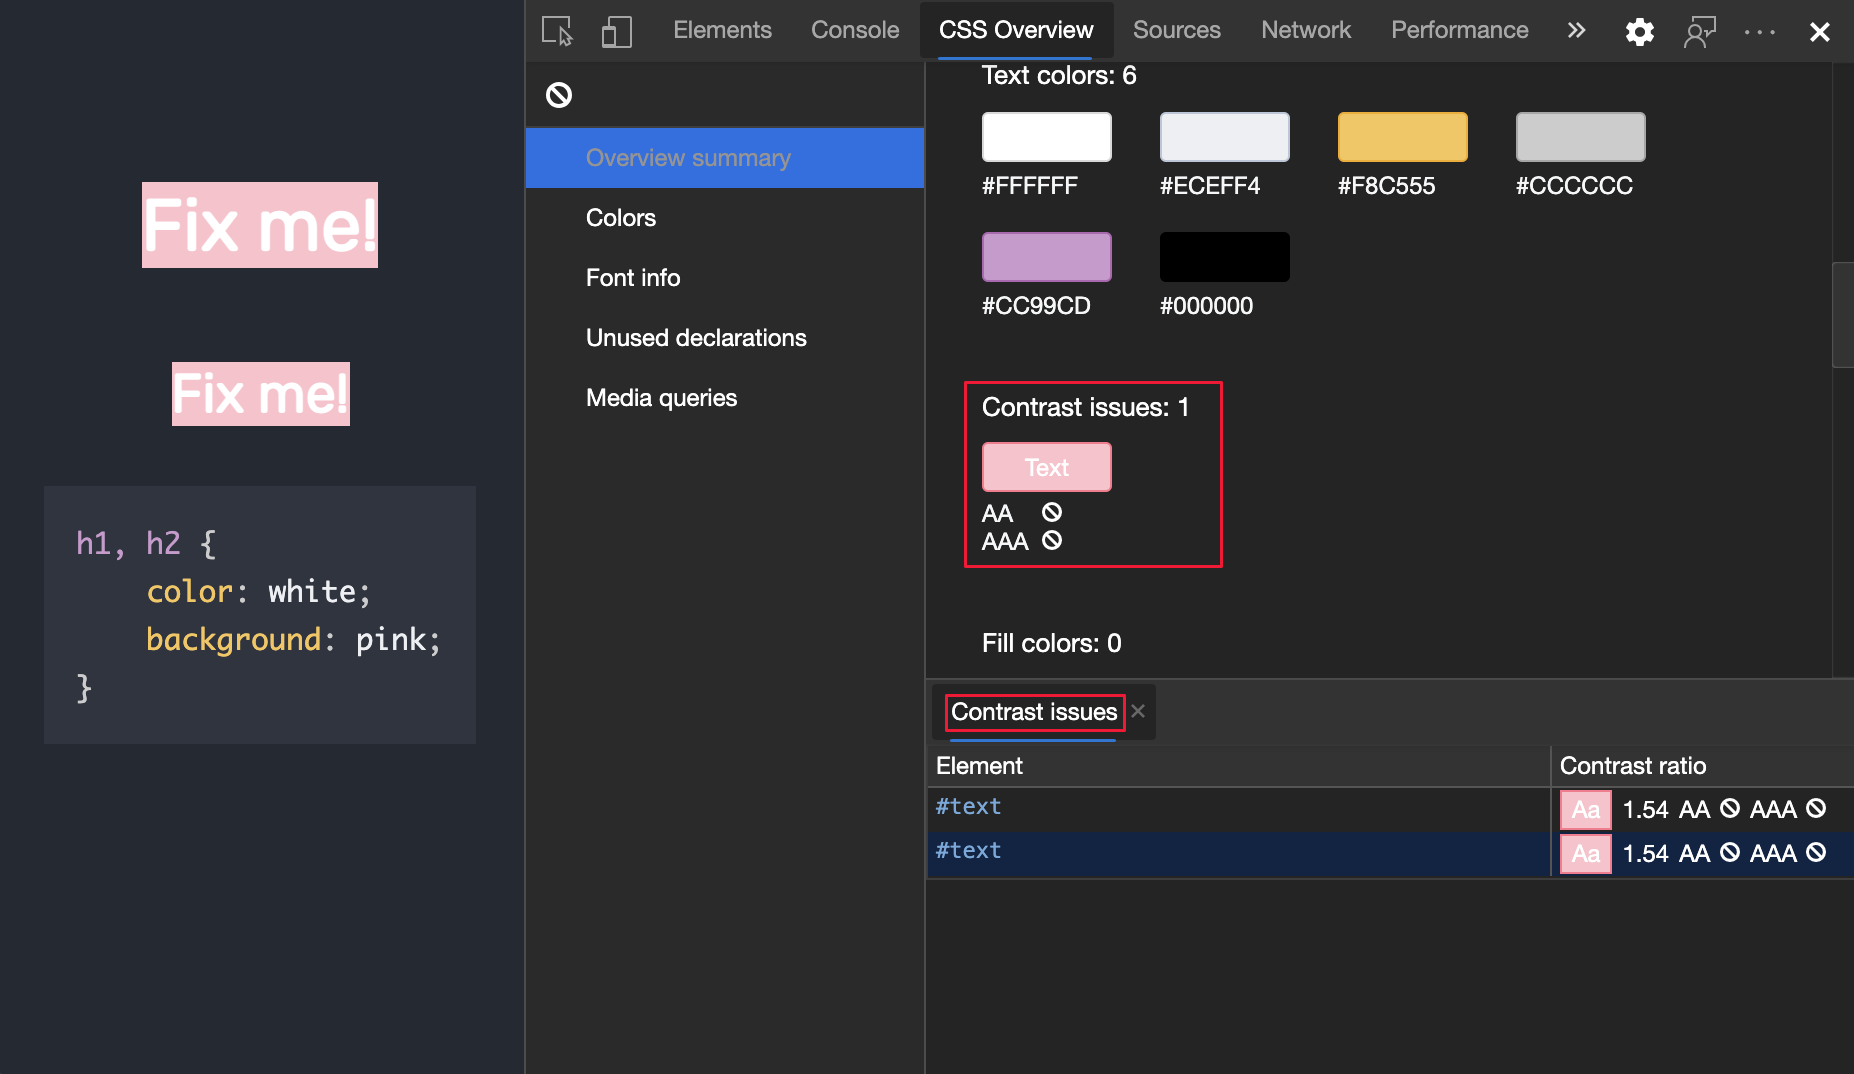
View and fix color contrast issues in the CSS Overview tool
The CSS Overview tool now displays a list of elements on your page that have color contrast issues. The CSS Overview Accessible Colors Demo page has an example of a color contrast issue.
To view a list of elements that have a color contrast issue, on Contrast issues, click Text. To open the element in the Elements tool, click an element in the list. To help fix contrast issues, the Microsoft Edge DevTools automatically provide color suggestions.
Update: This feature has been released and is no longer experimental.
See also:
For history, in the Chromium open-source project, see Issue #1120316.
Note
Portions of this page are modifications based on work created and shared by Google and used according to terms described in the Creative Commons Attribution 4.0 International License. The original page is found here and is authored by Jecelyn Yeen.
![]() This work is licensed under a Creative Commons Attribution 4.0 International License.
This work is licensed under a Creative Commons Attribution 4.0 International License.