Note
Access to this page requires authorization. You can try signing in or changing directories.
Access to this page requires authorization. You can try changing directories.
These are the latest features in the Stable release of Microsoft Edge DevTools.
Video: Microsoft Edge | What's New in DevTools 99
Securely debug your production code with source maps from Azure Artifacts Symbol Server
Azure Artifacts Symbol Server now supports storing the source maps that your build process produces when compiling, minifying, and bundling your code. Instead of hosting source maps on your public server, you can now publish your source maps to the secure Azure Artifacts Symbol Server. Then, connect DevTools to Symbol Server to have DevTools automatically fetch your source maps.
By using source maps, you can see and debug your original source code in DevTools, rather than having to work with the compiled, minified, and bundled production code that's returned by your server. Hosting your source maps on the Azure Artifacts Symbol Server allows you to see and work with your source code securely and privately, instead of placing your source maps on your server and revealing your original code publicly.
To try this feature:
- Publish your source maps to the Azure Artifacts symbol server.
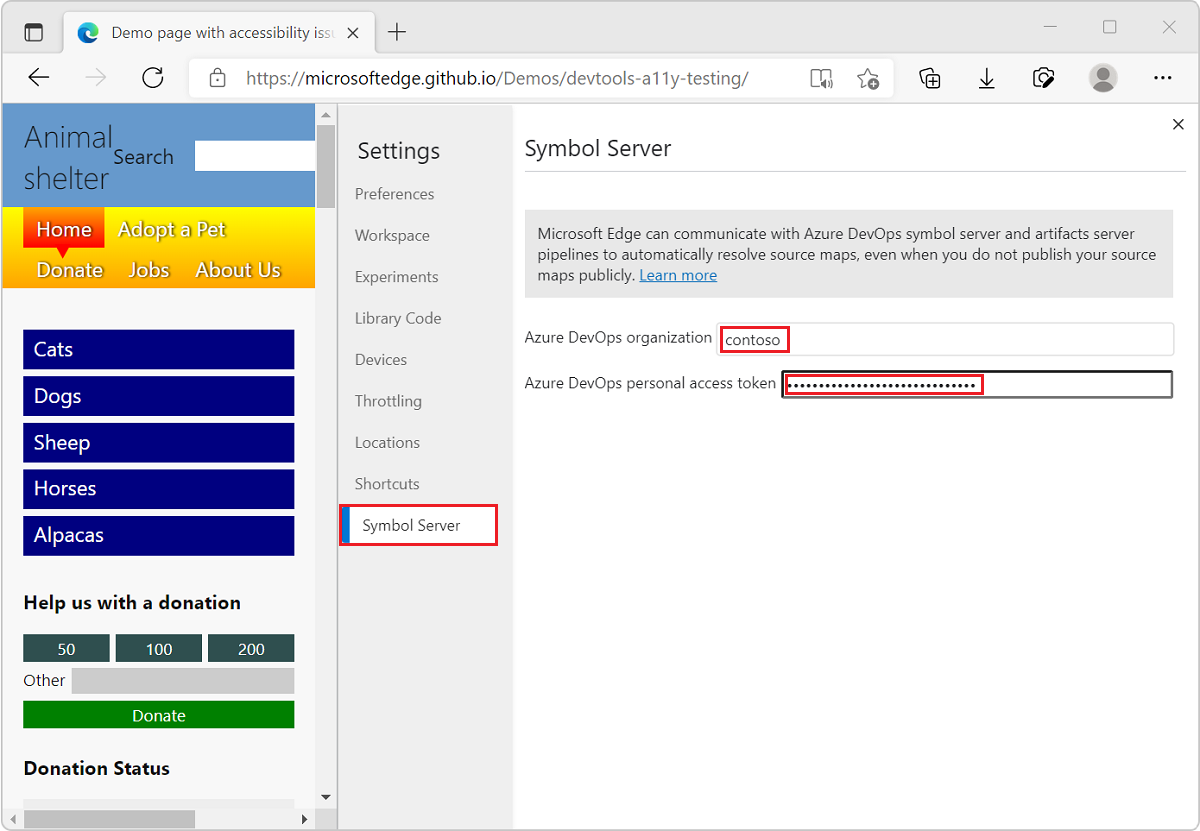
- Open DevTools > Settings > Symbol Server and connect DevTools to Azure Artifacts Symbol Server, by entering your Azure DevOps organization and personal access token.
See also:
- Map the processed code to your original source code, for debugging
- Securely debug original code by publishing source maps to the Azure Artifacts symbol server
- Securely debug original code by using Azure Artifacts symbol server source maps
Microsoft Edge DevTools extension for Visual Studio
Following up on the success of the Visual Studio Code integration, you can now also embed the Microsoft Edge Developer Tools in Microsoft Visual Studio to debug your ASP.NET projects live. Download the Microsoft Edge Developer Tools for Visual Studio and try it out.
To try this feature:
- Make sure Visual Studio 2022 and the ASP.NET workload are installed.
- Set up Web Live Preview as the default Web Forms Designer, as described at Microsoft Edge Developer Tools for Visual Studio.
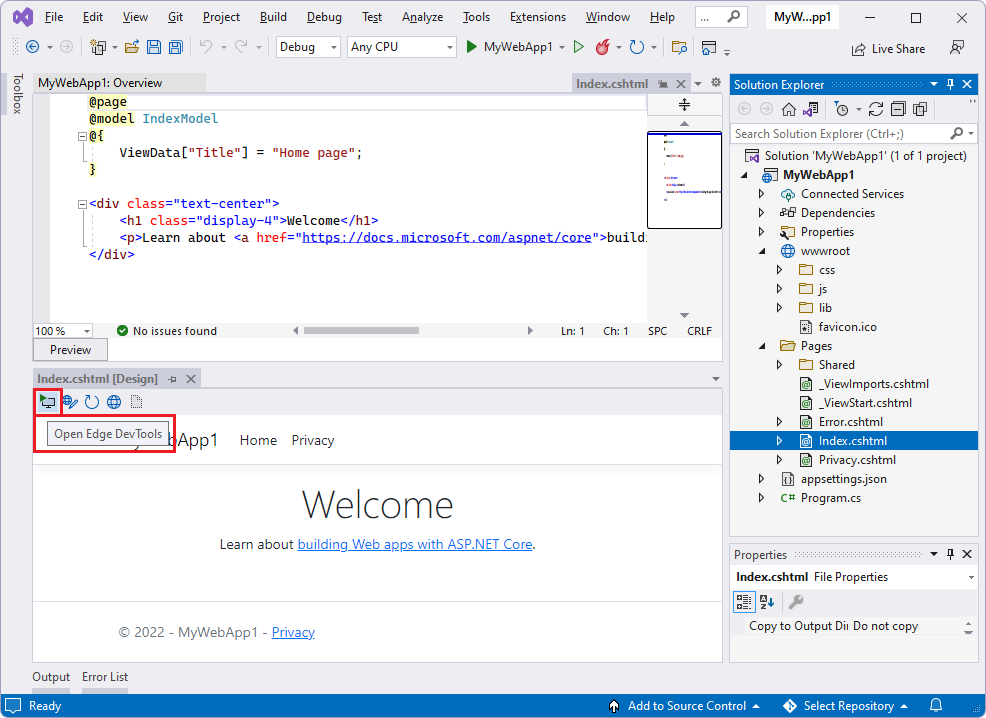
- In an ASP.NET project, open a webpage of the project in the Design window.
- In the upper left of the Design window, click the Open Edge DevTools (
 ) button:
Edge DevTools for Visual Studio opens, with the Elements tool selected:
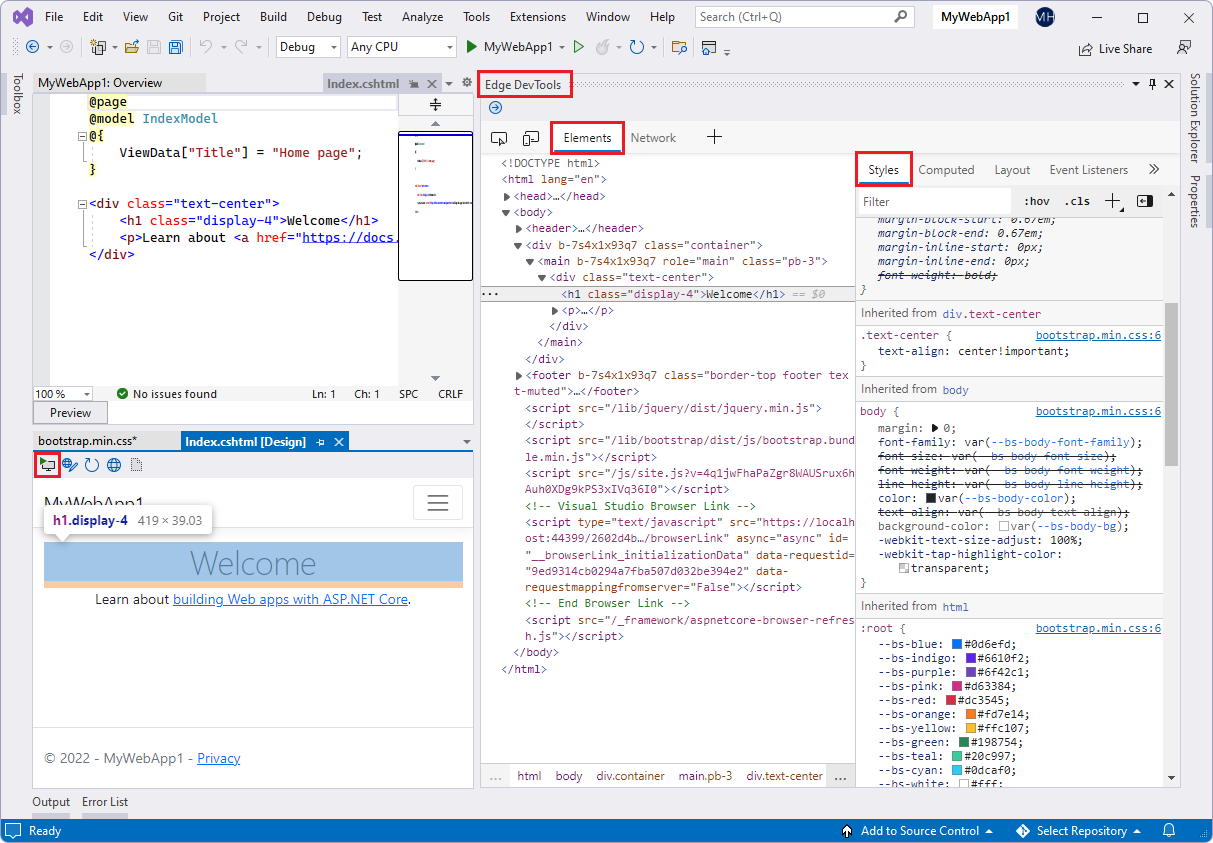
The Network tool is also available by default:
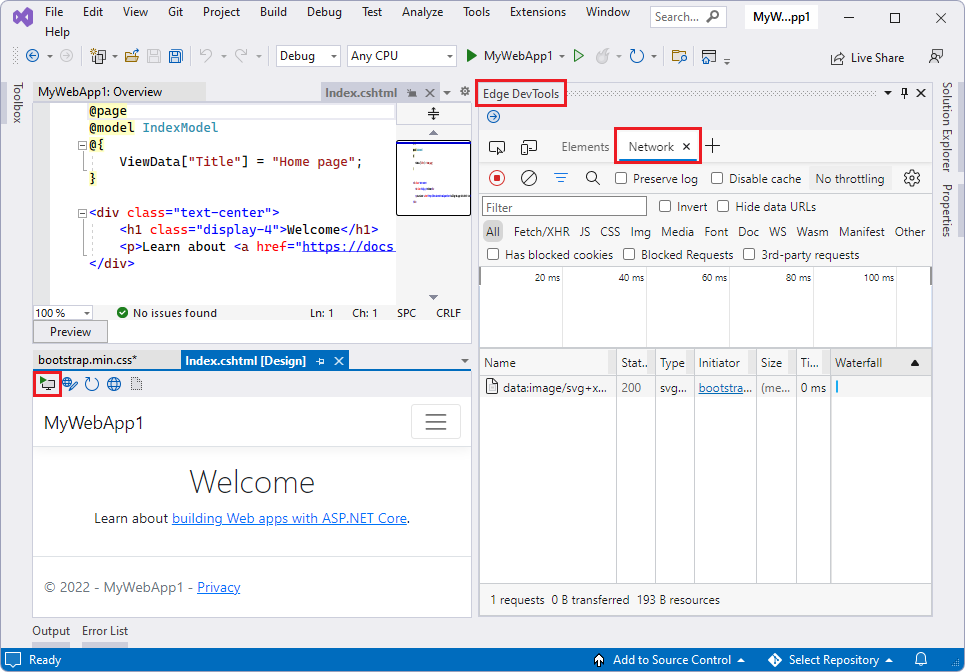
The Inspect tool (![]() ) and Toggle screencast (
) and Toggle screencast (![]() ) are available, and the More Tools (
) are available, and the More Tools (![]() ) menu offers the Issues, Network conditions, and Network request blocking tools.
) menu offers the Issues, Network conditions, and Network request blocking tools.
See also:
- Edge Developer Tools for Visual Studio (Preview), at Visual Studio DevBlogs.
- Edge DevTools extension for Visual Studio.
Layers in 3D View
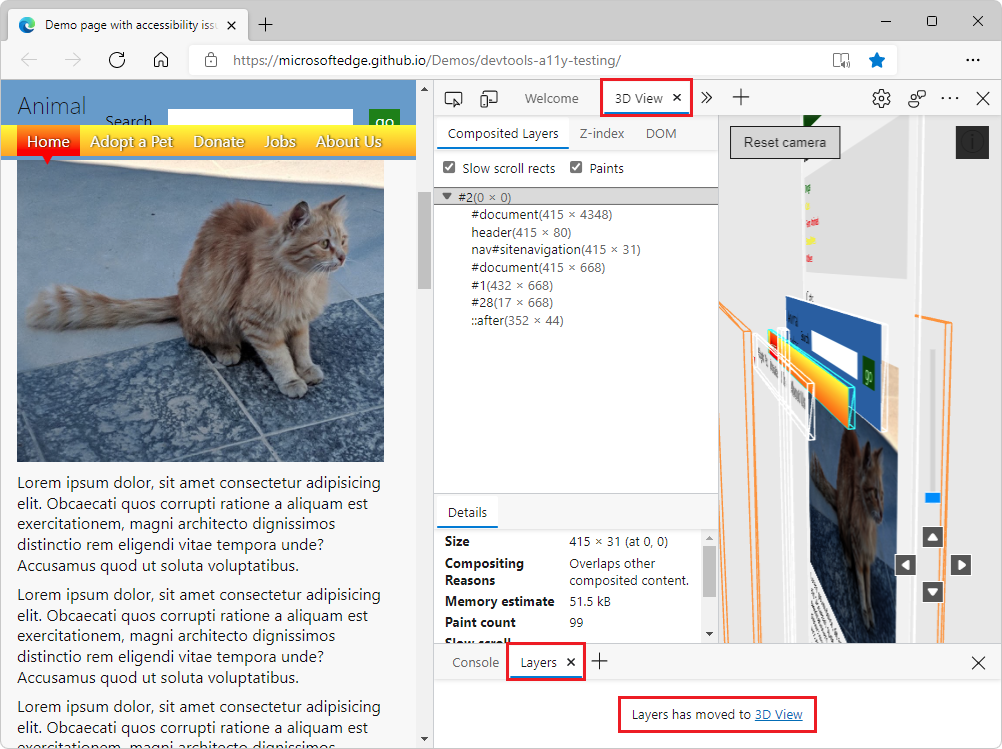
Since Microsoft Edge 88, the 3D View tool has provided an improved version of the Layers tool. Now, in Microsoft Edge 99, the functionality in the Layers tool has been removed, and the Layers tool instead contains a link that redirects you to the Composited Layers view within the 3D View tool. You can find all the features that were previously in the Layers tool, and more, in the 3D View tool.
Update: the Layers tool has now been removed.
See also:
Use your source maps to display original function names in performance profiles
Update: In Microsoft Edge 111, this feature has been removed, because the Performance tool now automatically provides the original file and function names while profiling production code, as long as sourcemaps are hosted on Azure Artifacts Symbol Server. See Performance tool unminifies file and function names when profiling production code in What's New in DevTools (Microsoft Edge 111).
Deprecated What's New entry
Recording a performance profile in the Performance tool produces a minified flame chart. In previous versions of Microsoft Edge, the flame chart didn't use source maps to display your original function names, even if you hosted the source maps on your server.
Starting in Microsoft Edge version 99, you can display your original function names in a performance profile, as follows:
- Record a profile, in the Performance tool.
- Click the new Unminify (
 ) button to create and download the unminified performance profile.
 - Load (import) (
 ) the unminified performance profile into the Performance tool.
The Unminify button will use source maps, provided that they are hosted side-by-side with your production code, to unminify function names in the flame chart in the Performance tool.
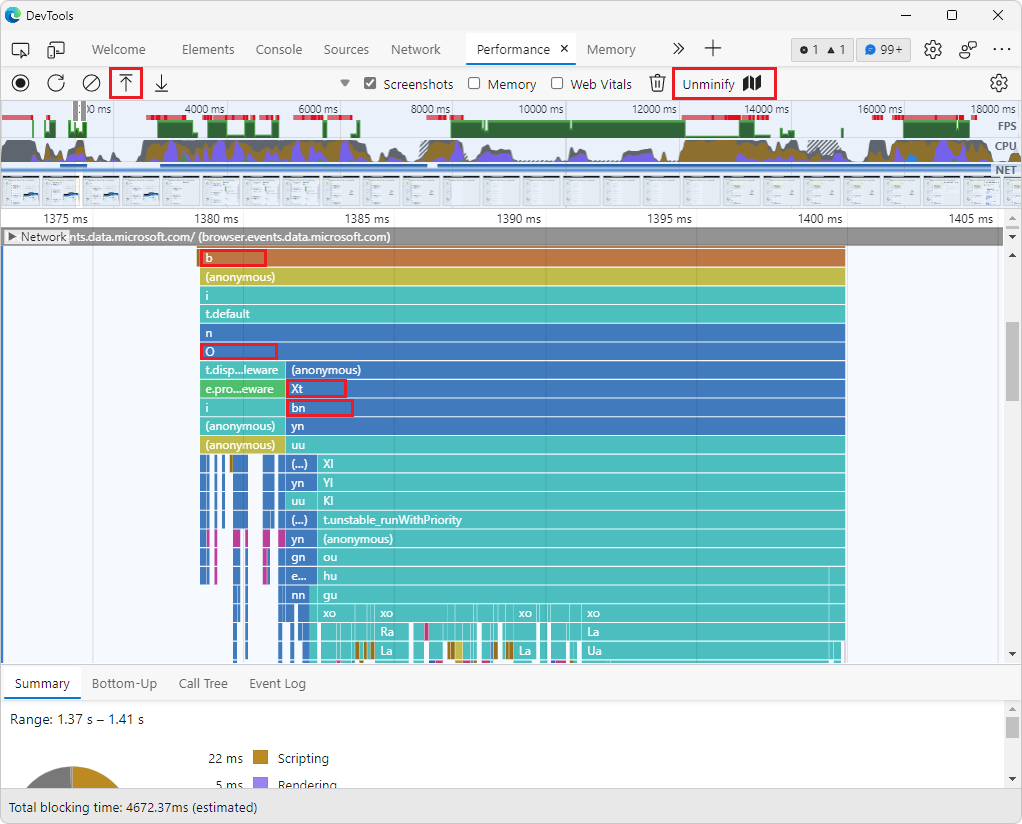
The flame chart in the Performance tool initially shows function names as b, O, Xt, and bn, taken from the minified production code returned by the web server:
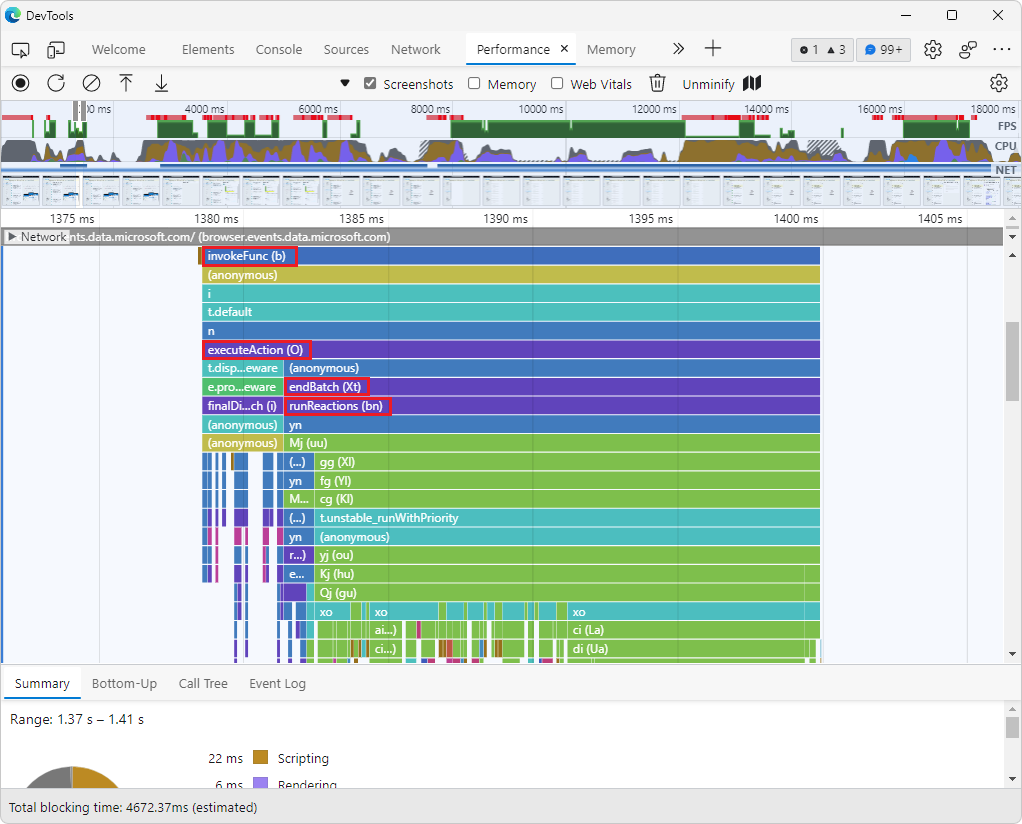
After clicking Unminify (![]() ) and then Load profile (
) and then Load profile (![]() ), the flame chart in the Performance tool now shows those functions labeled with meaningful names: invokeFunc (b), executeAction (O), endBatch (Xt), and runReactions (bn), retrieved from your source maps:
), the flame chart in the Performance tool now shows those functions labeled with meaningful names: invokeFunc (b), executeAction (O), endBatch (Xt), and runReactions (bn), retrieved from your source maps:
See also:
- Unminifying function names in DevTools performance profiles at the Microsoft Edge Blog.
- Display original function names in performance profiles.
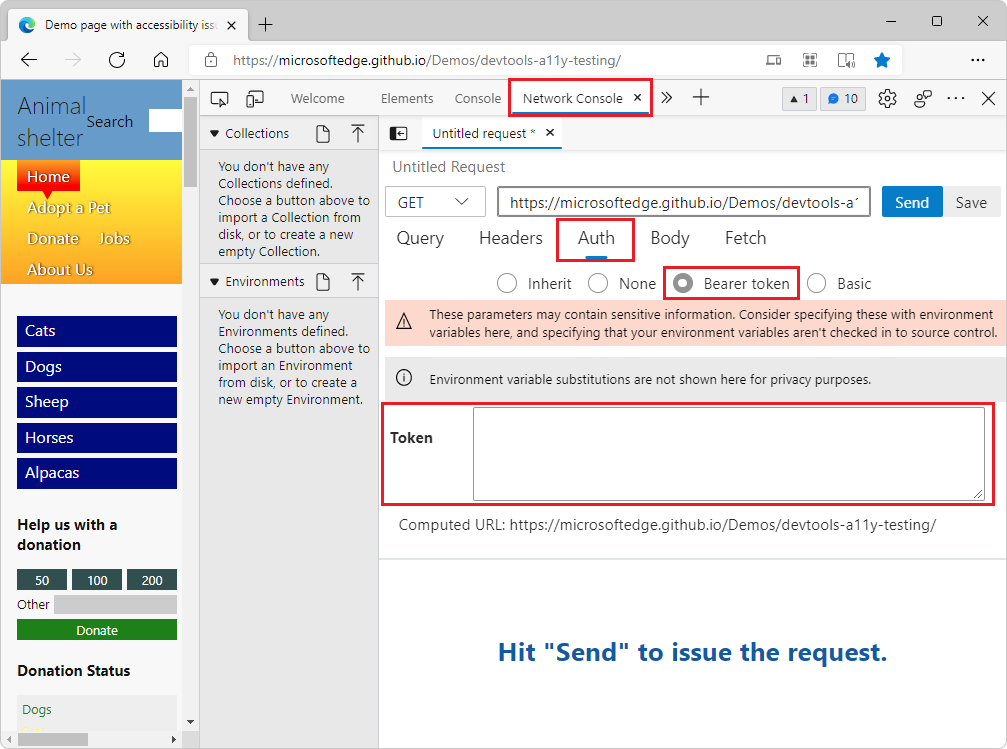
Improved accessibility for Network Console and 3D View
In previous versions of Microsoft Edge, assistive technology announced incorrect information when providing a custom bearer token in the Network Console tool. In Microsoft Edge version 99, this issue has been fixed. When selecting the text box for providing a custom bearer token, assistive technology now announces "Token edit text Request View group".
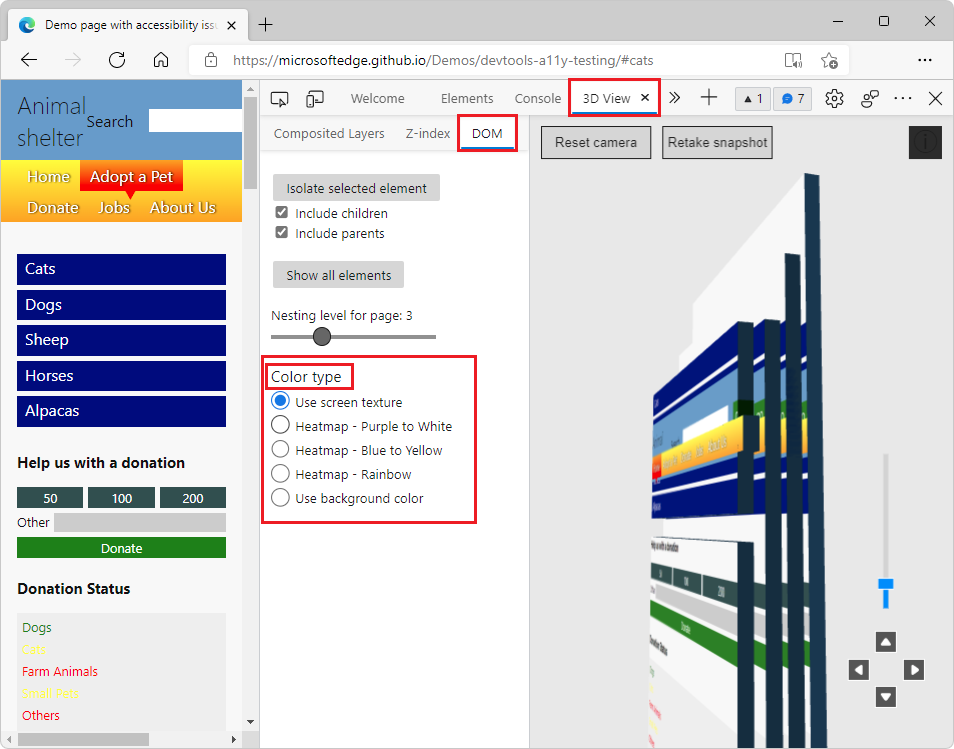
In previous versions of Microsoft Edge, assistive technology would only announce the radio button text in the 3D View tool, without announcing the group name that the button belongs to. In Microsoft Edge version 99, this has been fixed. For example, when focus is on the Use screen texture radio button, assistive technology will now announce: "Color type radio group, Use screen texture, radio button, selected".
See also:
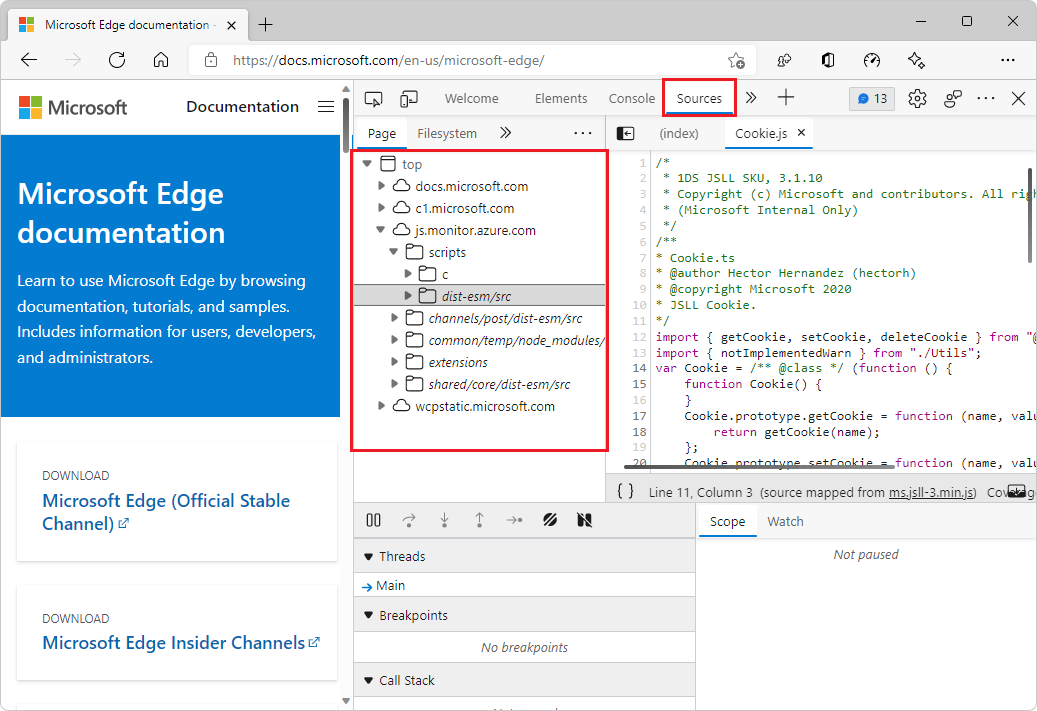
Improved source folder tree in the Sources panel
In the Page tab of the Sources tool, the tree of source folders is now improved, with less clutter in the naming and outline of folders. Unneeded path prefixes such as ../ and ./ have been removed. The tree structure has been simplified by merging equivalent duplicate folders.
For the history of this feature in the Chromium open-source project, see Issue 1284737.
See also:
- Using the Page tab to explore resources that construct the current webpage in Sources tool overview.
Announcements from the Chromium project
Microsoft Edge version 99 also includes the following updates from the Chromium project:
- Throttling WebSocket requests
- New Reporting API pane in the Application panel
- Better console styling, formatting and filtering
- Sourcemaps improvements
- Touch-friendly color-picker and split pane
Note
Portions of this page are modifications based on work created and shared by Google and used according to terms described in the Creative Commons Attribution 4.0 International License. The original page for announcements from the Chromium project is What's New in DevTools (Chrome 99) and is authored by Jecelyn Yeen.
![]() This work is licensed under a Creative Commons Attribution 4.0 International License.
This work is licensed under a Creative Commons Attribution 4.0 International License.