Training
Learning path
Use advance techniques in canvas apps to perform custom updates and optimization - Training
Use advance techniques in canvas apps to perform custom updates and optimization
This browser is no longer supported.
Upgrade to Microsoft Edge to take advantage of the latest features, security updates, and technical support.
These are the latest features in the Stable release of Microsoft Edge DevTools.
Microsoft Edge Dev is now supported on Ubuntu, Debian, Fedora, and openSUSE distributions. Download and install the Microsoft Edge Dev .deb or .rpm package directly from the Microsoft Edge Insider site or use the standard package management tools of your Linux distribution.
If you are using a Linux environment in your continuous integration and delivery (CI/CD) solutions, Microsoft Edge WebDriver is also available on Linux. To get started automating Microsoft Edge with Microsoft Edge WebDriver, see Recent versions at the Microsoft Edge WebDriver page. For help with automating Microsoft Edge with Microsoft Edge WebDriver, see Use WebDriver for test automation.
See also:
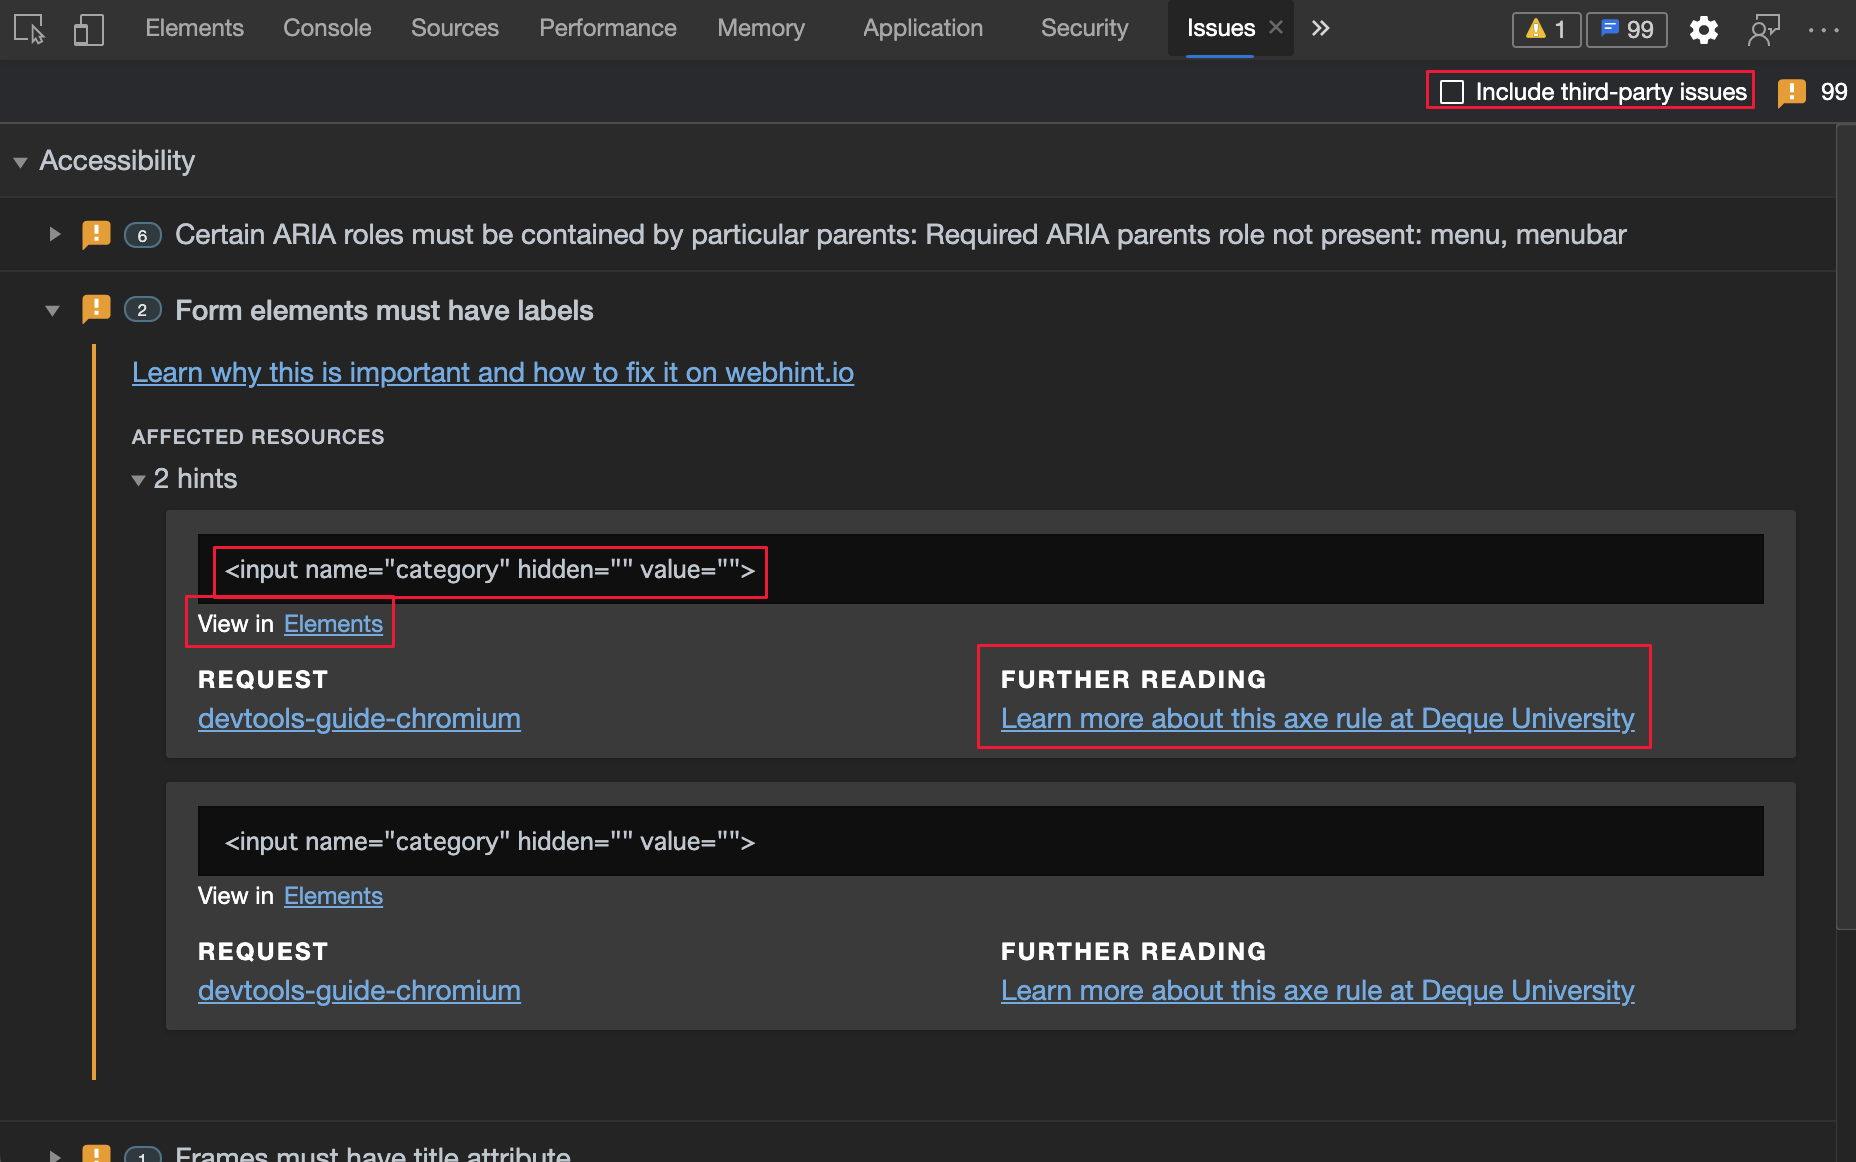
webhint is an open-source tool that provides real-time feedback for websites and local webpages. Starting with Microsoft Edge version 85, see webhint feedback in the Issues tool. Issues that appear in the Issues tool are now easier to see with the addition of the following categories.
You can now filter out third-party issues using a new checkbox. The filter functionality helps you hide issues related to code from third-party libraries or other sources.
To help you see issues that are found by webhint, the Issues tool now displays the following information:
See also:
You can now visualize Layers content alongside z-index values and the Document Object Model (DOM). This feature helps you debug without switching between the 3D View tool and Layers tools as often.
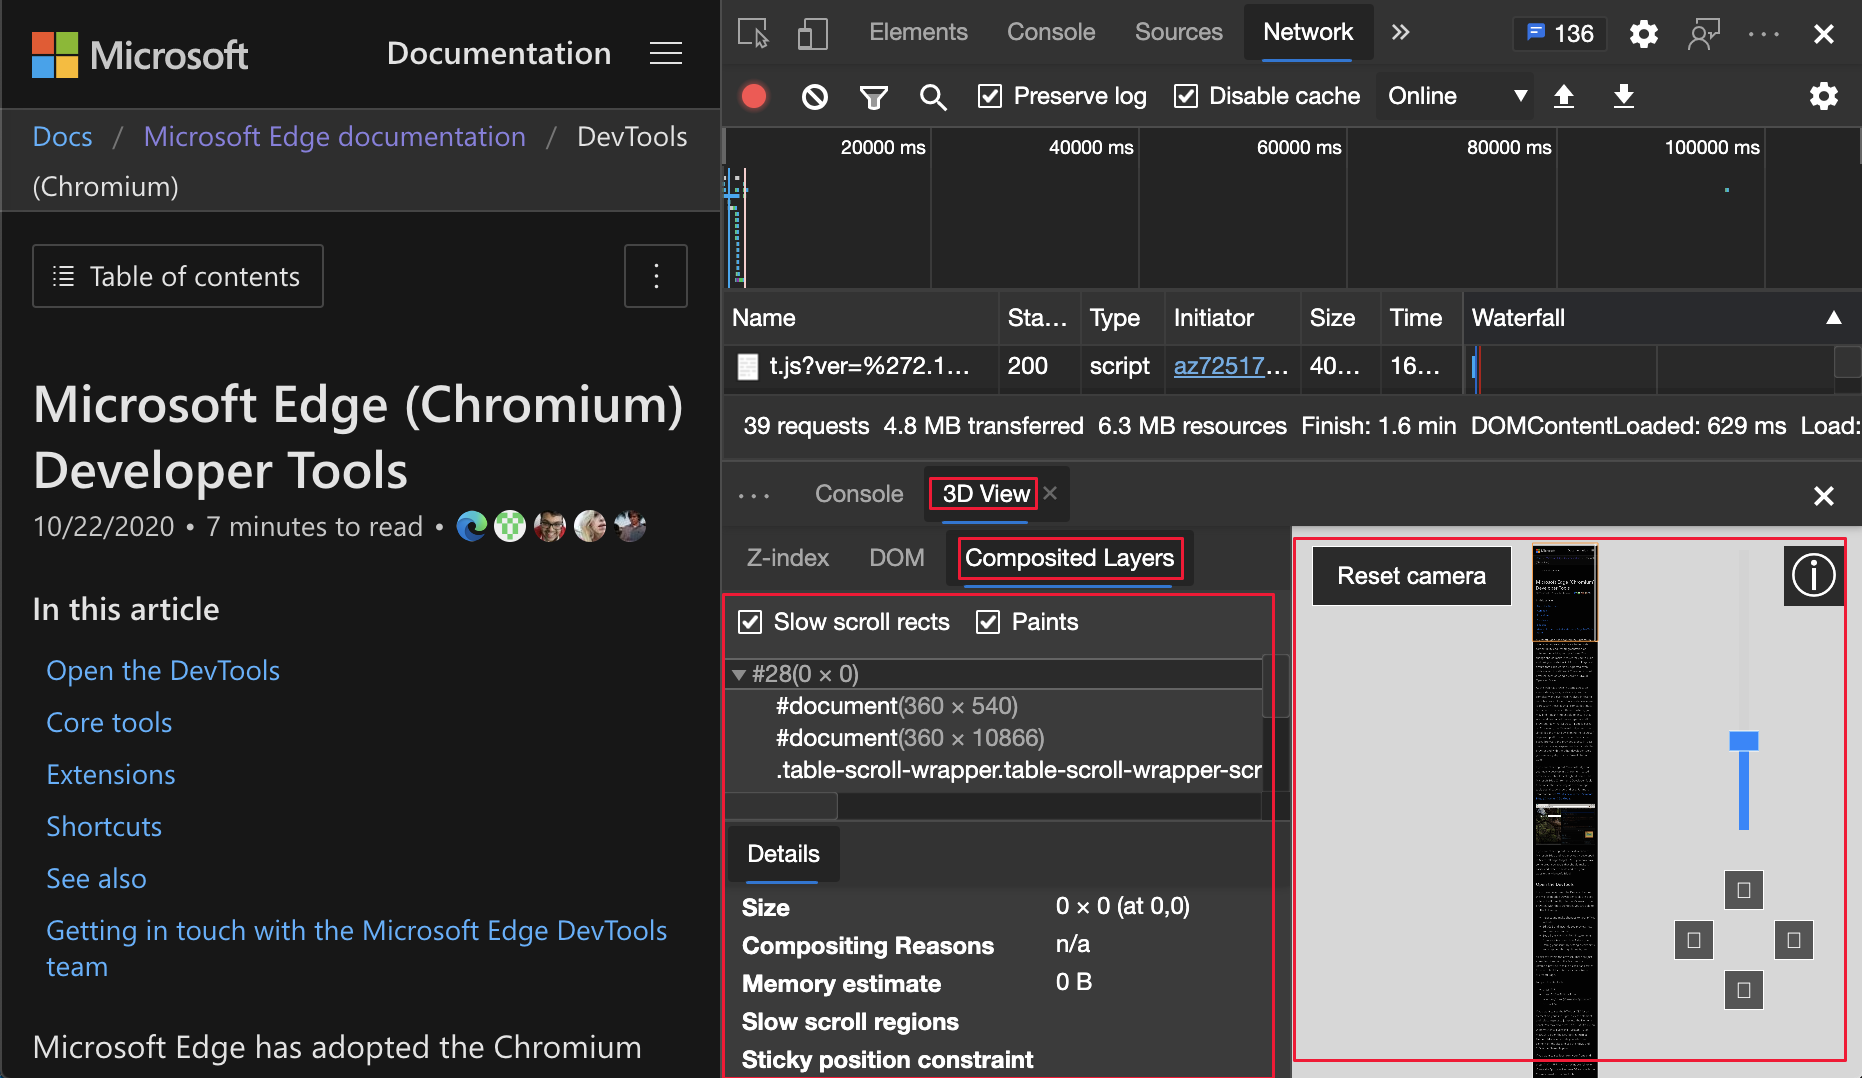
Update: This feature has been released and is no longer experimental. The Layers tool has been removed and replaced by the 3D View tool.
See also:
In the Styles pane of the Elements tool, CSS variables now link directly to each definition. Click the variable to easily view or change the CSS variable definition. In the example, DevTools displays the CSS attributes for the body element.
For example, to display the variable definition for the --theme-body-background CSS variable:
--theme-body-background of the CSS variable var(--theme-body-background). The tooltip appears, Jump to definition: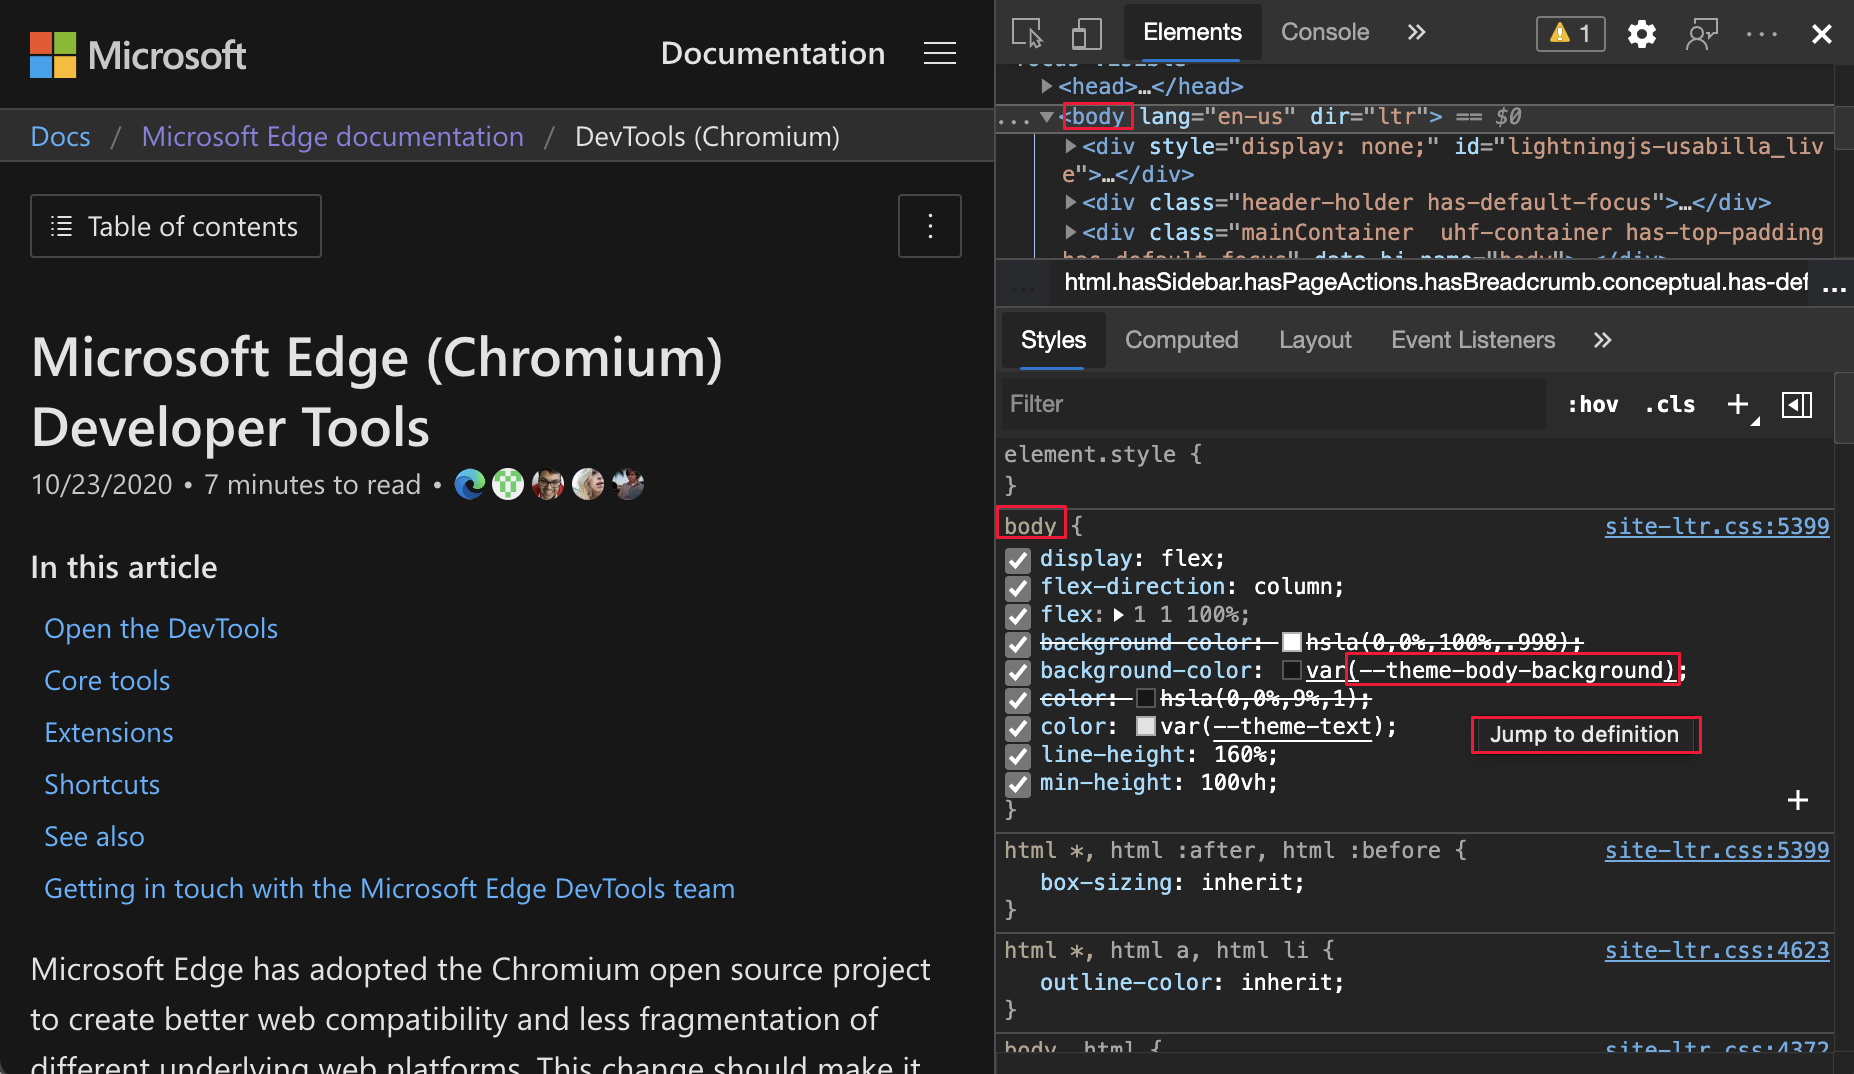
--theme-body-background. The Styles pane displays the definition of the style: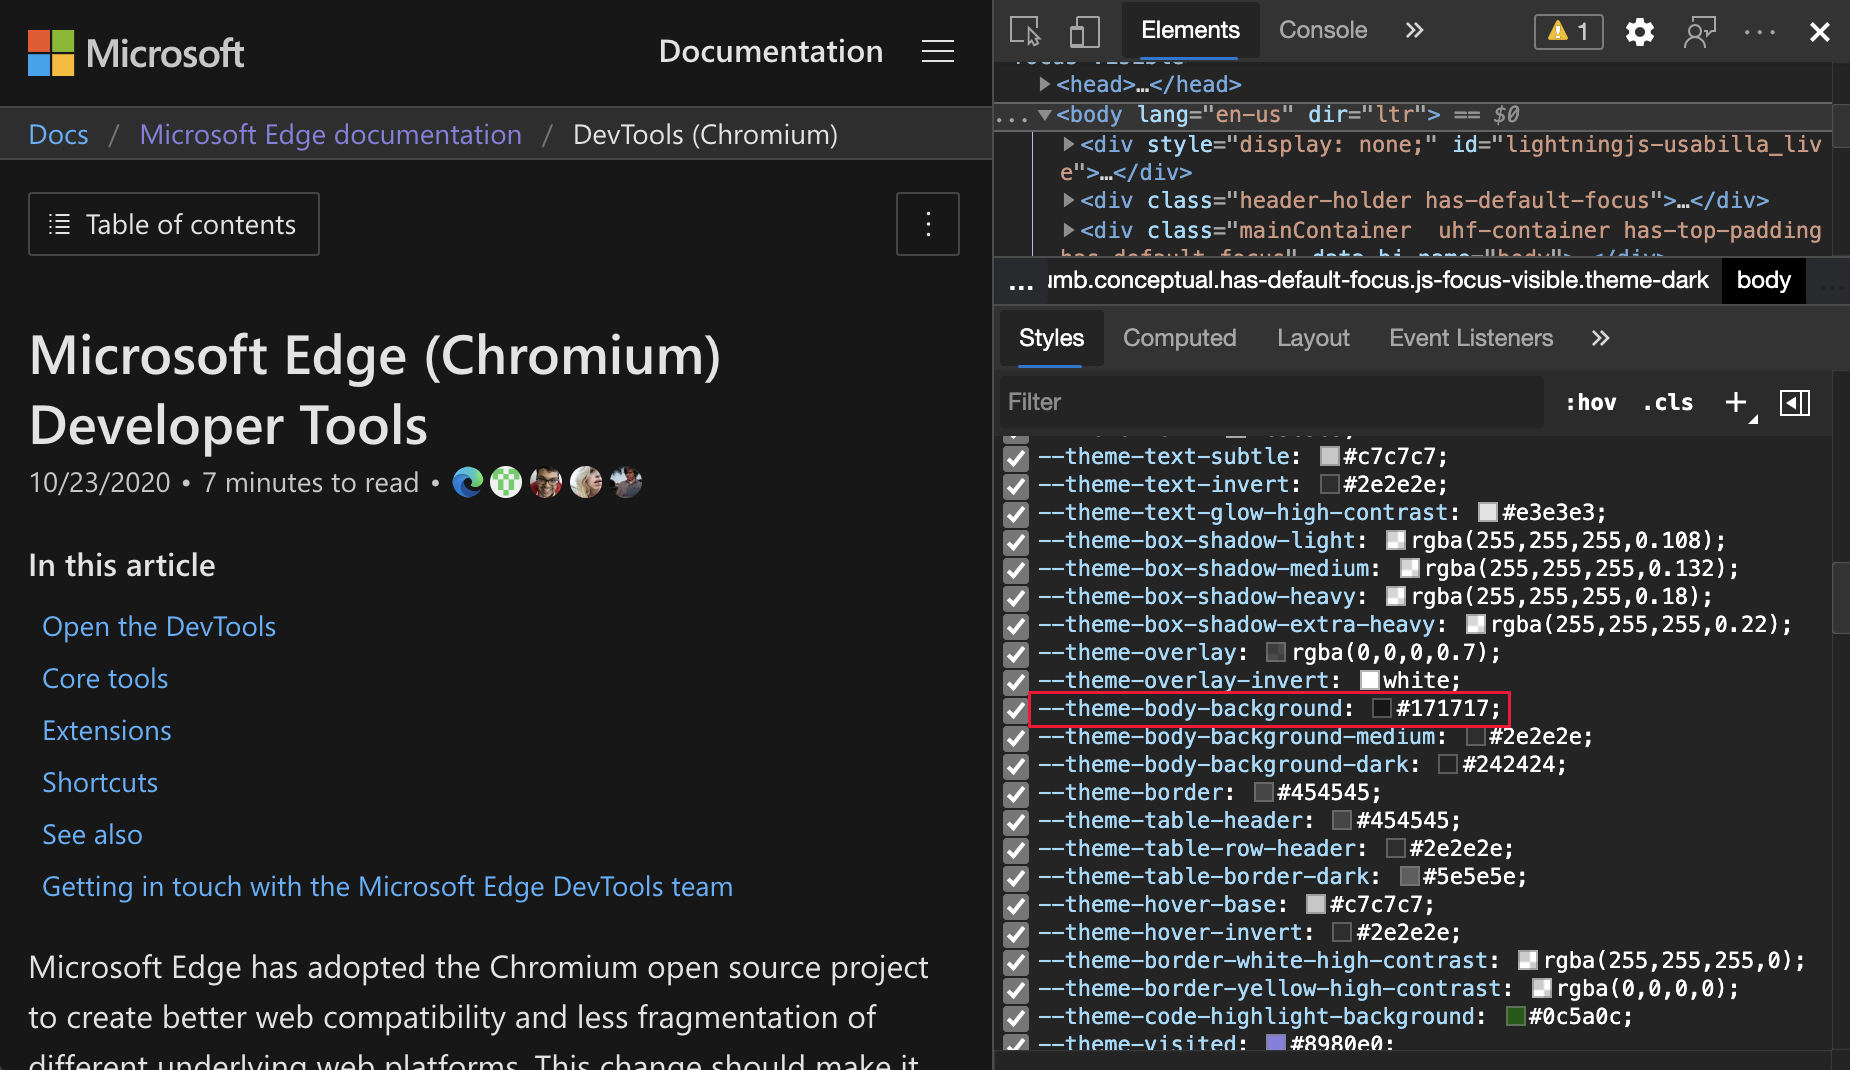
See also:
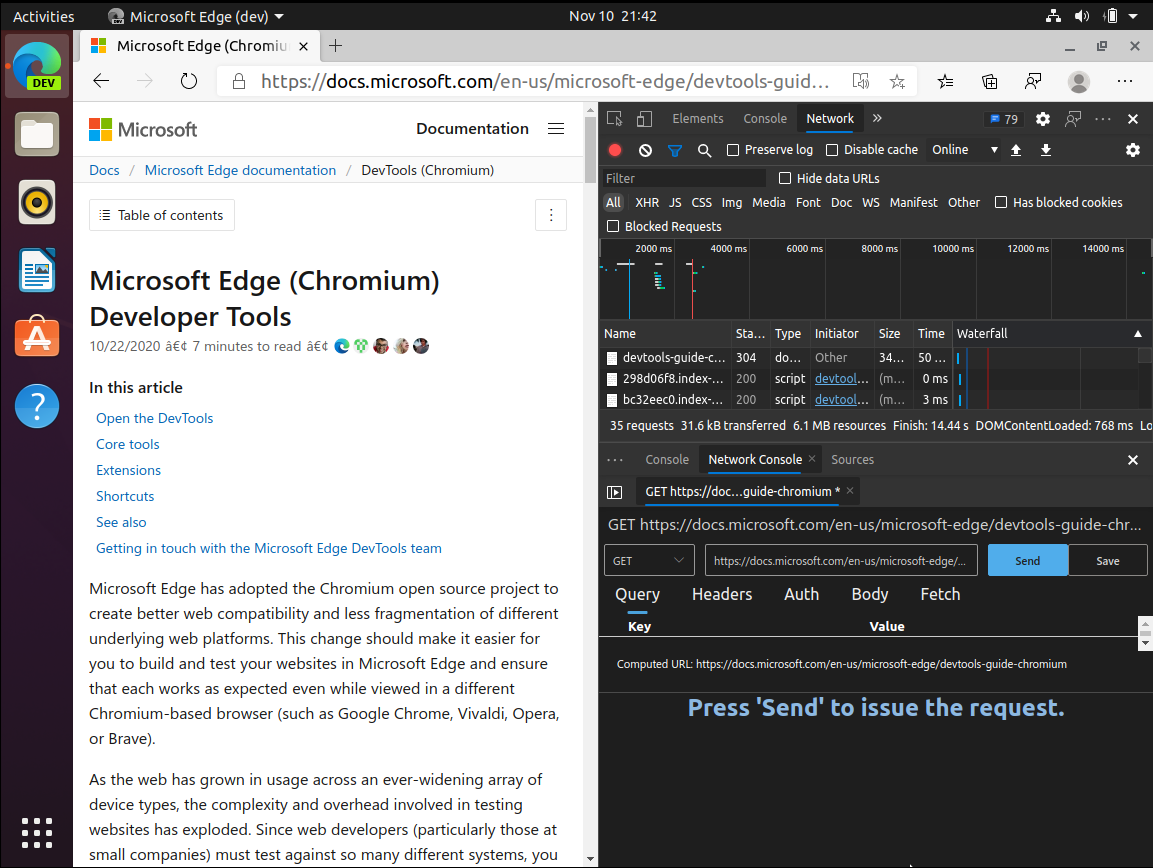
The following new features in the Network tool, Application tool, and Sources tool help you build your PWA. Use the following features when you have difficulty debugging your service worker.
The routing of a request displays the startup and fetch events based on the network requests that run through service workers. The timelines are accessed from either the Application or Network tool. The timelines help when you are having trouble with service workers and want to see if something is wrong with the startup or fetch event.
See also:
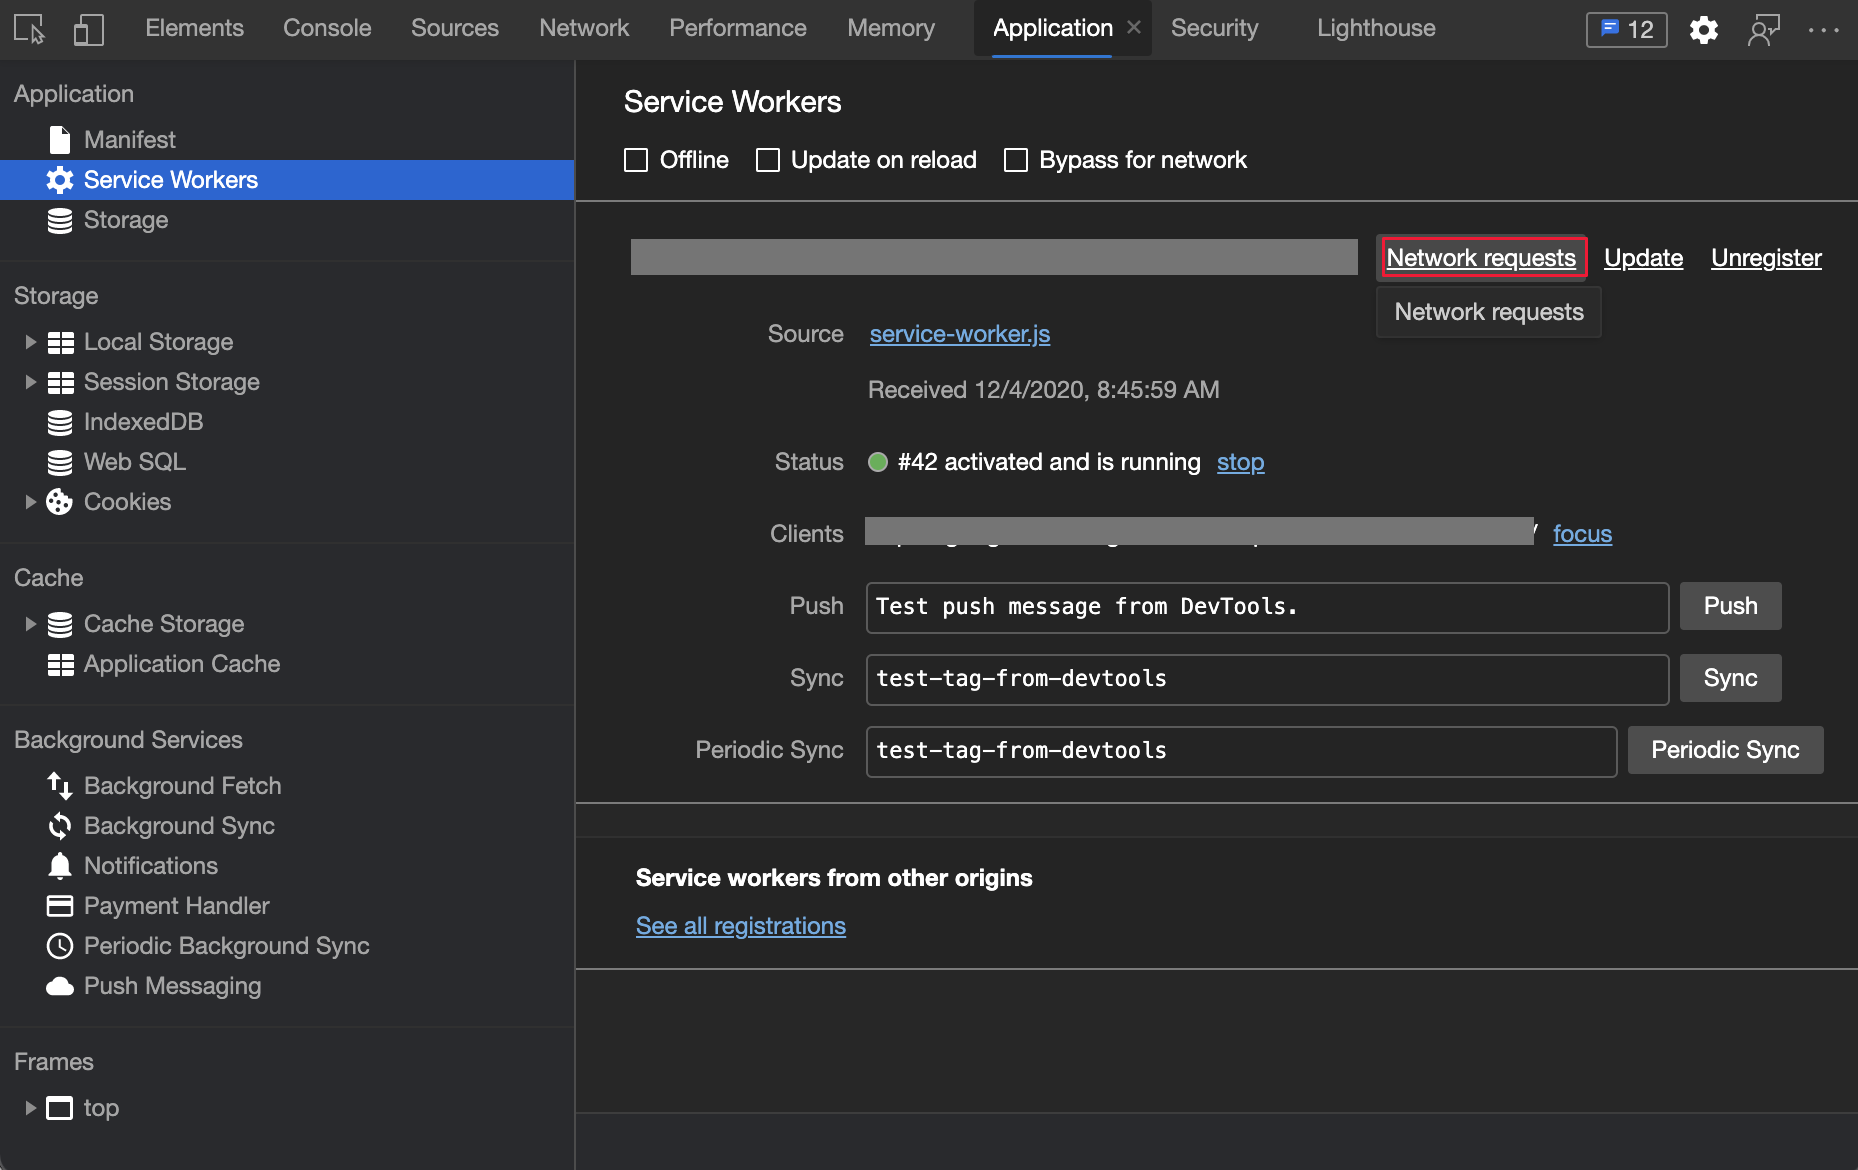
In the Application tool, view all service worker request routing information by using the new Network requests link.
To display additional context when debugging a service worker:
In the Application tool, on the left, select Service Workers.
Click the Network requests link:
The Network tool opens in the Quick View panel at the bottom of DevTools, and displays all service worker-related network requests. The network requests are filtered using is:service-worker-intercepted:
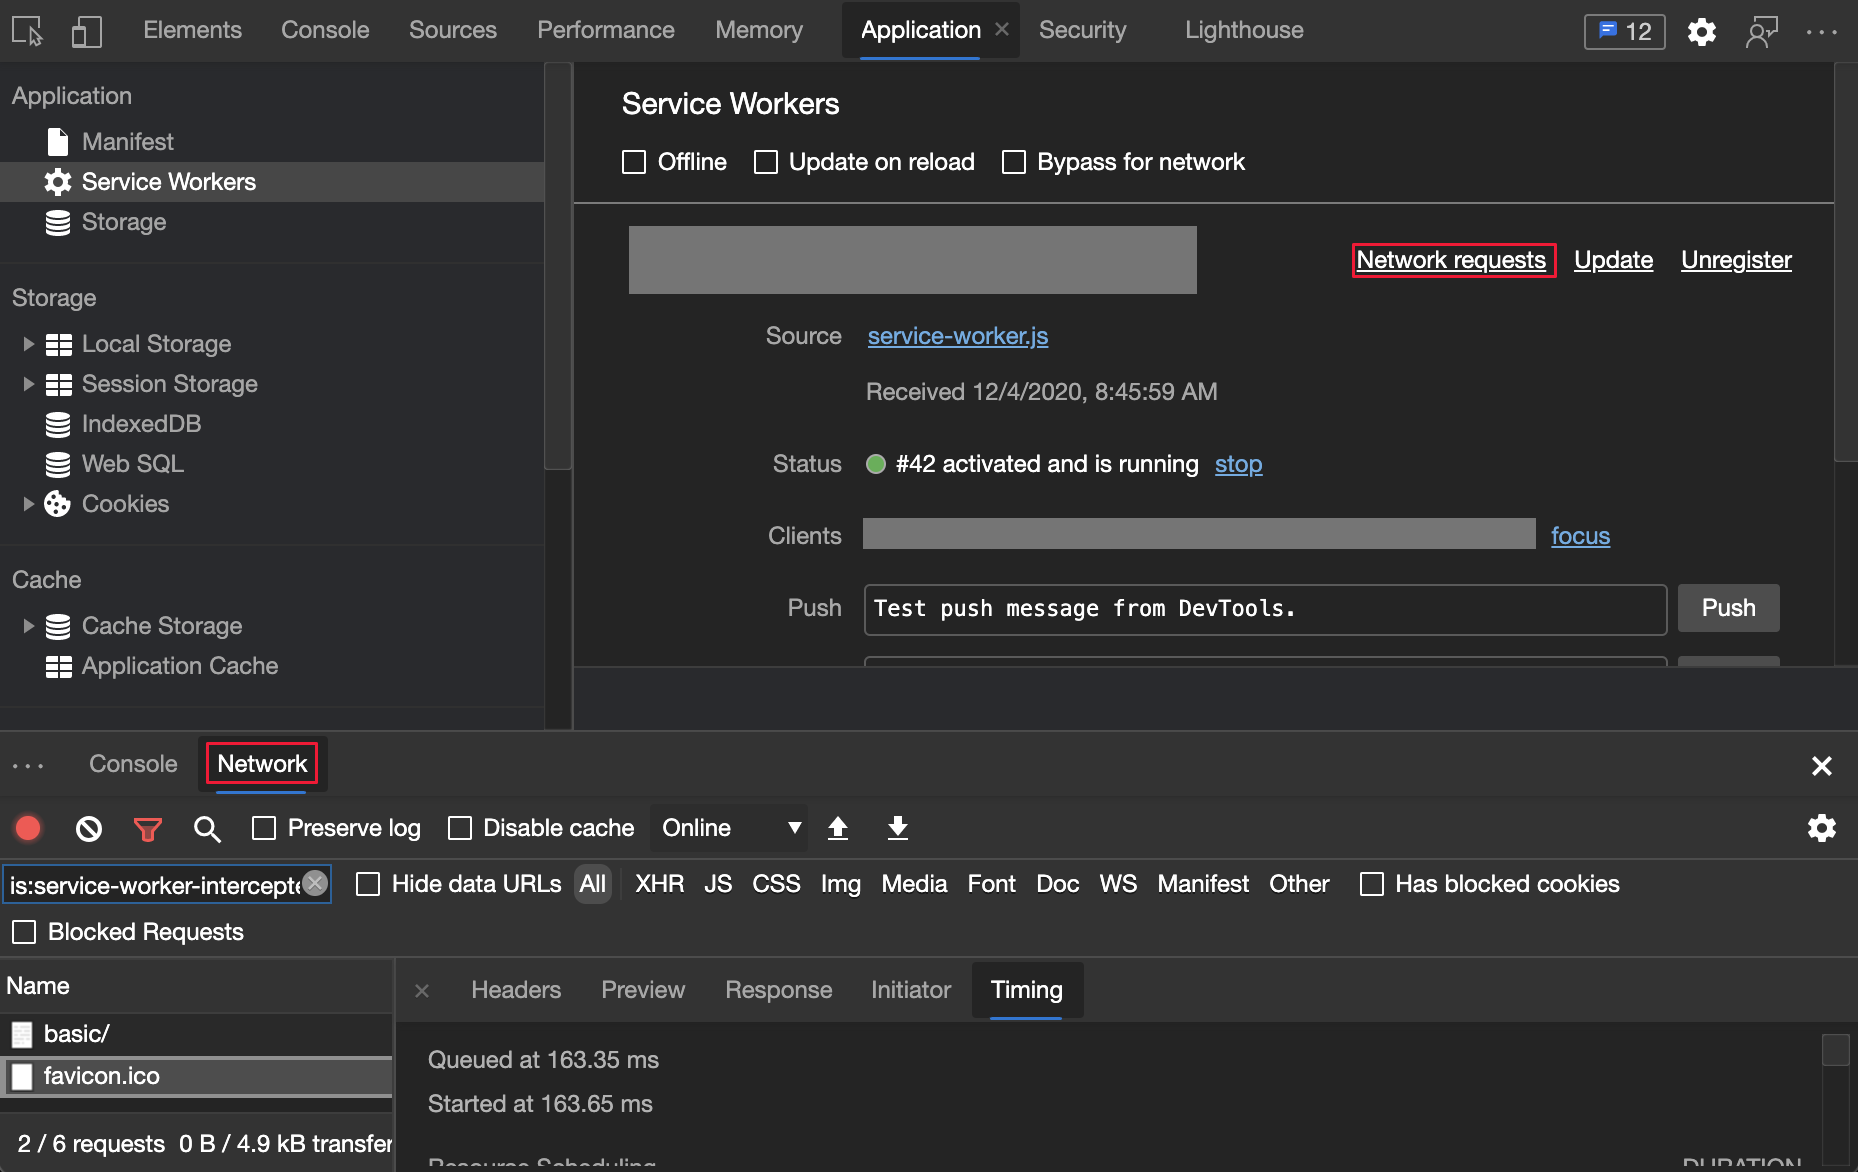
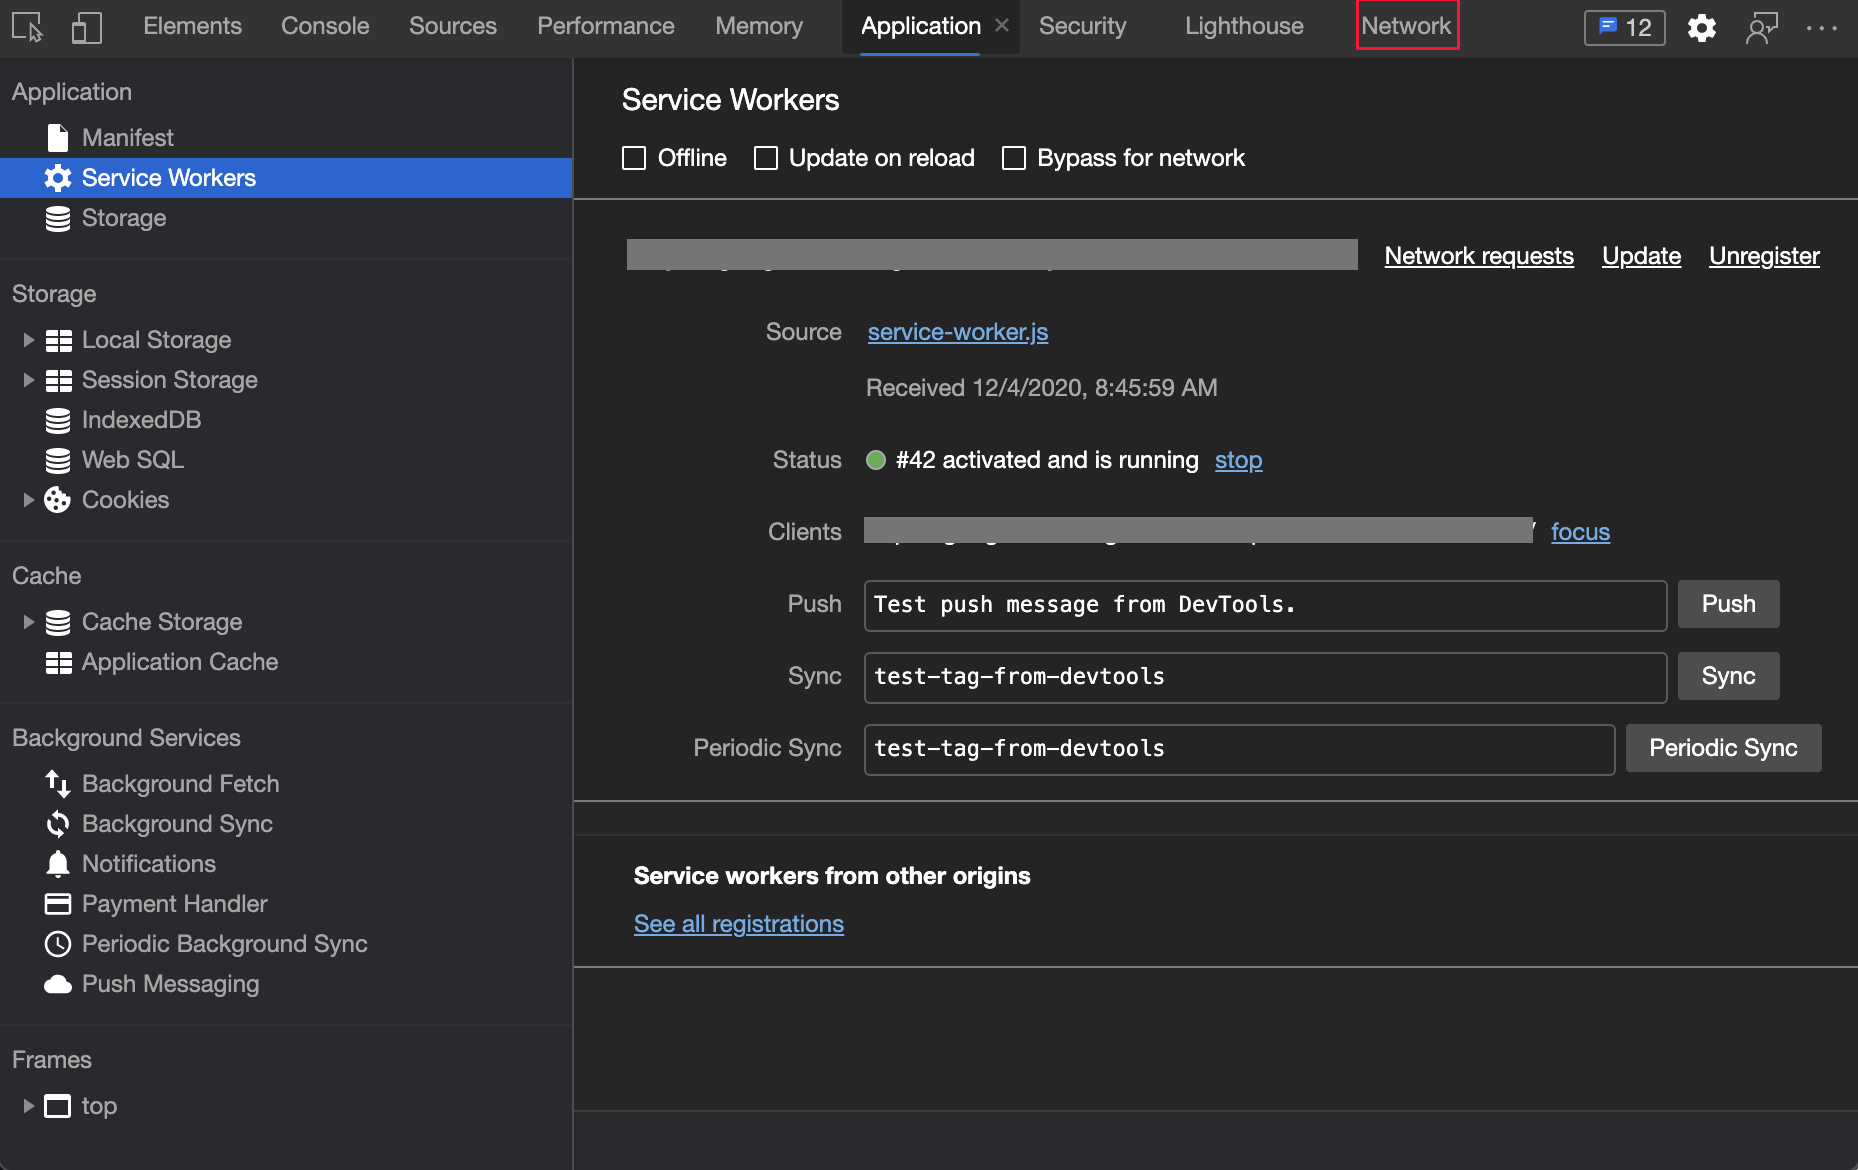
To move the Network tool to the top panel, close the Quick View panel:
See also:
In the Network tool, you can debug network requests that are run by service workers. (You can also open network requests from within the Application tool, instead of the Network tool.) In the Timing pane of the Network tool, for each request, DevTools displays the following information:
fetch event handler.fetch events for loading a client.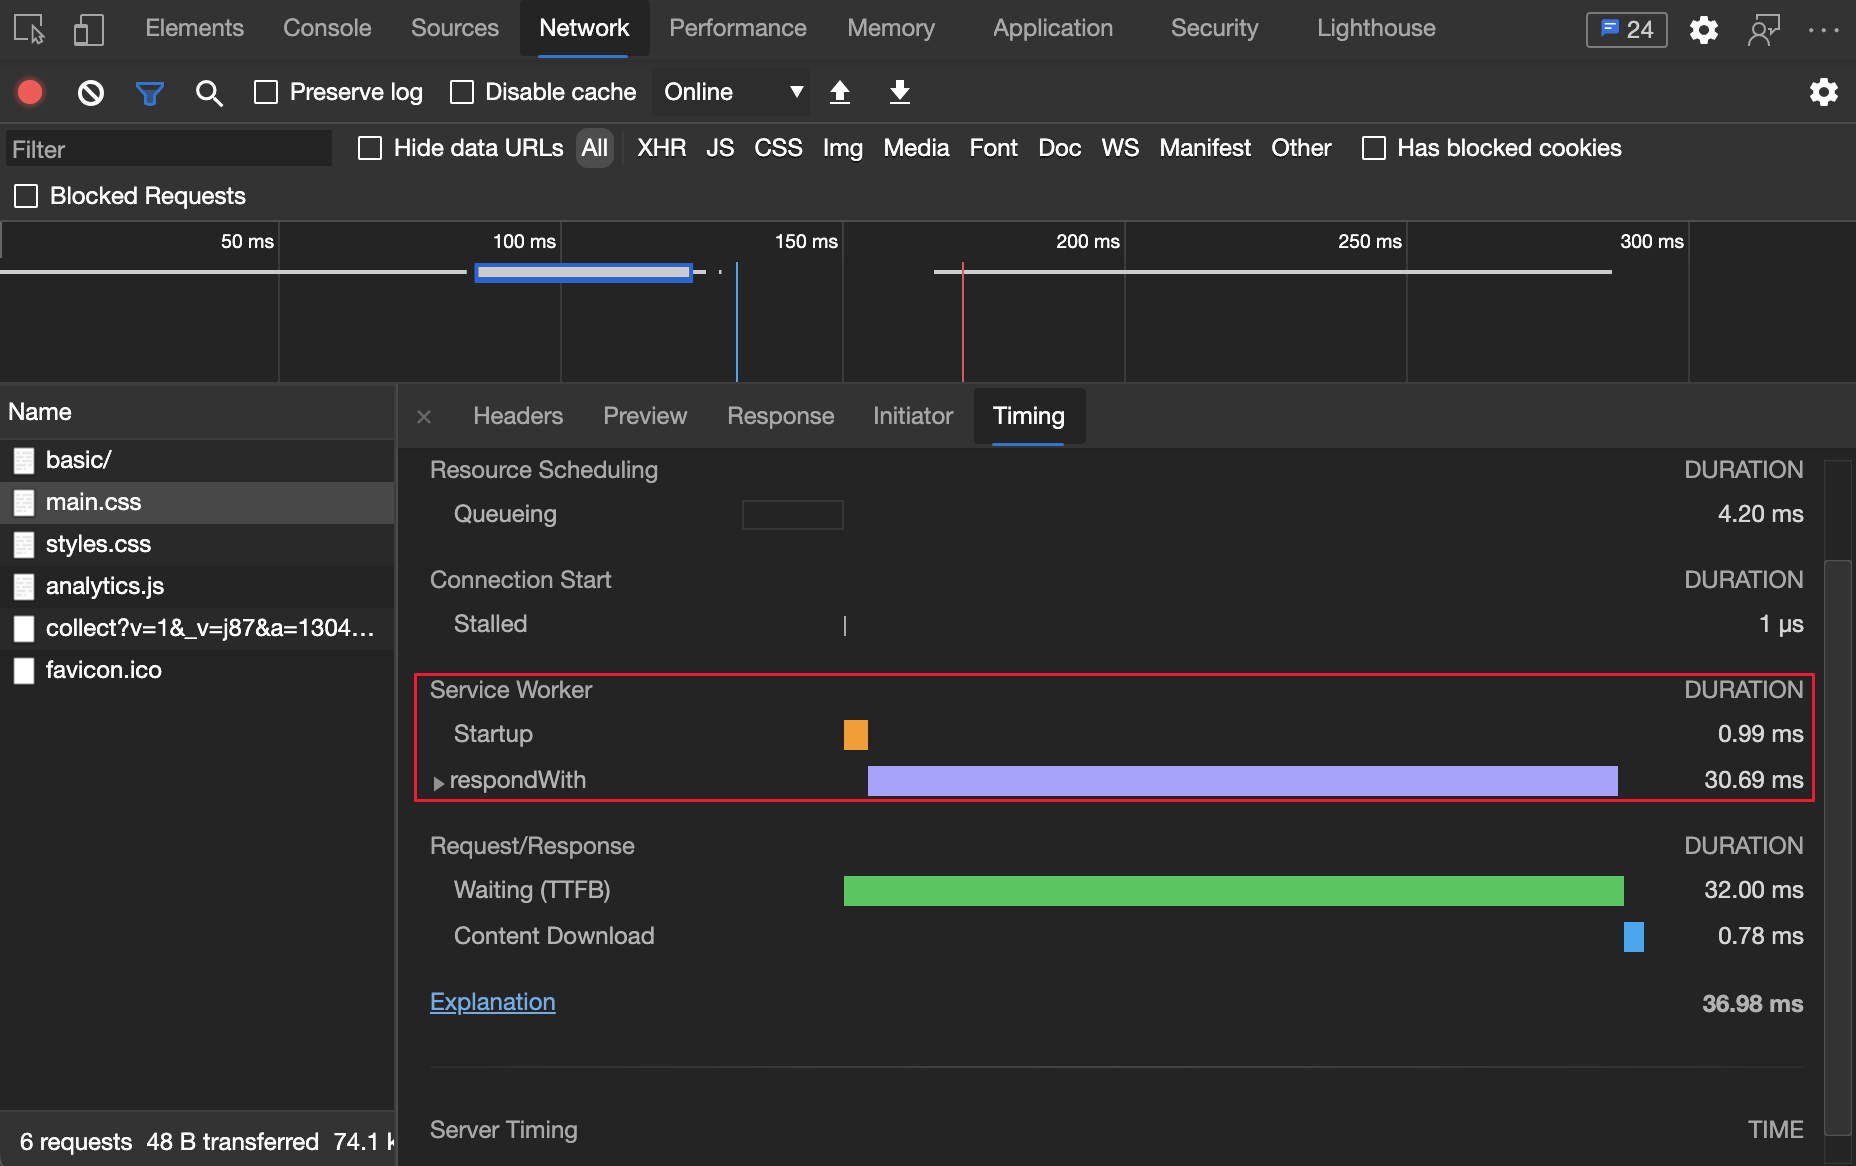
See also:
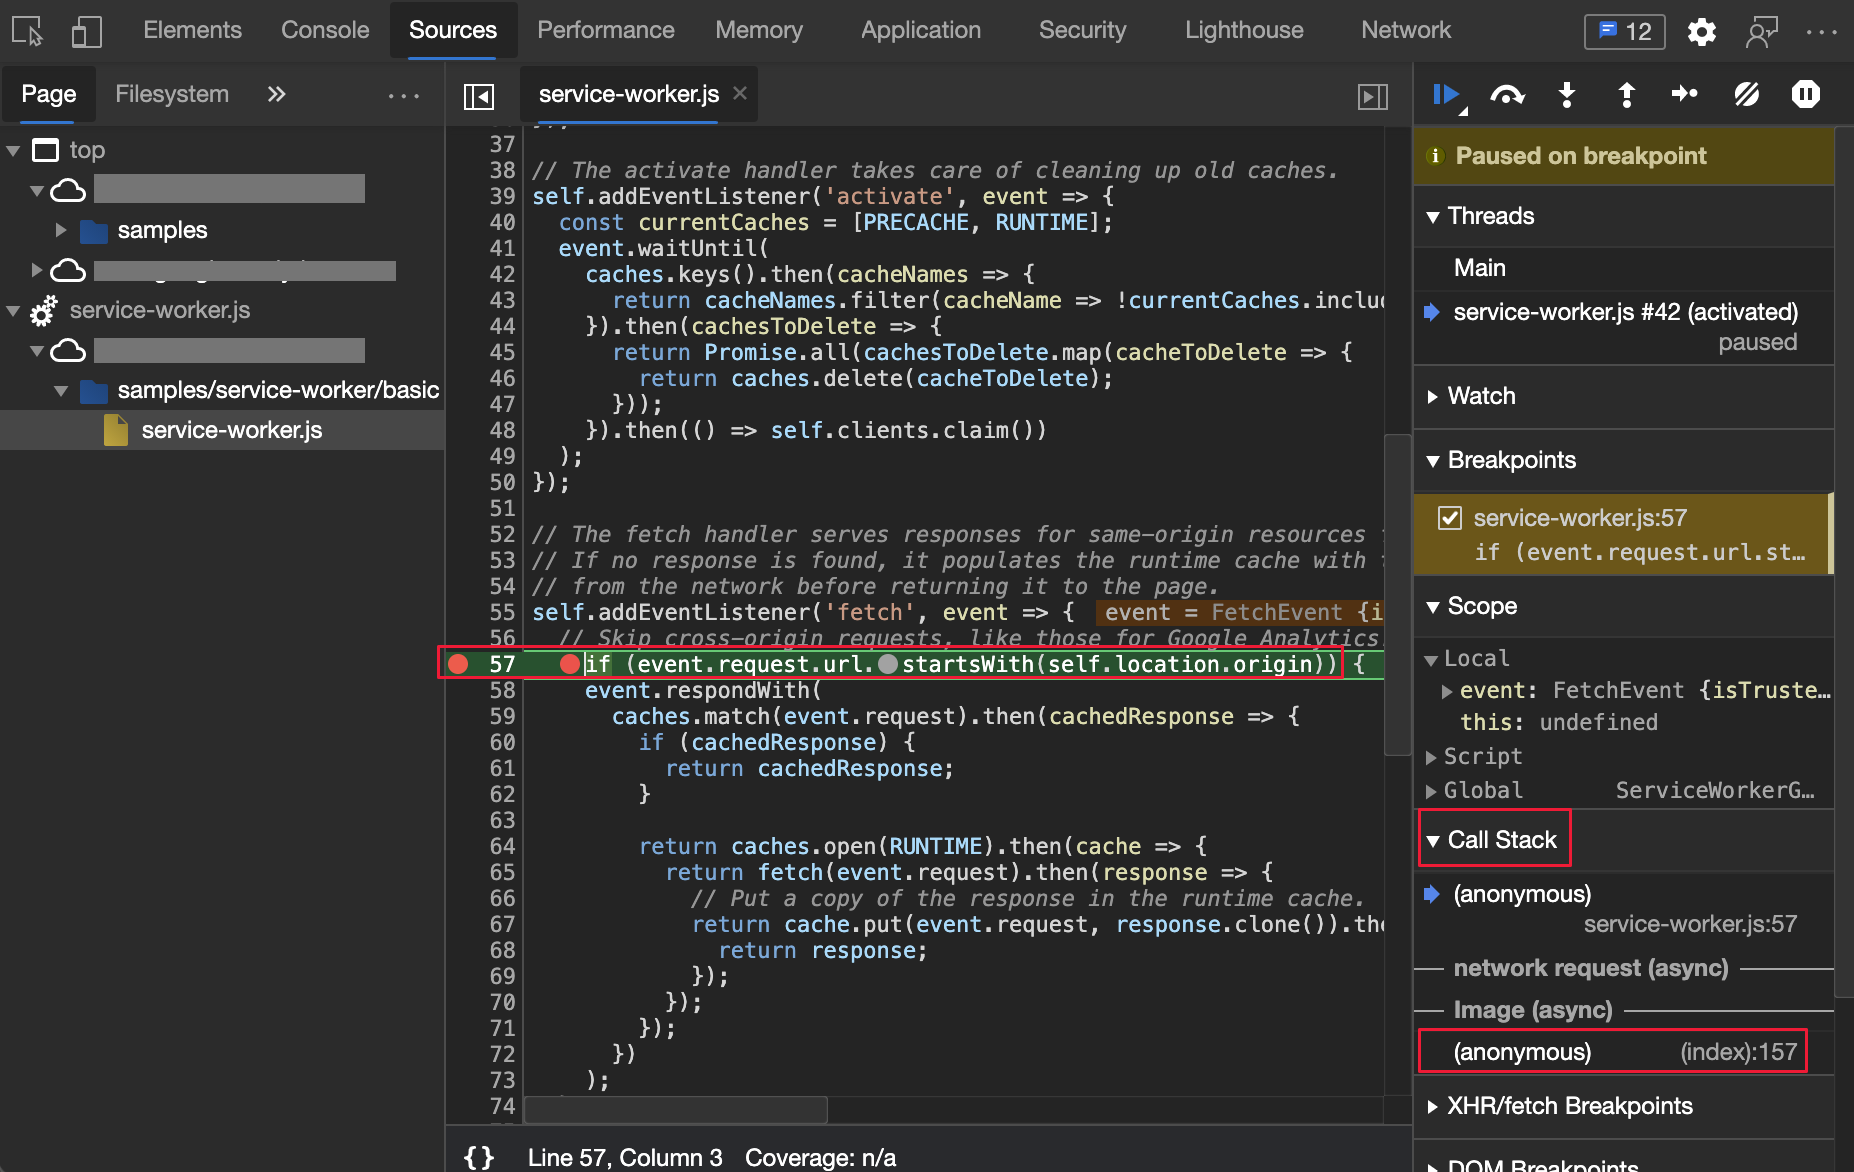
In previous versions of Microsoft Edge, the level of depth in the call stack was limited to the JavaScript code in your service worker. In Microsoft Edge 88, the call stack now displays the initiator of requests that run through your service worker.
To locate the initiator of the request, use the call stack of your JavaScript code in the service worker. The call stack in the following figure starts with the JavaScript code in your service worker (service-worker.js), and displays a reference to the original webpage request as (index):157. The service-worker.js file is shown, and the call stack highlights the request originator, (index):157:
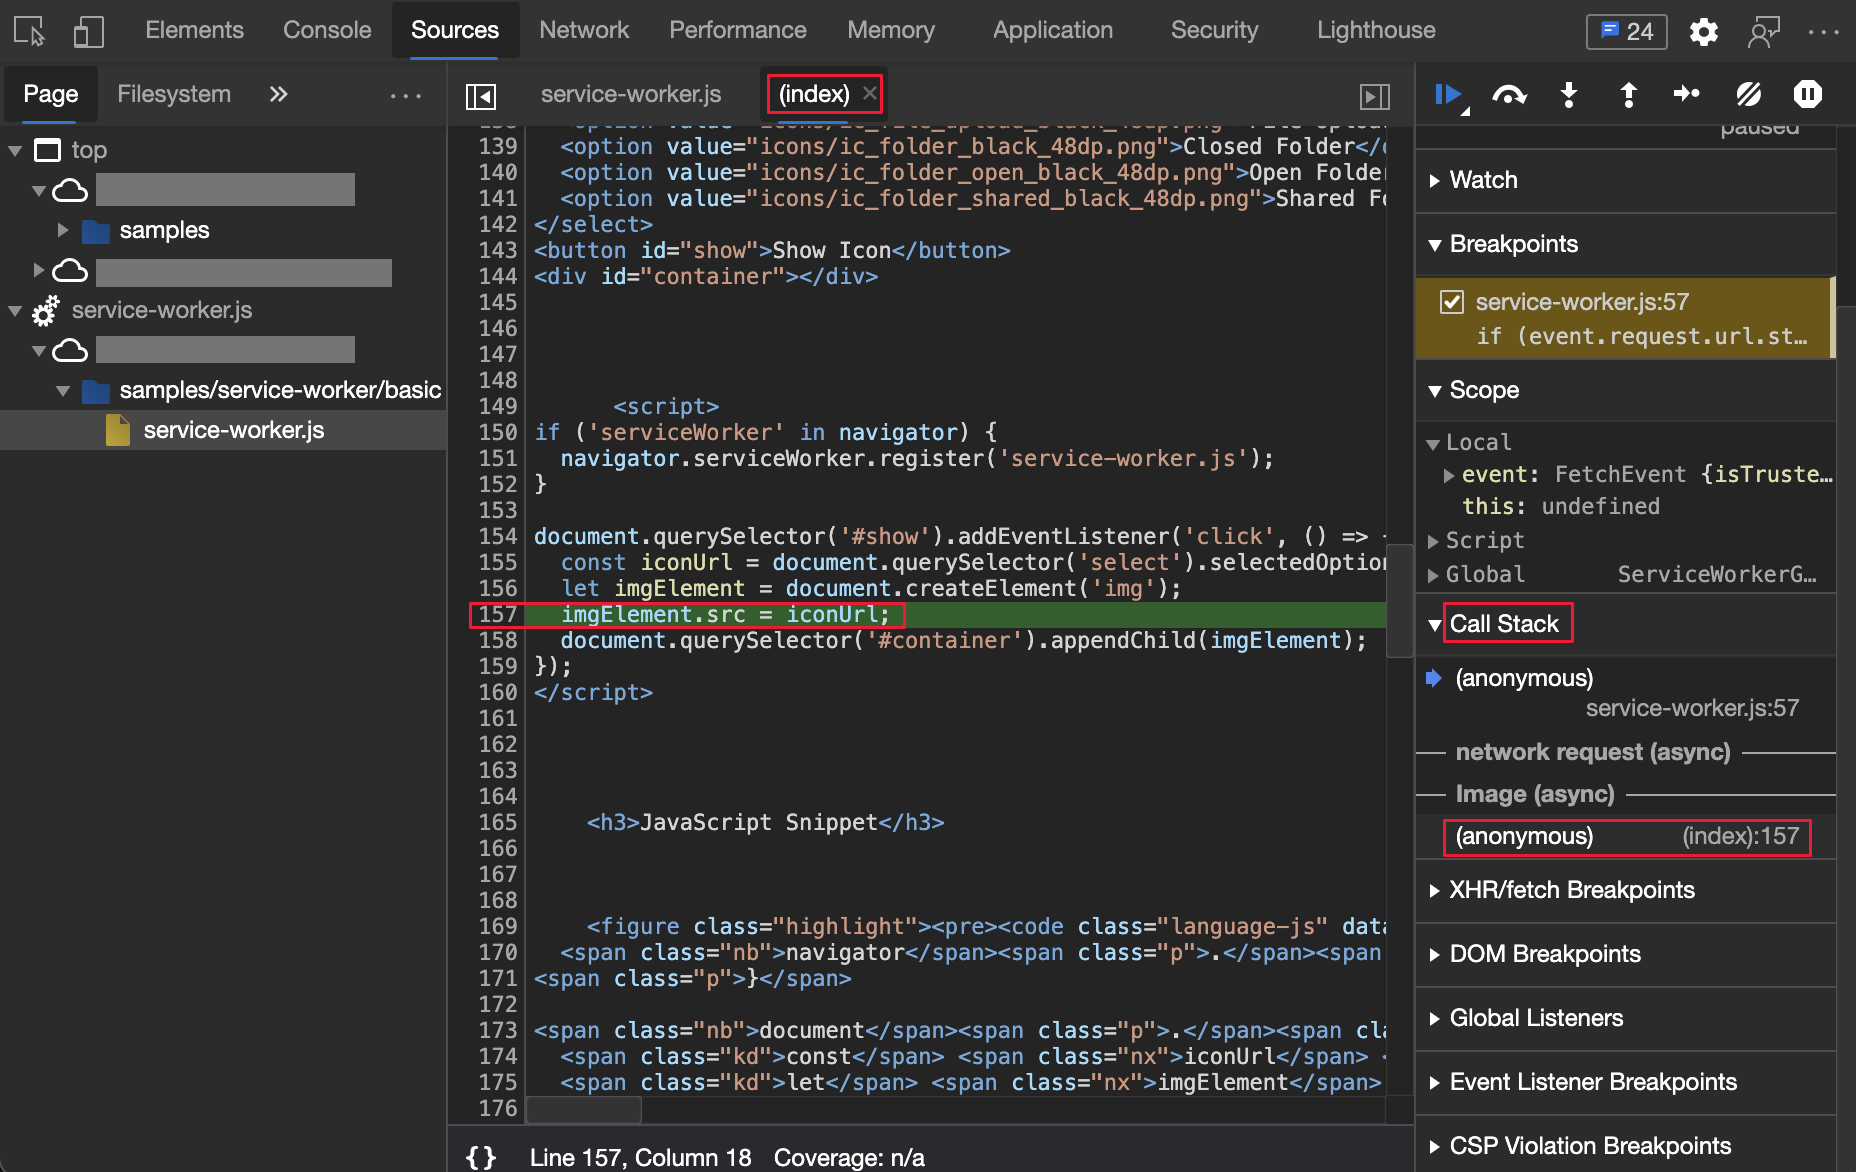
In the following figure, the reference is selected, and has opened the initiator that made the request. The (index) webpage is the request initiator:
See also:
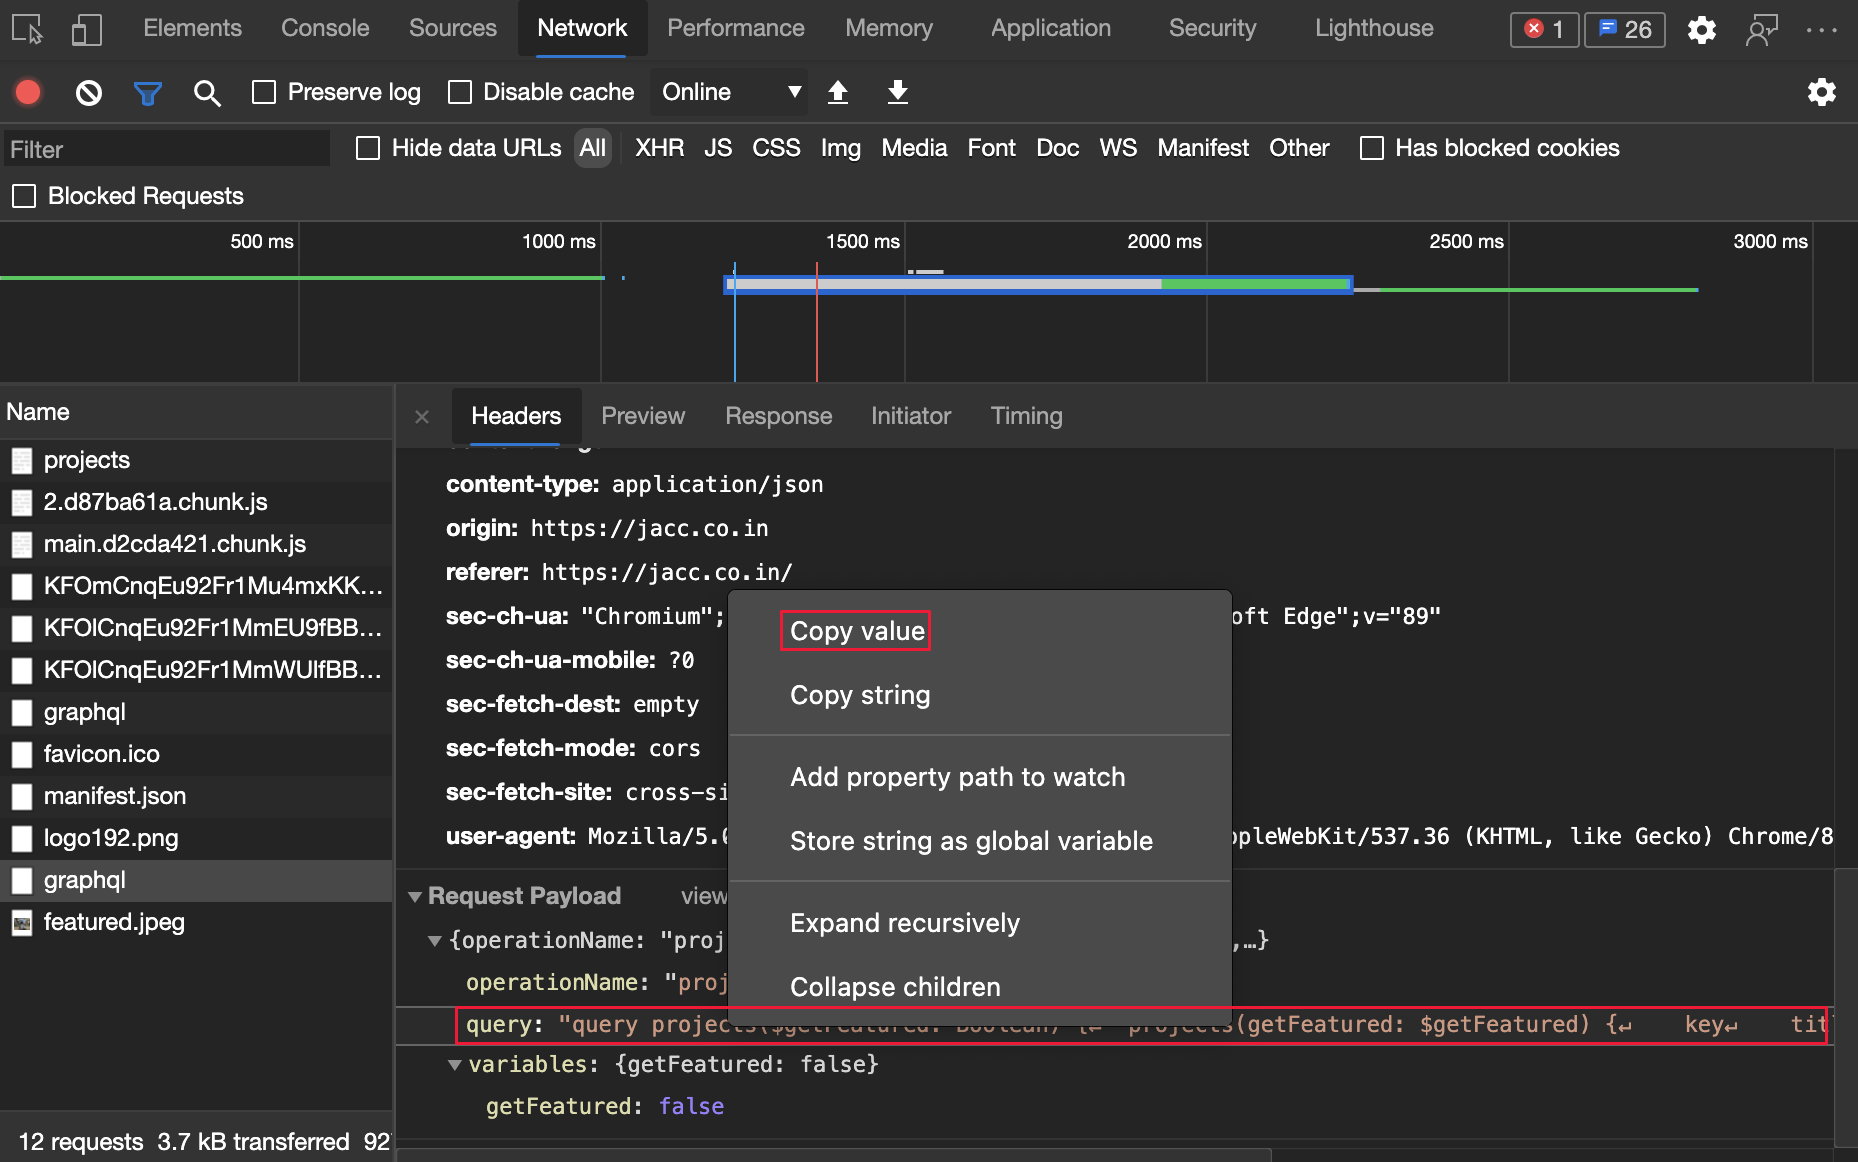
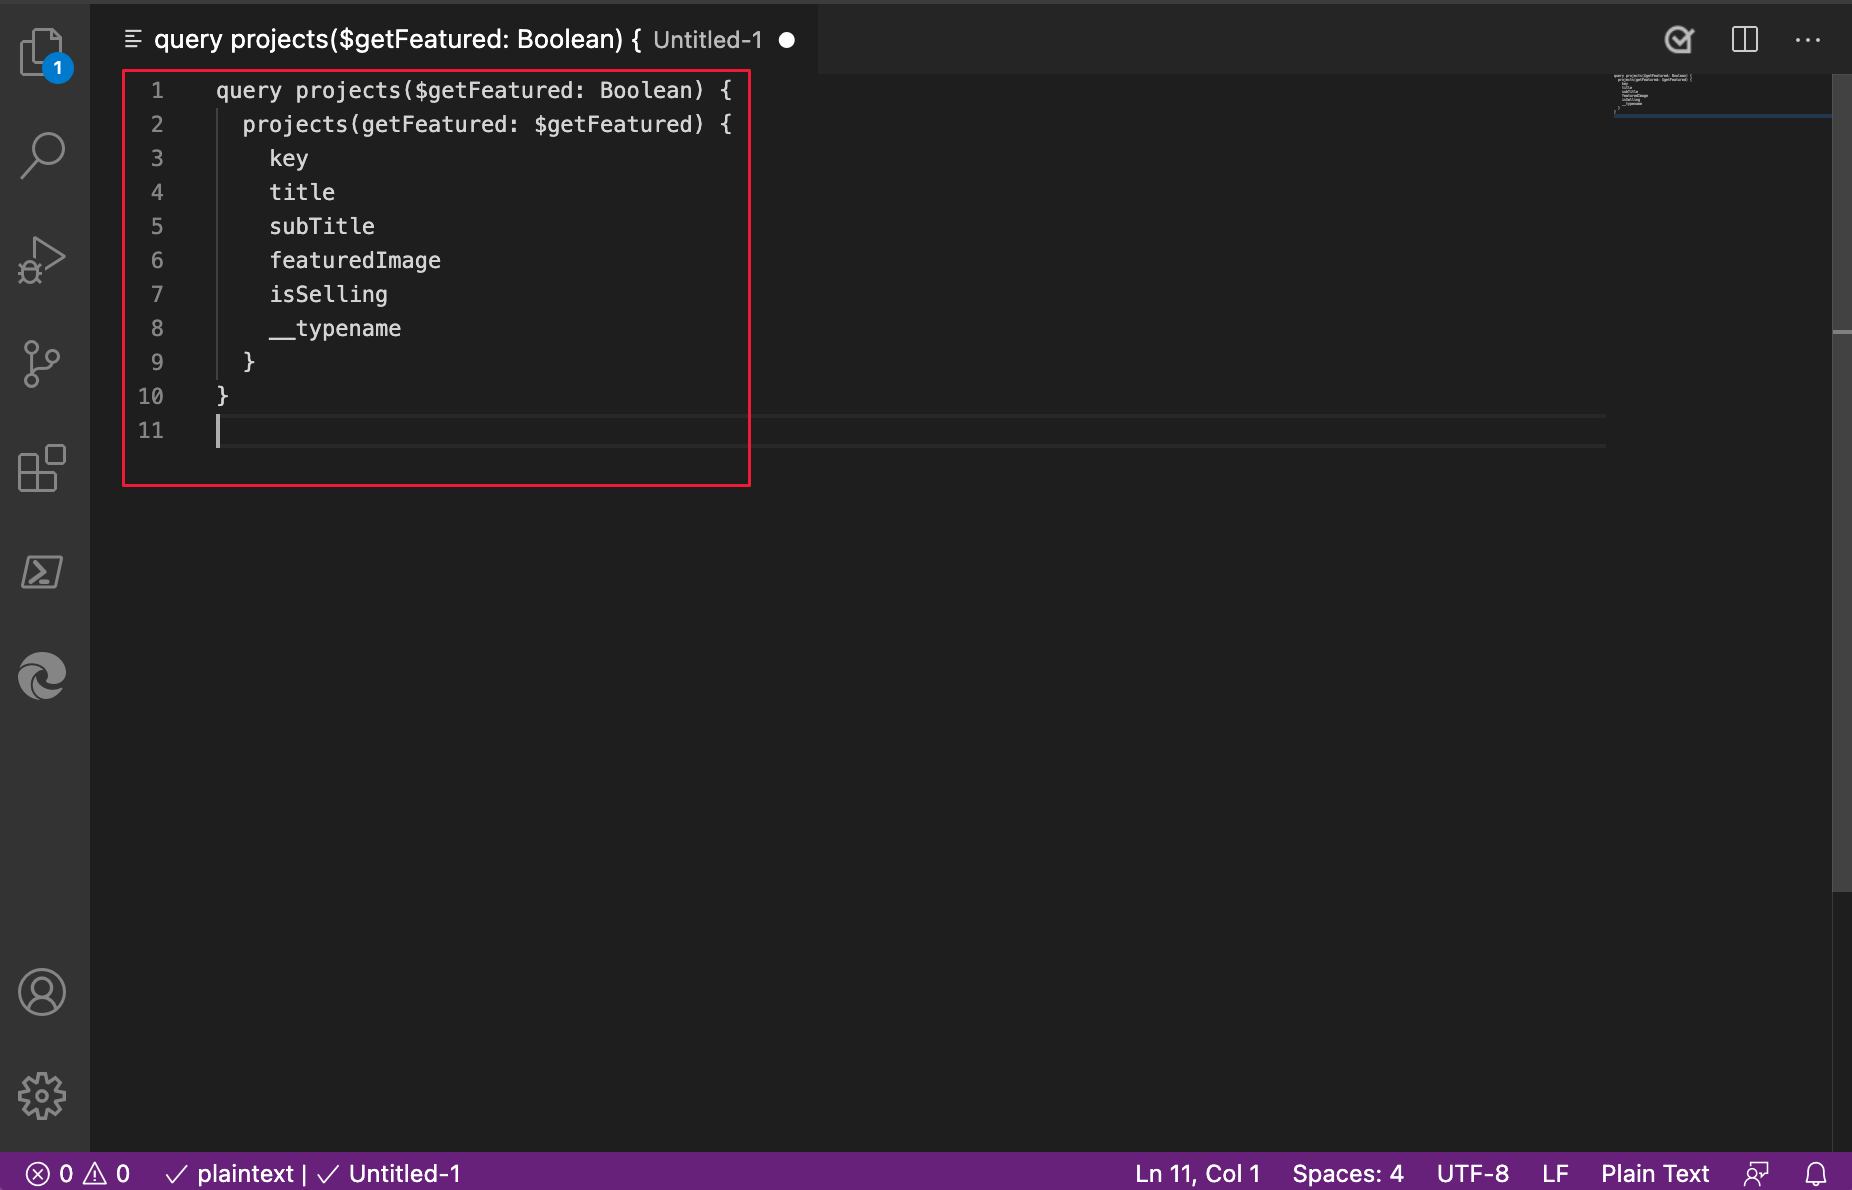
In the Network tool, copy the property value of a network request using the new Copy value option. The property value is copied as a decoded JSON value. In previous versions of Microsoft Edge, you had to copy a value using one of the following actions:
To copy the property value to your clipboard, see Copy formatted response JSON to the clipboard in Network features reference.
Copying a property value in DevTools:
Pasting a property value in Microsoft Visual Studio Code:
See also:
For history, in the Chromium open-source project, see Issue 1132084.
Since Microsoft Edge version 87, you can customize keyboard shortcuts for any action in DevTools. In Microsoft Edge version 88, you can now create multi-press keyboard shortcuts.
For example, the red highlight below shows a custom multi-press keyboard shortcut for the Start recording events action:
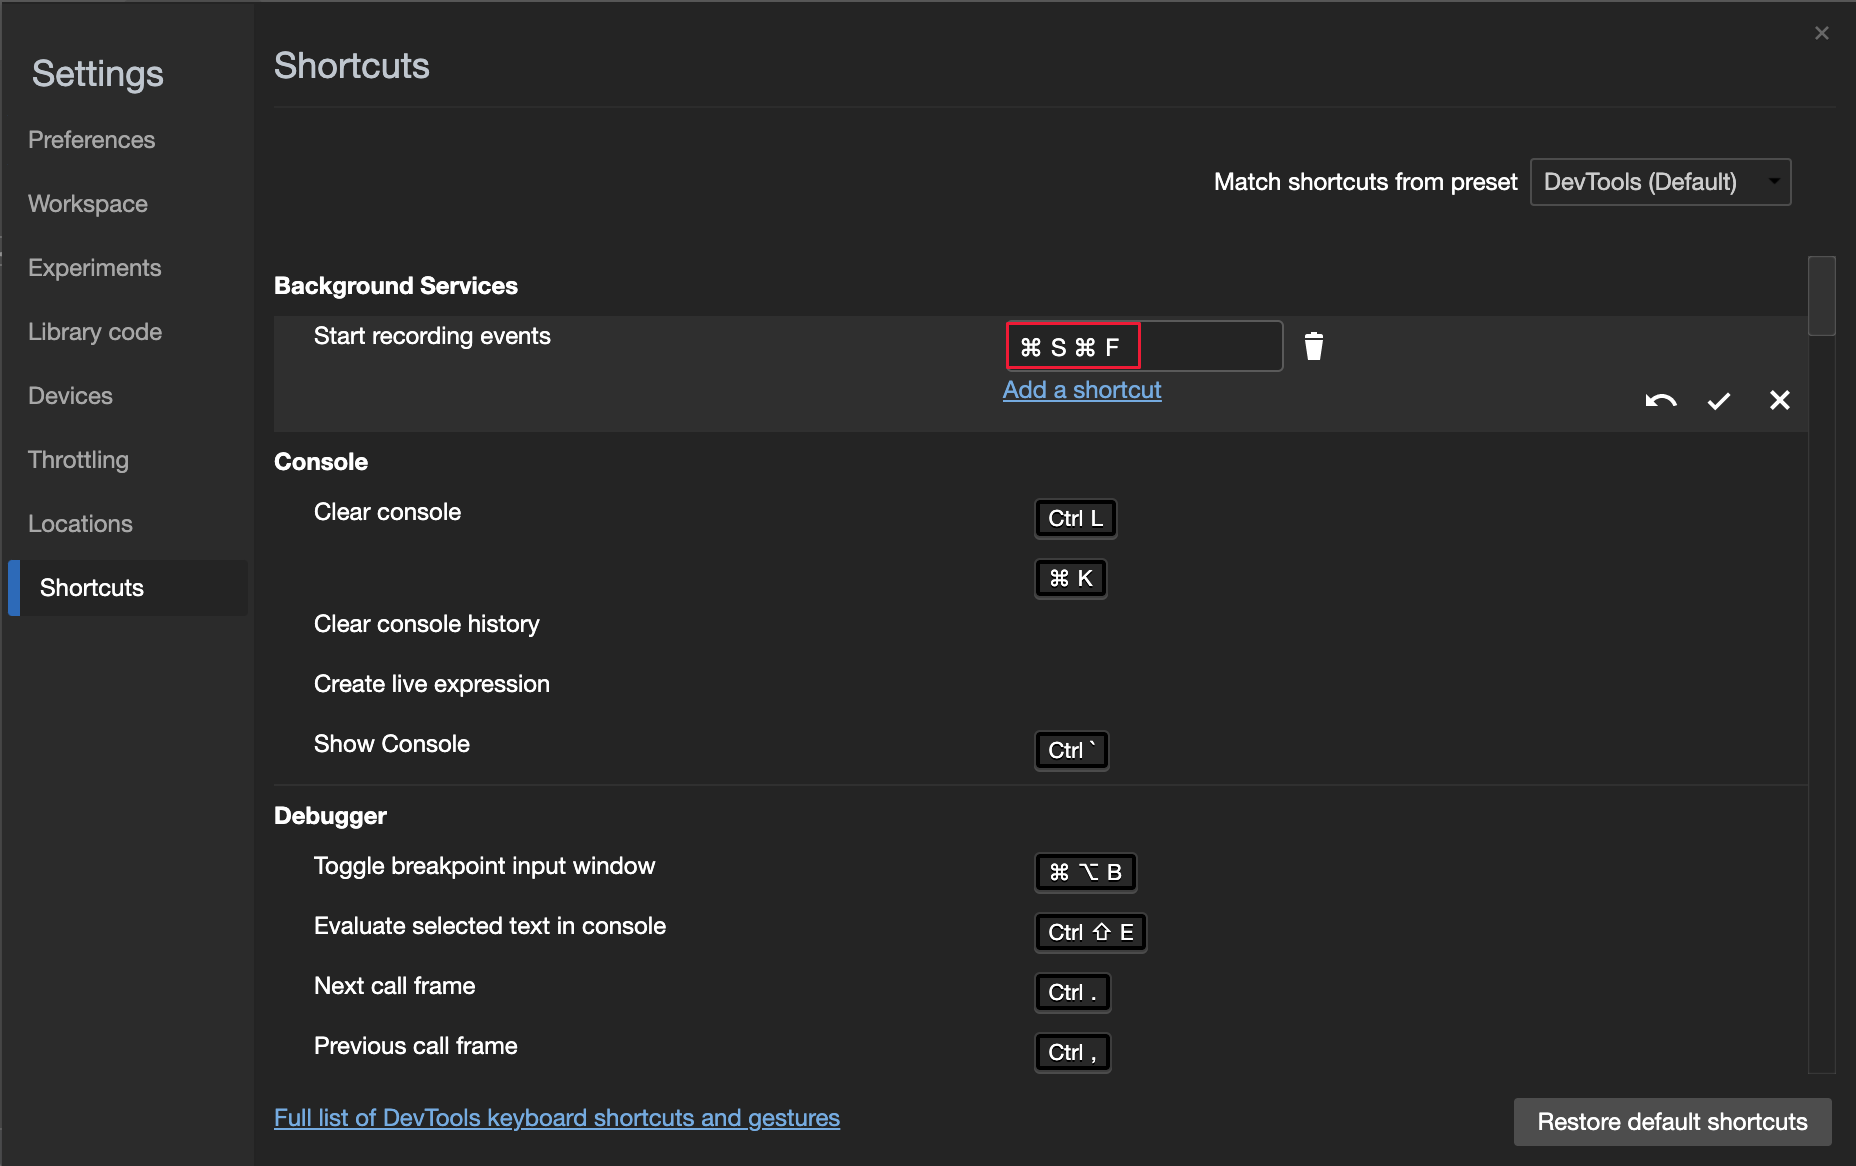
Update: This feature has been released and is no longer experimental.
See also:
For history, in the Chromium open-source project, see Issue #174309.
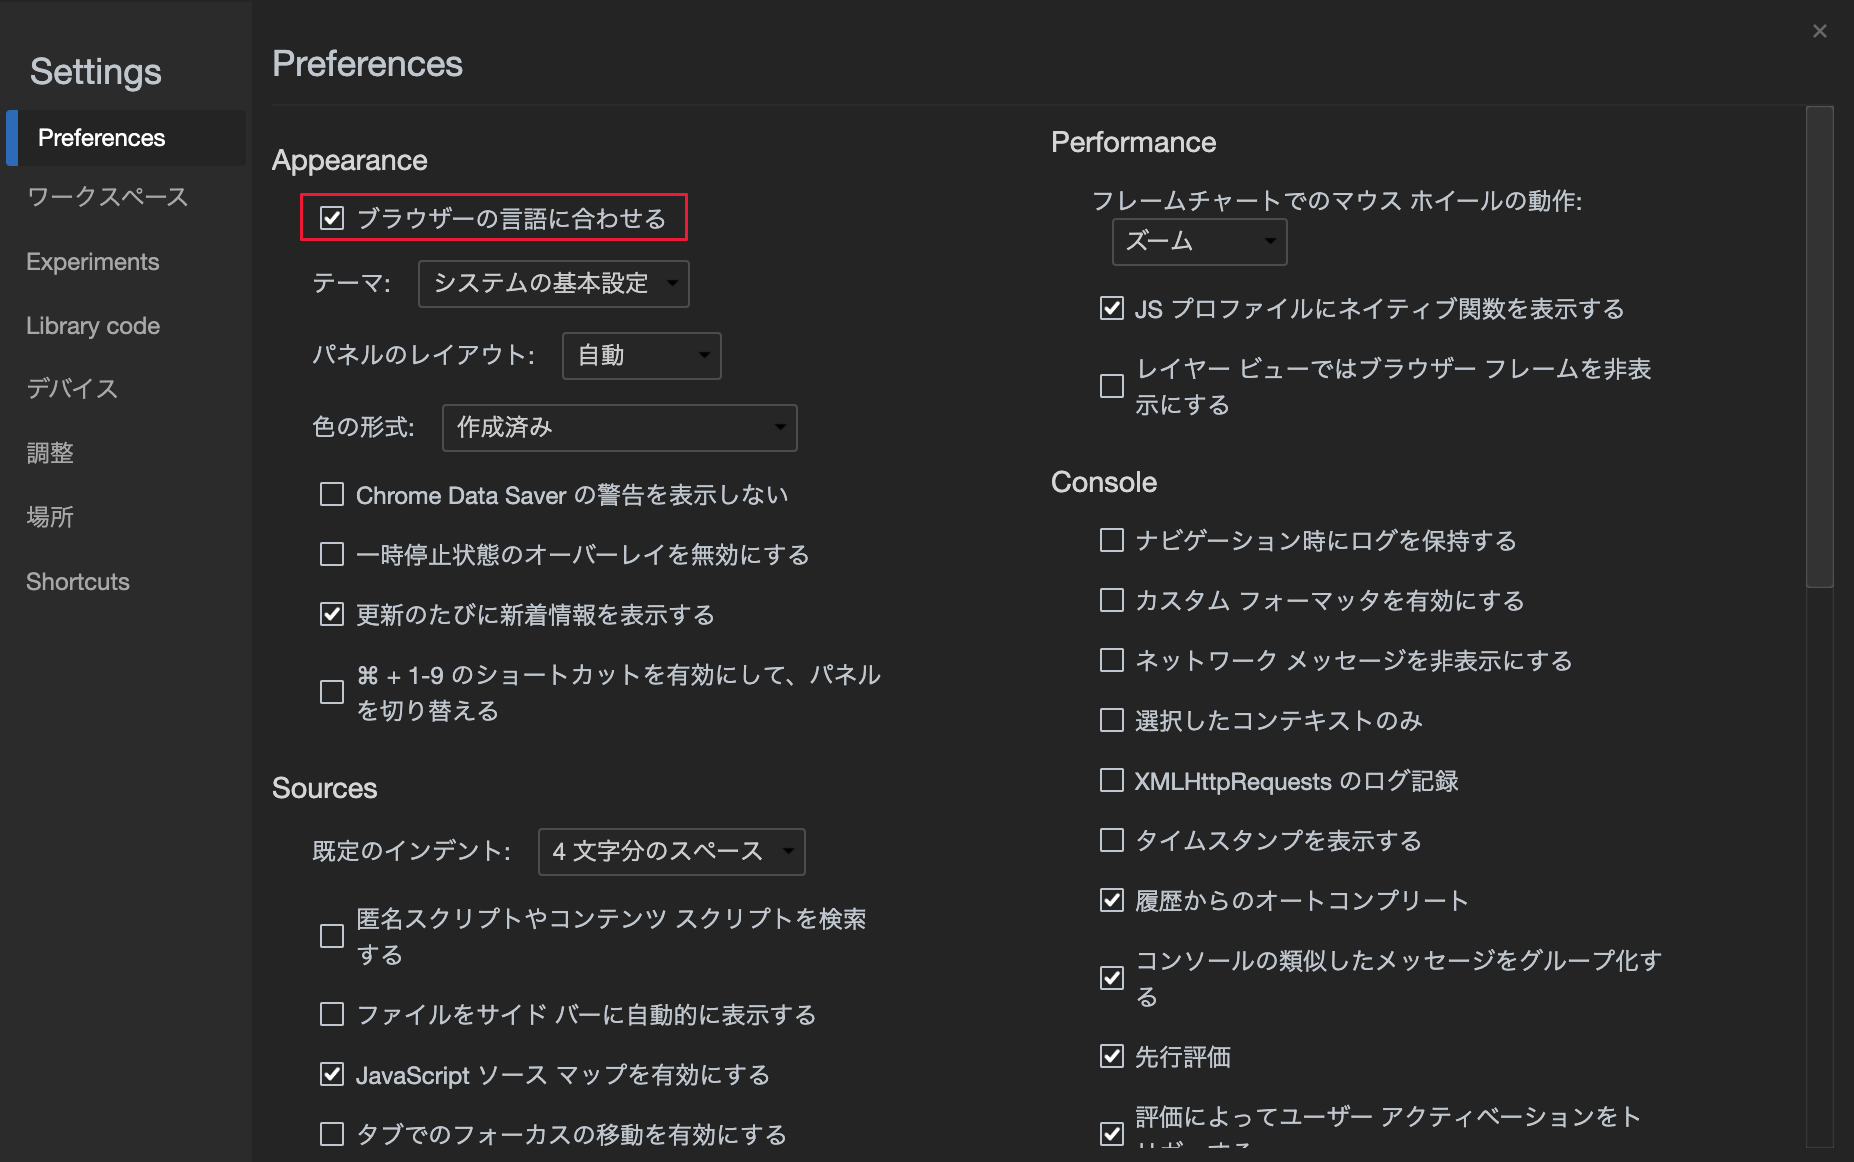
In Microsoft Edge version 87, if you turned on the Match browser language setting in DevTools Settings, the DevTools UI language didn't match the browser UI language. In Microsoft Edge version 88, DevTools now matches the browser language if you turn on the Match browser language setting. See Change DevTools language settings.
The following sections announce additional features available in Microsoft Edge that were contributed to the open-source Chromium project.
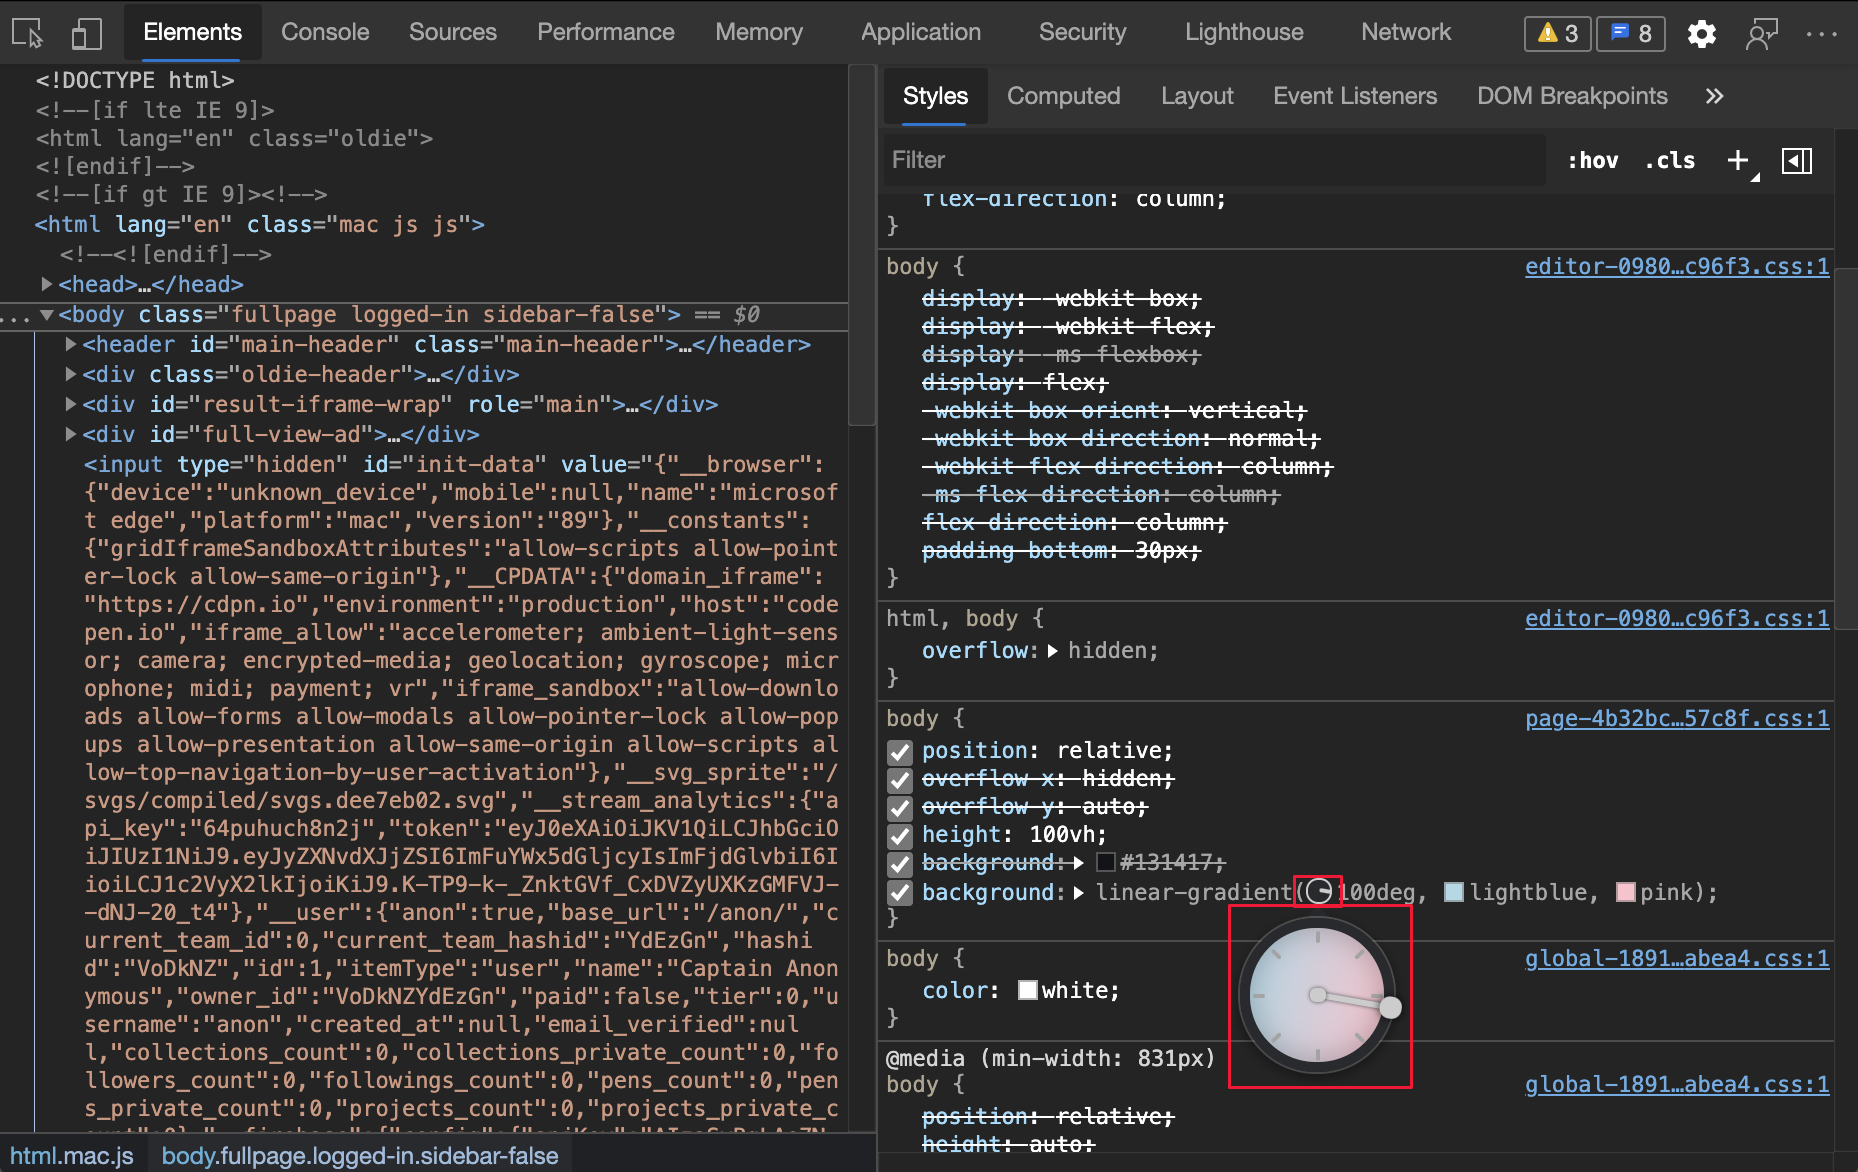
DevTools now has better support for CSS angle debugging. When an HTML element on your page has CSS angle applied to it, a clock icon is displayed next to the angle in the Styles tool. To toggle the clock overlay, click the clock icon. To change the angle, click anywhere in the clock, drag the needle, or use mouse and keyboard shortcuts.
The following CSS angle is used for the example:
background: linear-gradient(100deg, lightblue, pink);
For more information, see Change angle value with the Angle Clock in CSS features reference.
For updates on this feature in the Chromium open-source project, see Issues 1126178 and 1138633.
You can now override storage quota size in the Storage pane. This feature allows you to simulate different devices and test the behavior of your website or app in low disk availability scenarios. To simulate the storage quota:
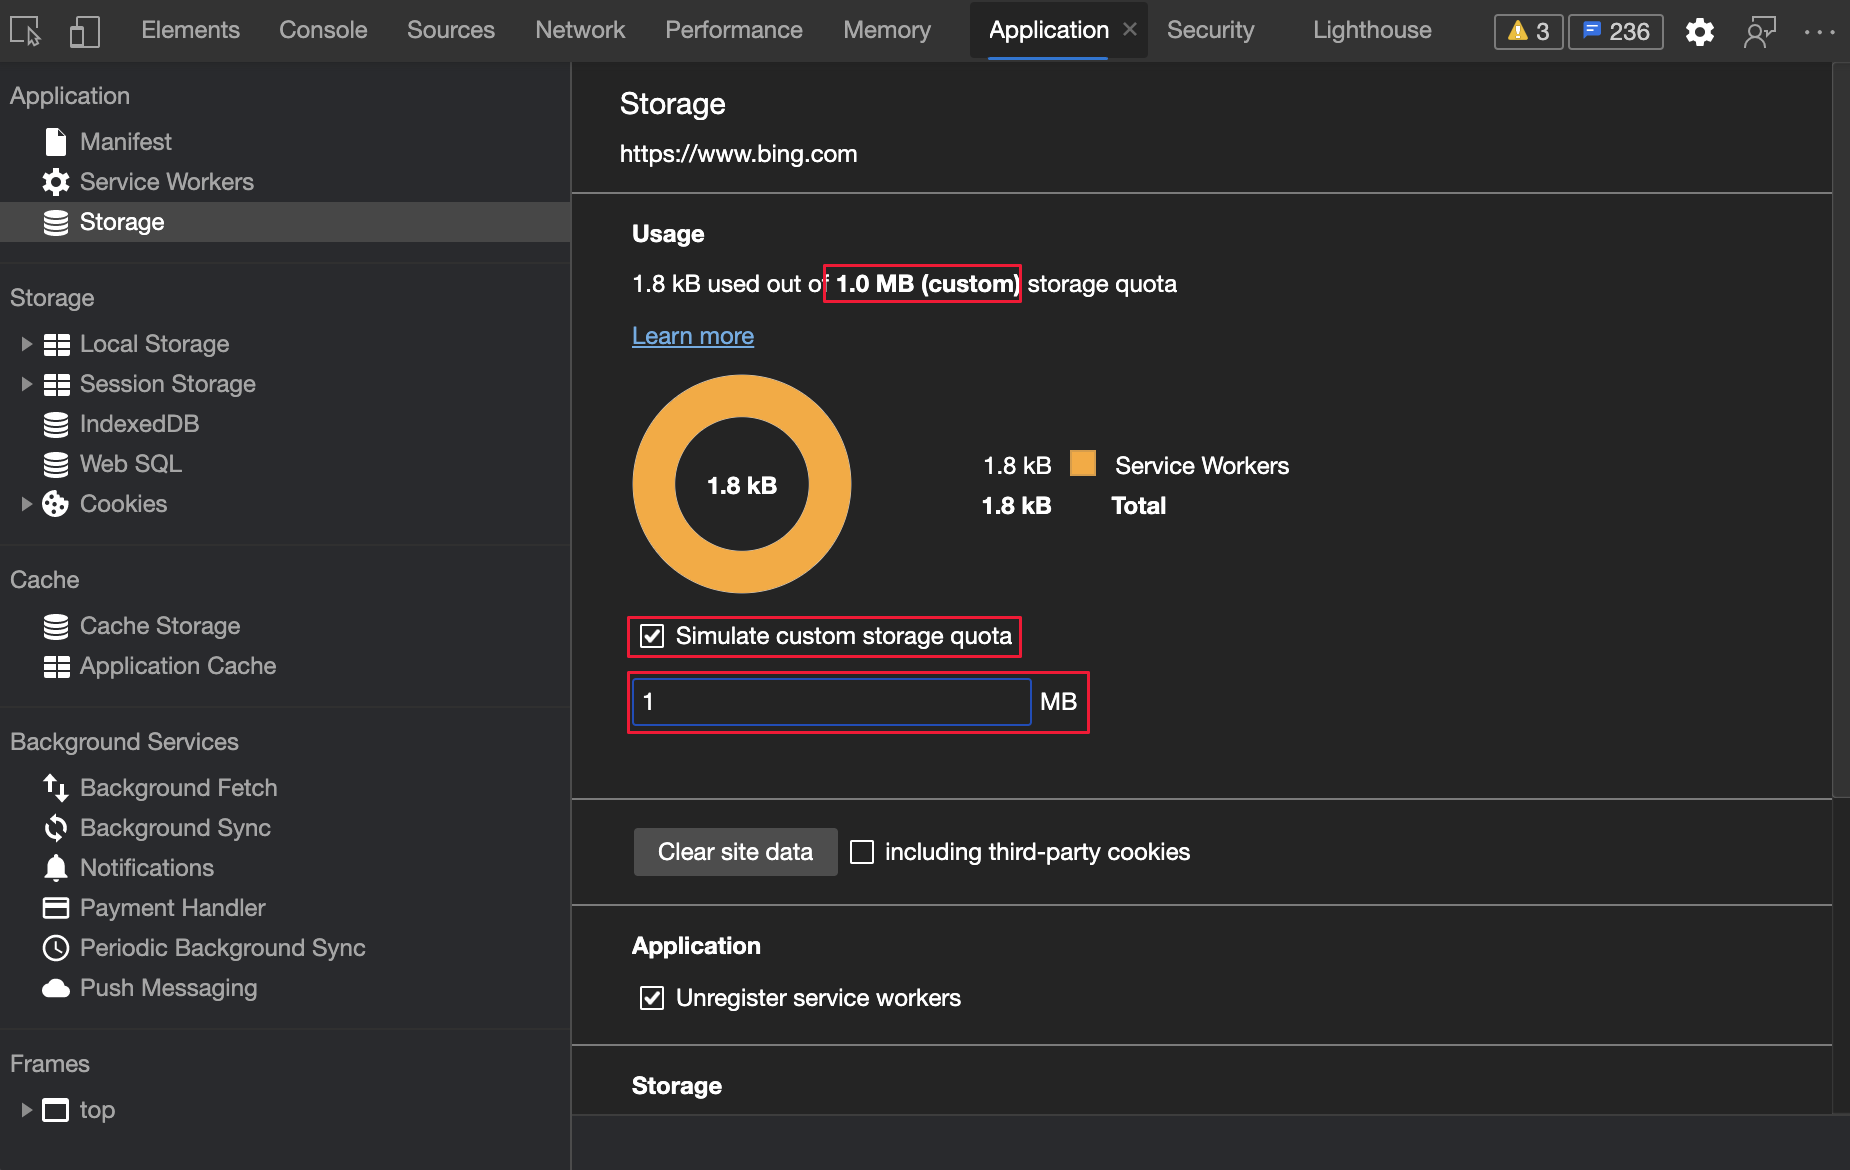
For more information, see Emulate mobile devices (Device Emulation). To see updates on this feature in the Chromium open-source project, see Issues 945786 and 1146985.
Try out this feature by navigating to CORS error demo. Open the Network tool, refresh the page, and observe the failed CORS network request. The status column displays the CORS error. When you hover on the error, the tooltip now displays the error code. In Microsoft Edge version 87 and earlier, DevTools only displayed generic (failed) status for CORS errors.
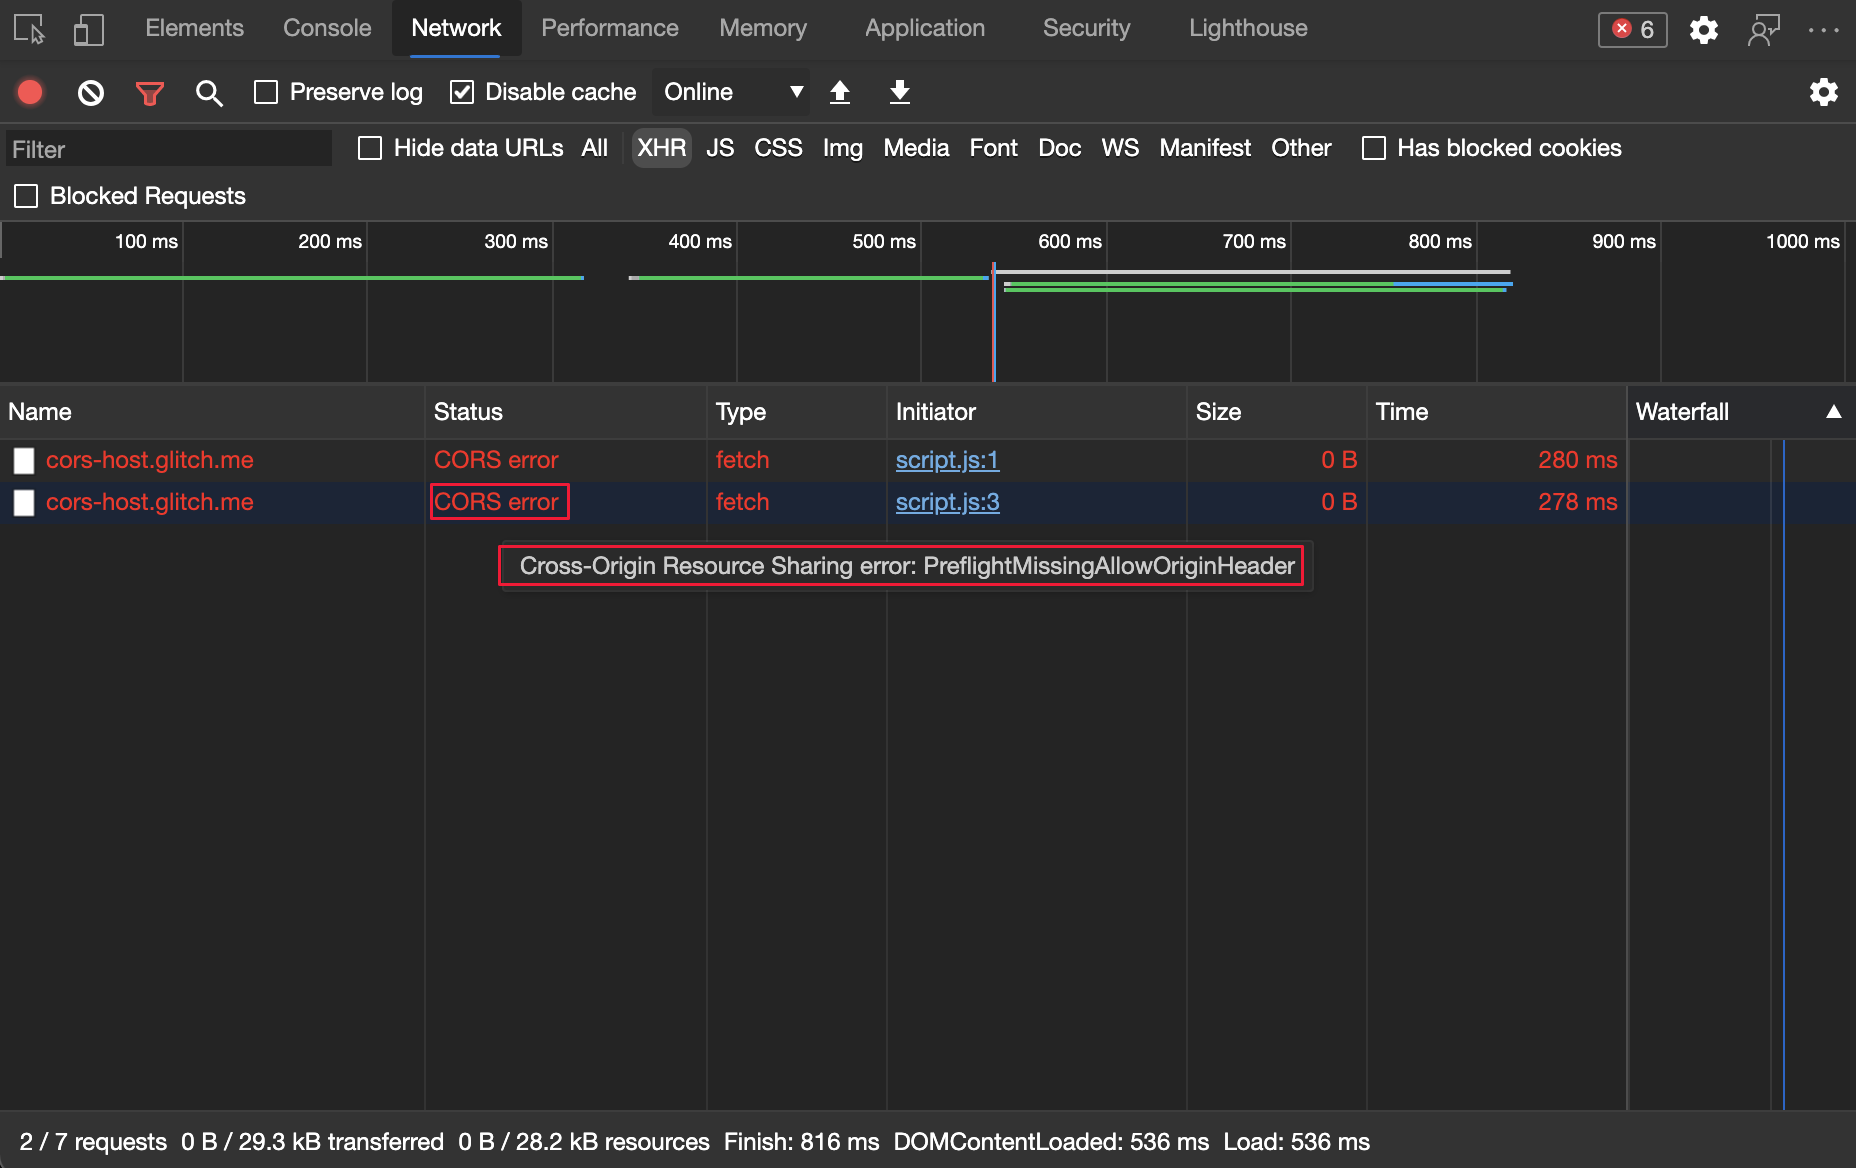
For real-time updates on this feature in the Chromium open-source project, see Issue 1141824.
See also:
In the Application tool, there's a Frames section that provides a detailed view for each frame.
See also:
In the Application tool, there's a Frames section that provides a detailed view for each frame. When you select a frame, the frame detail page appears, including the Security & Isolation section.
The cross-origin isolated status is now displayed under the Security & Isolation section. The new API availability section displays the availability of SharedArrayBuffers (SAB) and whether the buffers can be shared using postMessage(). A deprecation warning appears if the SAB and postMessage() is currently available, but the context isn't cross-origin isolated.
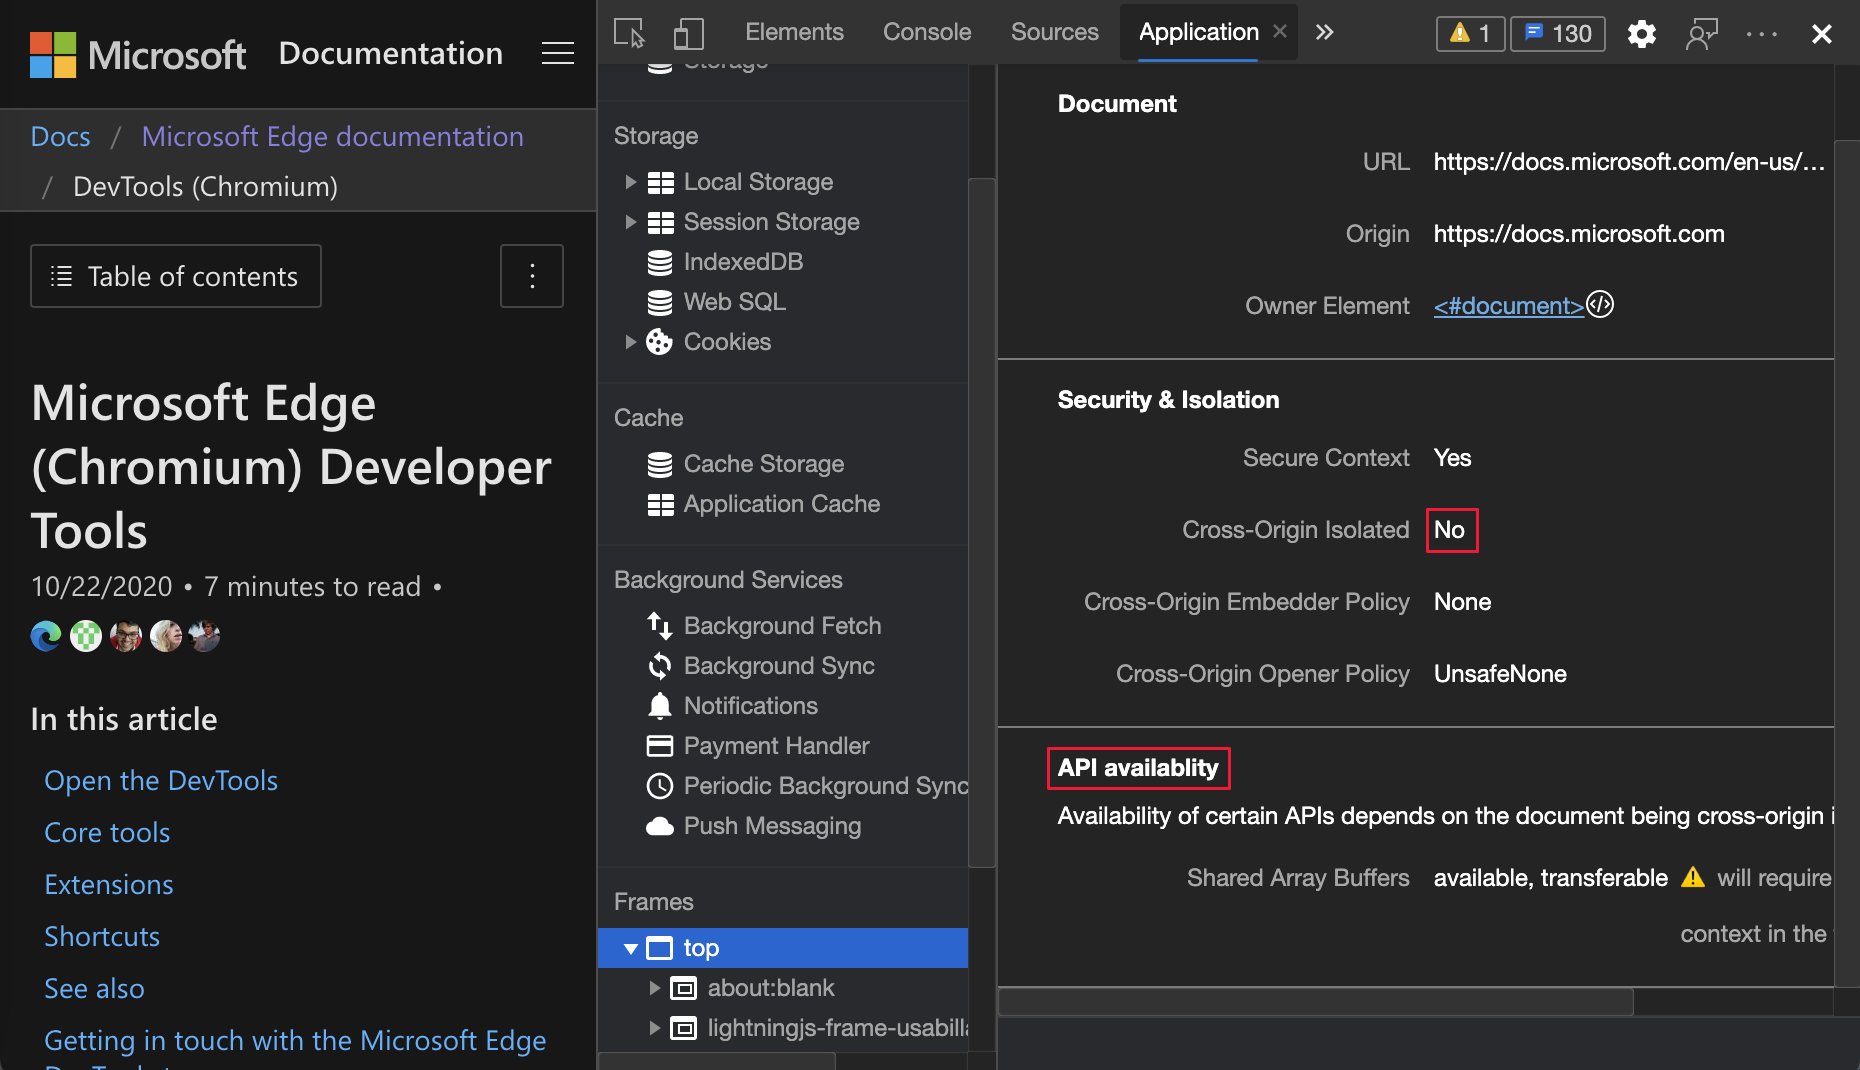
For more information about cross-origin isolation and why it is required for features like SharedArrayBuffers, see WindowOrWorkerGlobalScope.crossOriginIsolated.
For real-time updates of this feature in the Chromium open-source project, see Issue 1139899.
See also:
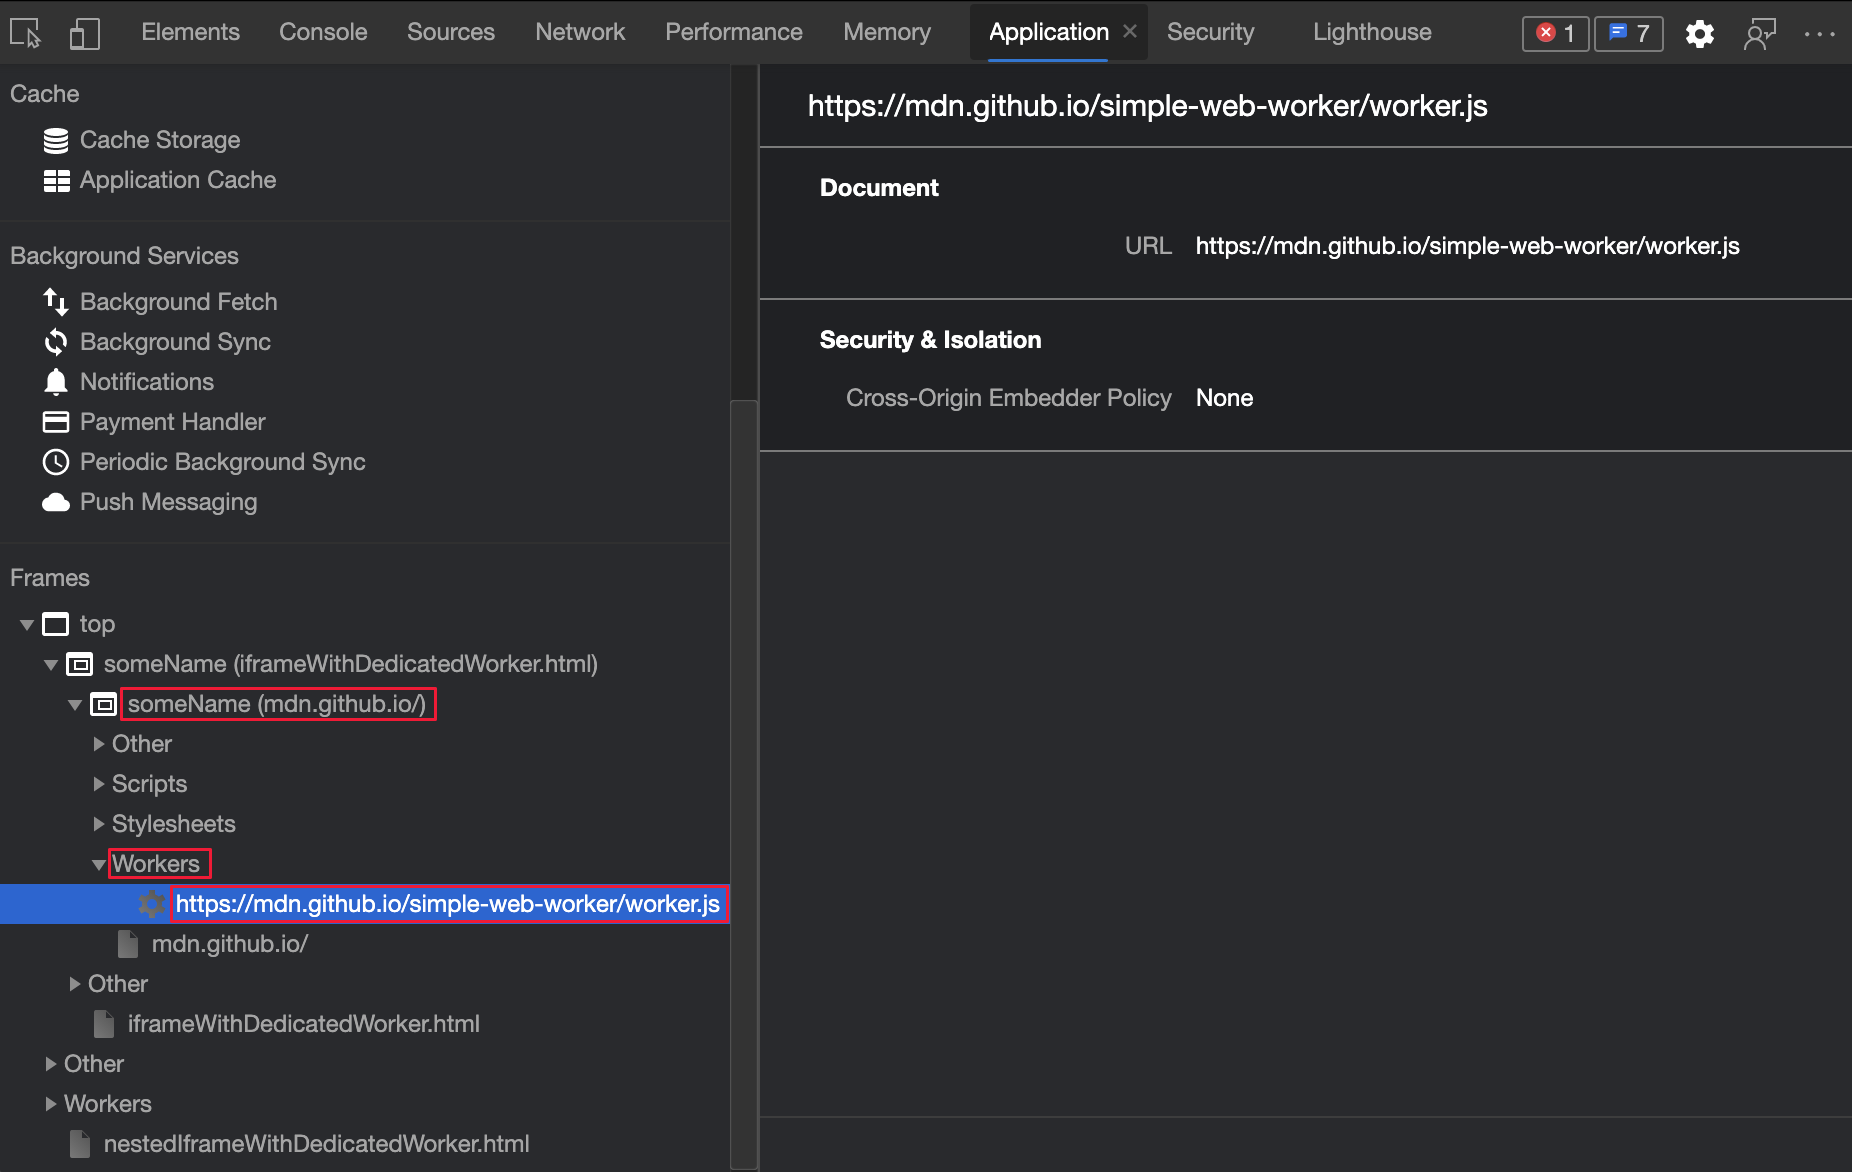
DevTools now organizes web workers under the relevant parent frame. For example, if the someName frame creates worker.js, then worker.js appears under someName in the Frames list. To view the details of the web worker:
For real-time updates on this feature in the Chromium open-source project, see Issues 1122507 and 1051466.
See also:
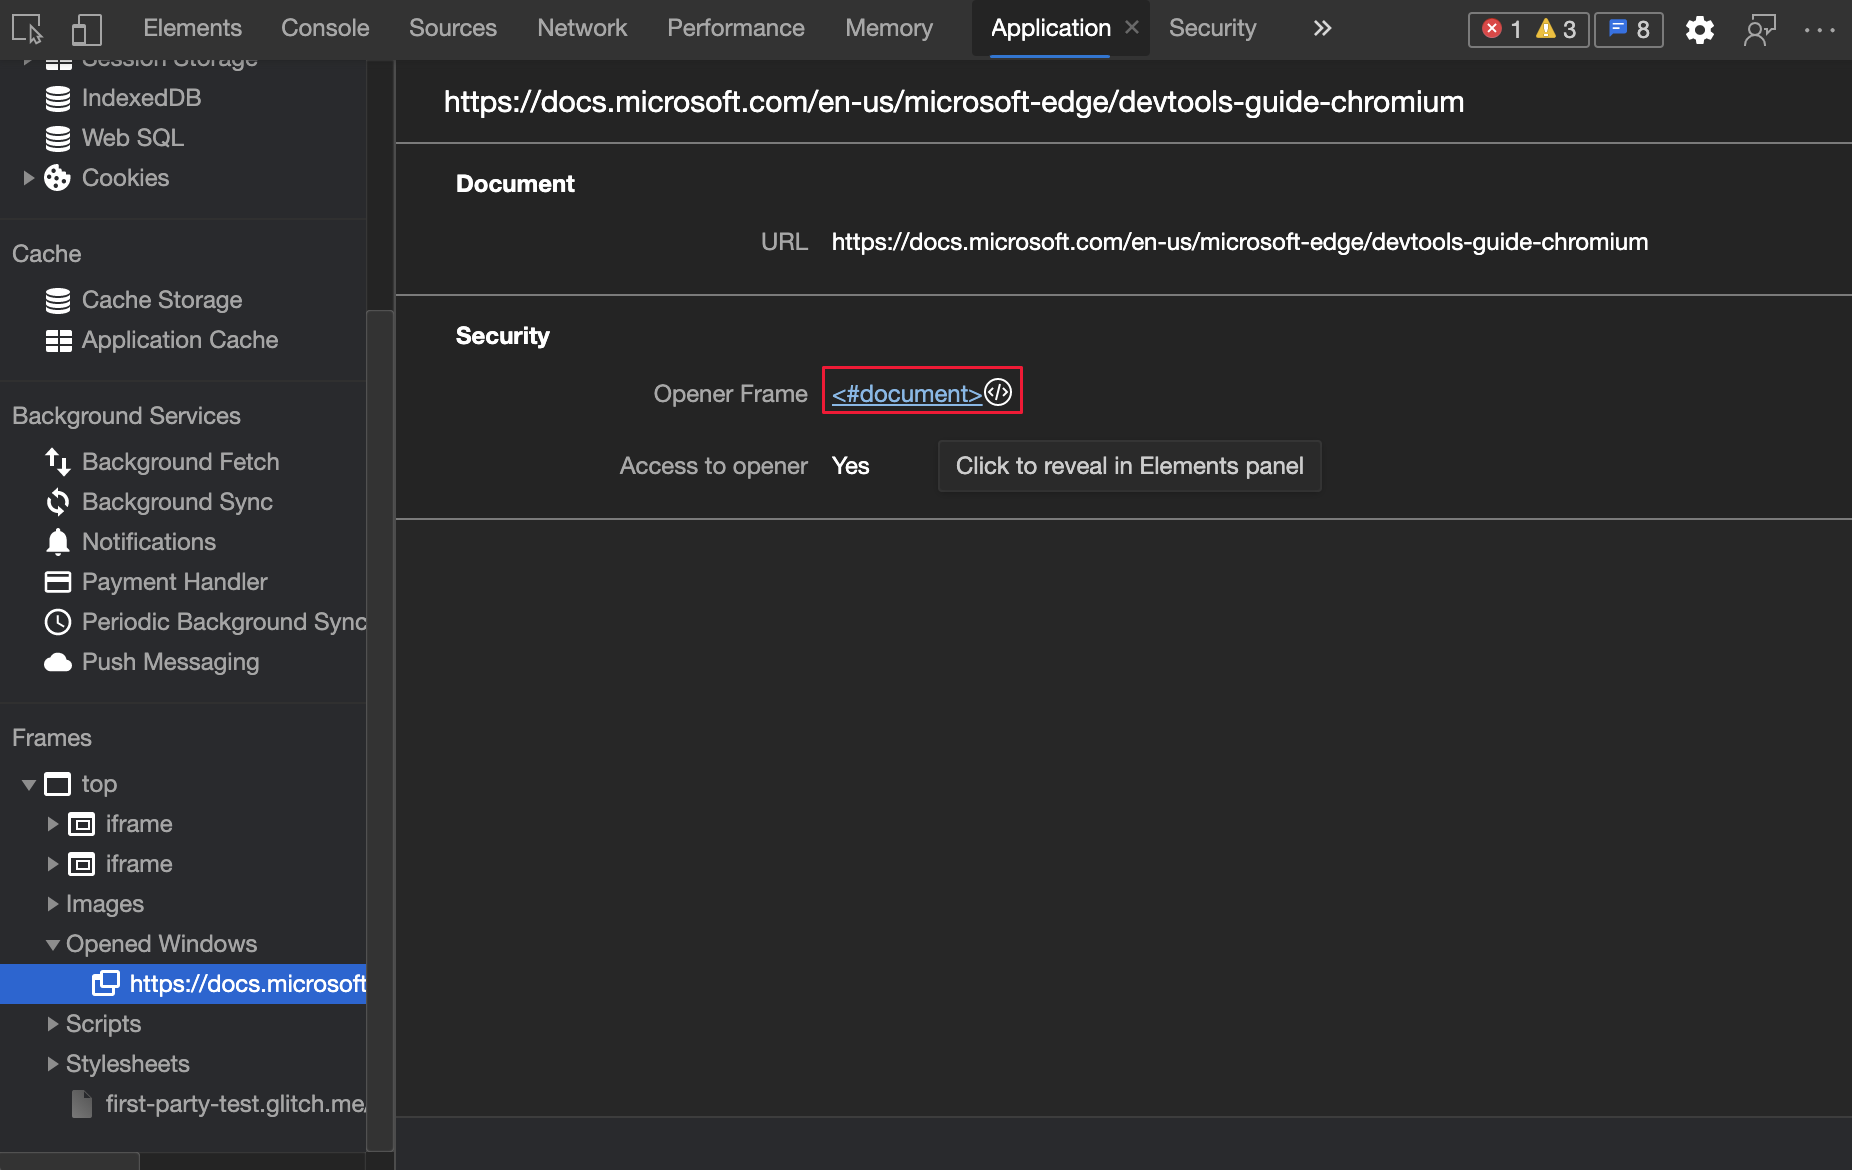
DevTools now organizes opened Windows under the relevant parent frame. For example, if the top frame opens a Window to https://learn.microsoft.com/microsoft-edge/devtools-guide-chromium, then the Window appears under top in the Frames list.
To reveal the frame that's responsible for opening another Window, and see that frame in the Elements tool:
Window for the parent frame you want to know about.The details are displayed about which frame caused the opening of another Window. To reveal the opener in the Elements tool:
Window details.For the history of this feature in the Chromium open-source project, see Issue 1107766.
See also:
In the Network tool, to copy the stacktrace to your clipboard, right-click the stacktrace, and then select Copy > Copy stacktrace:
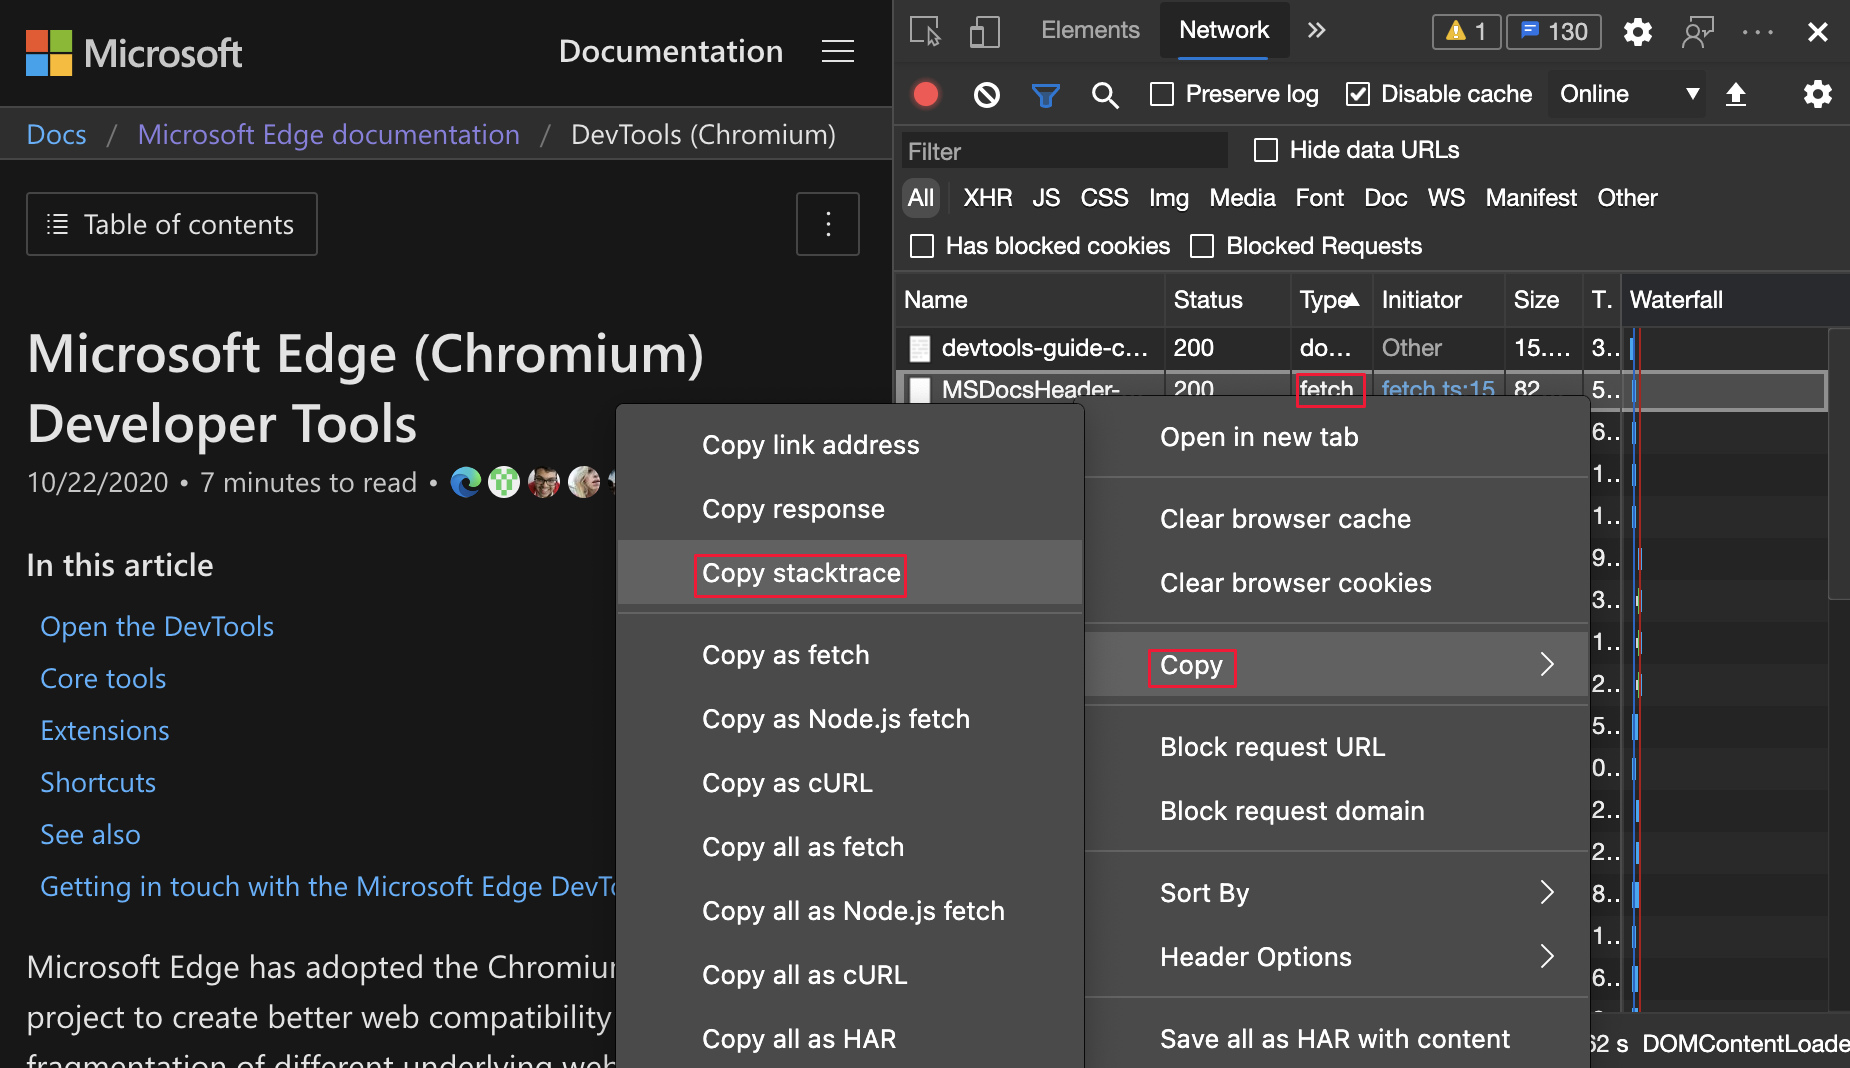
For the history of this feature in the Chromium open-source project, see Issue 1139615.
See also:
In the Sources tool, use this feature to see the value of a WebAssembly (Wasm) variable when your code is paused. To display the current value of a variable, hover on a variable:
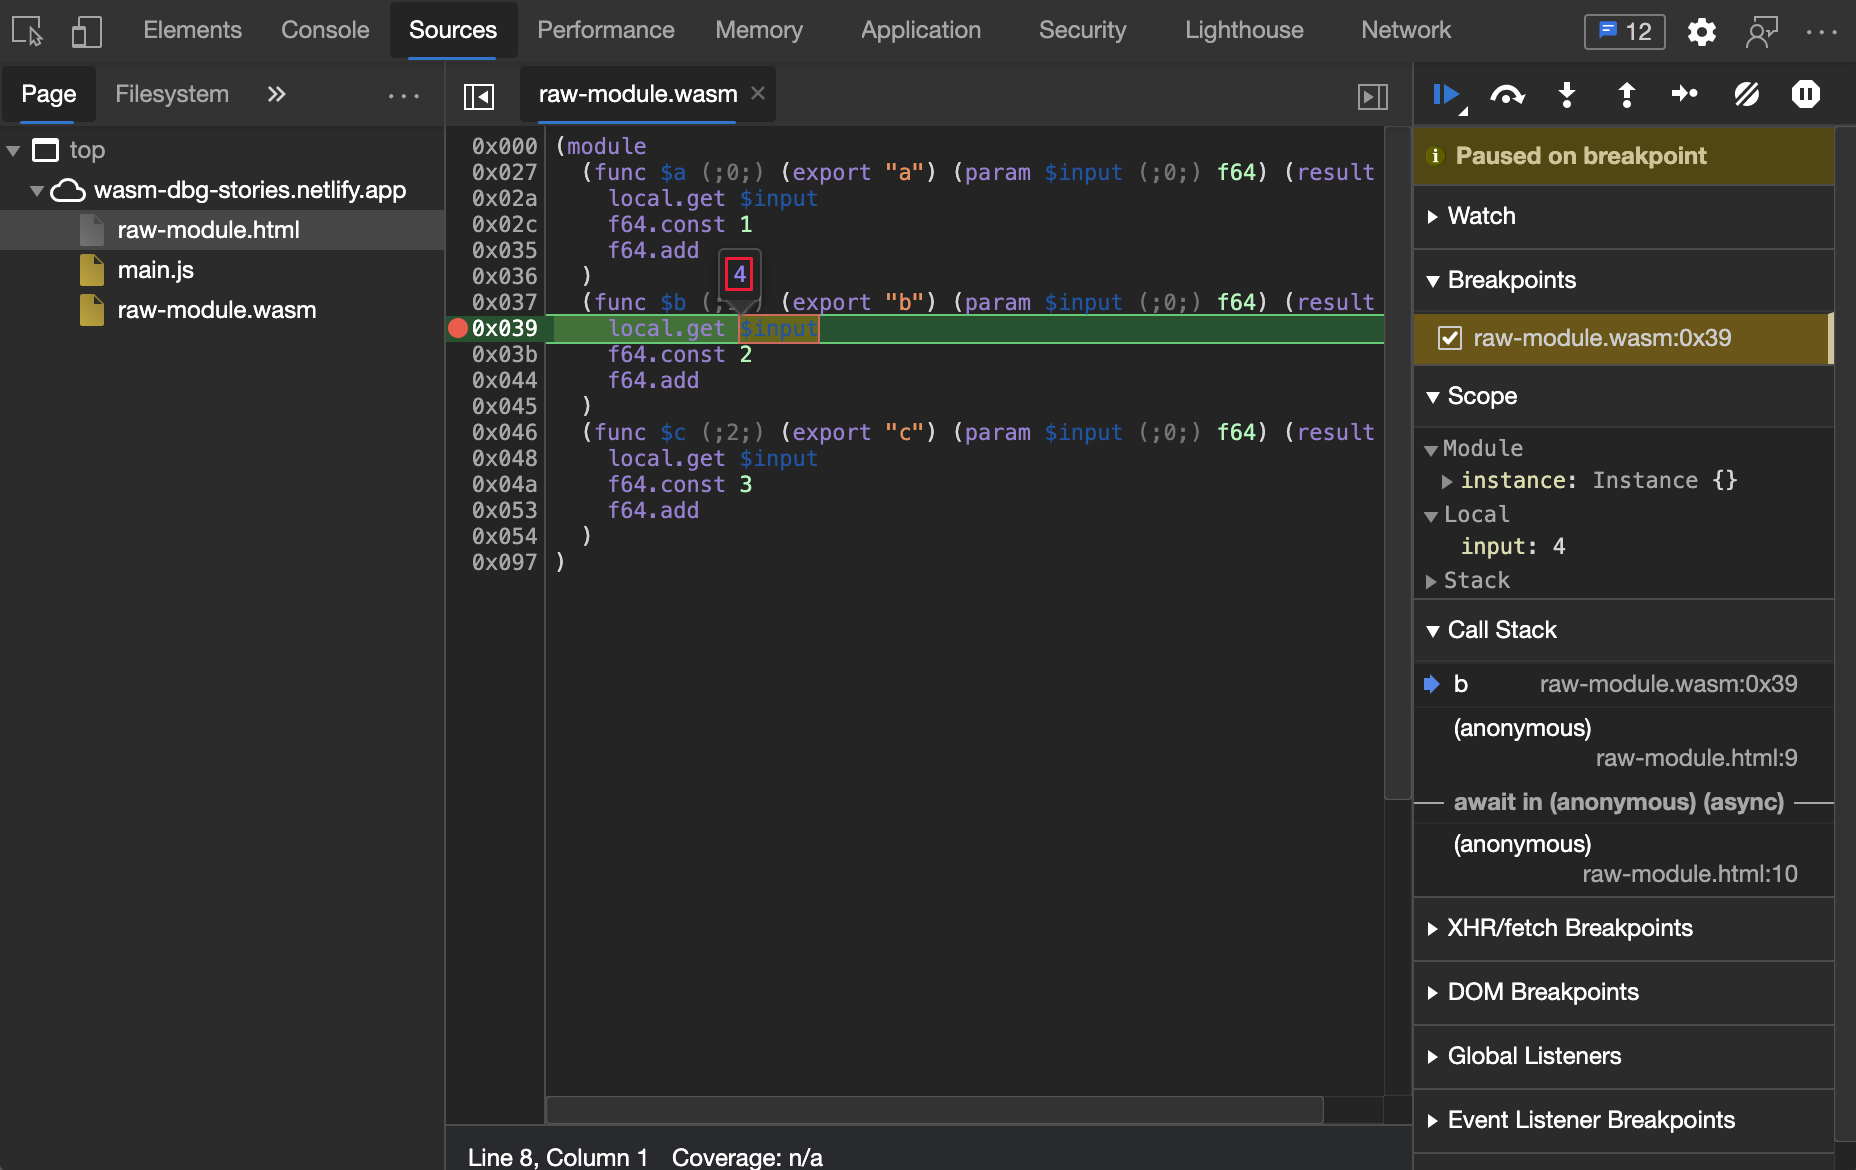
For real-time updates on this feature in the Chromium open-source project, see Issues 1058836 and 1071432.
See also:
DevTools now consistently uses kB for displaying sizes of files and memory. Previously, DevTools mixed kB and KiB.
kB or kilobyte (10^3 or 1000 bytes)KiB or kibibyte (2^10 or 1024 bytes)For example, the Network tool previously used kB in the labels, but used KiB in calculations. Your feedback showed that this inconsistency caused confusion.
For the history of this feature in the Chromium open-source project, see Issue 1035309.
Note
Portions of this page are modifications based on work created and shared by Google and used according to terms described in the Creative Commons Attribution 4.0 International License. The original page is found here and is authored by Jecelyn Yeen.
![]() This work is licensed under a Creative Commons Attribution 4.0 International License.
This work is licensed under a Creative Commons Attribution 4.0 International License.
Training
Learning path
Use advance techniques in canvas apps to perform custom updates and optimization - Training
Use advance techniques in canvas apps to perform custom updates and optimization