Note
Access to this page requires authorization. You can try signing in or changing directories.
Access to this page requires authorization. You can try changing directories.
These are the latest features in the Stable release of Microsoft Edge DevTools.
Video: Microsoft Edge | What's New in DevTools 100
Join the Microsoft Edge DevTools community at GitHub
We're excited to announce the new MicrosoftEdge > DevTools repo at GitHub! This new repo is a place for our community of developers to send us ideas, feedback, suggestions, and tips to improve DevTools. We're eager to discuss with you how DevTools can better serve your needs and meet the challenges you face every day in building great web experiences.
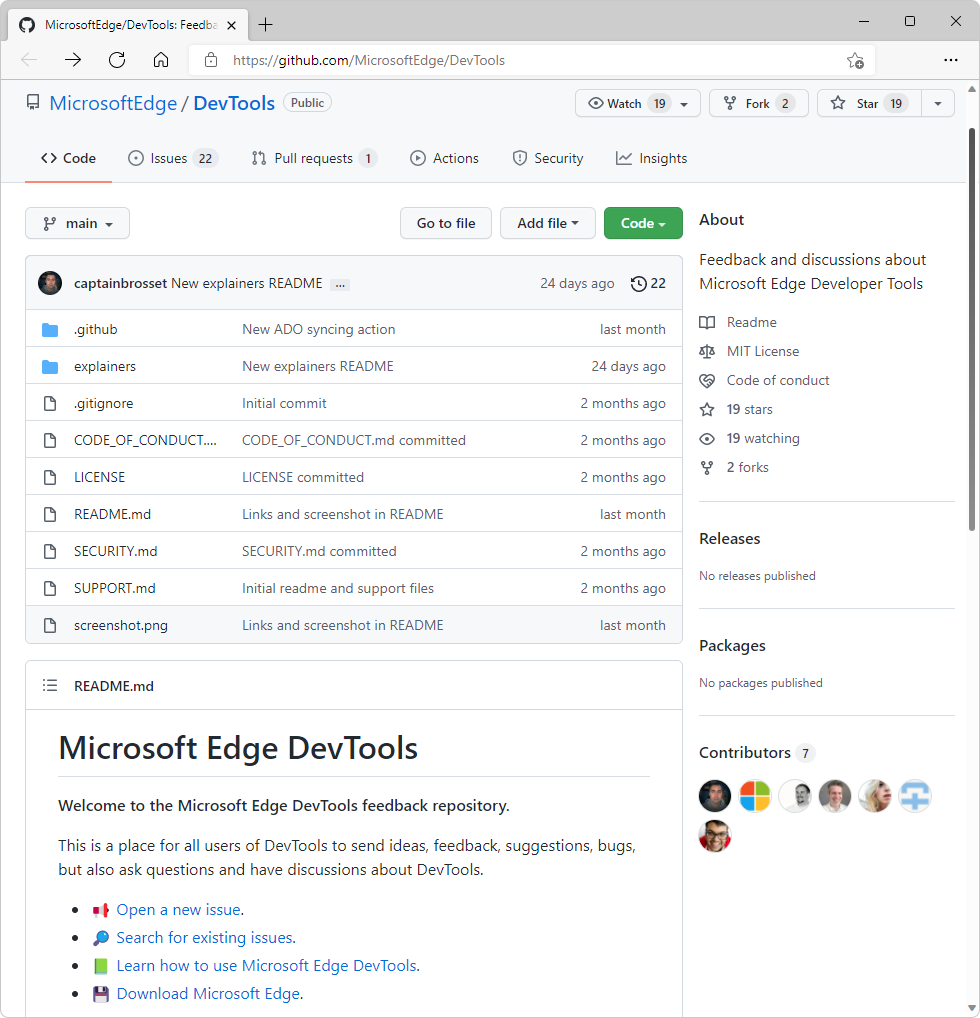
Head to our DevTools repo at GitHub to become a part of the Edge DevTools community.
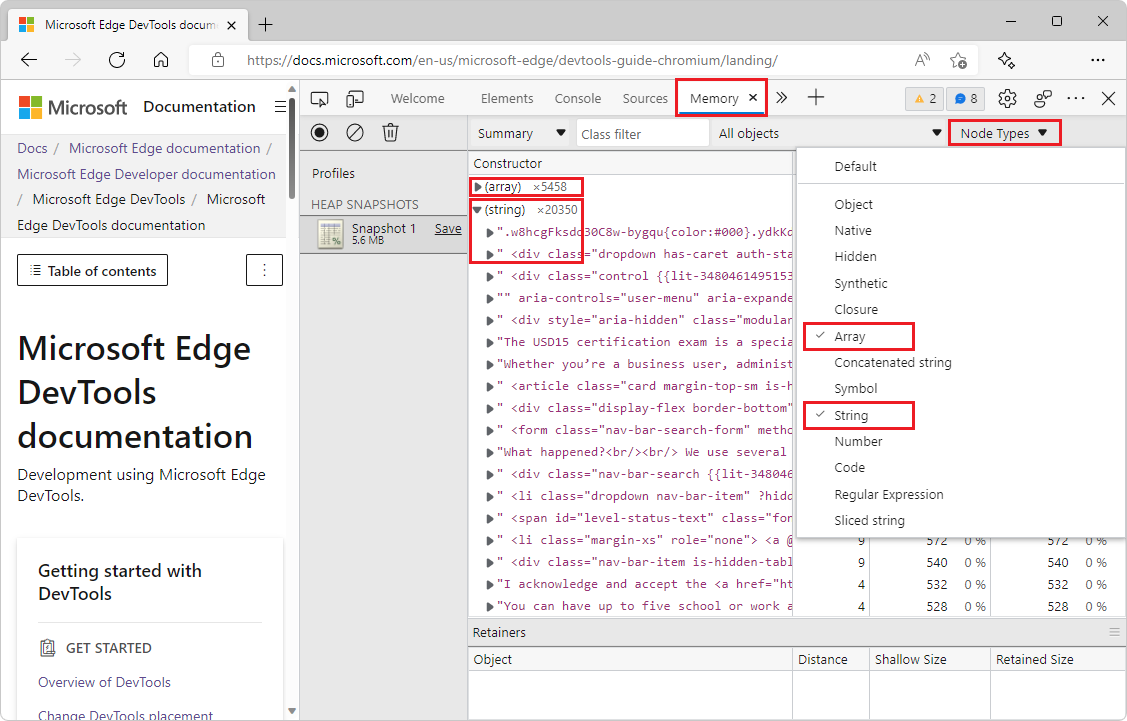
Filter heap snapshots summary by node type
When looking at all the objects in a heap snapshot in the Memory tool, it can be difficult to focus on specific objects or retaining paths. Now in Microsoft Edge 100, you can use the new Node Types filter when looking at a heap snapshot, to focus on only specific types of nodes. For example, to see only the arrays and string objects that are in the heap, select the Array and String entries in the Node Types filter:
See also:
- Record heap snapshots using the Memory tool ("Heap snapshot" profiling type) - taking a heap snapshot and analyzing the heap.
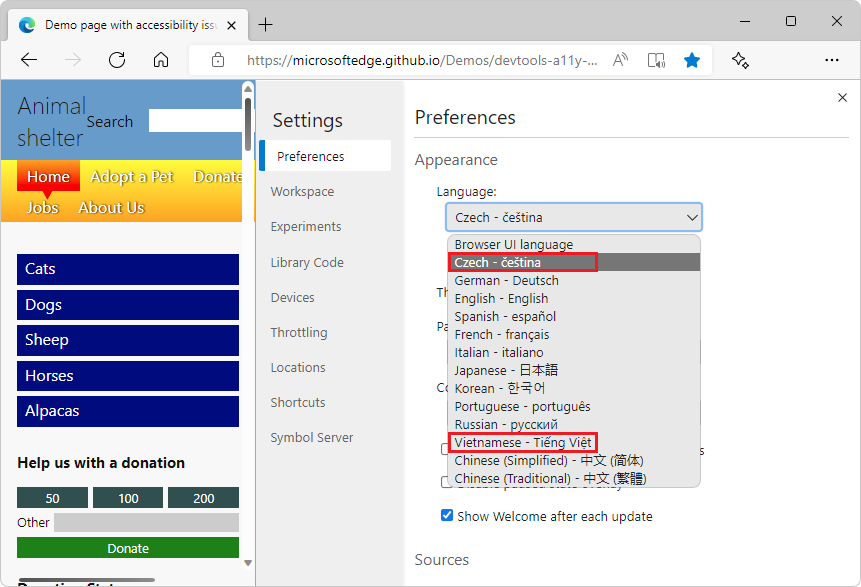
Use DevTools in Czech and Vietnamese
Customizing and simplifying the developer experience includes making our tools available to everyone, regardless of their preferred language. We've added two new languages, Czech and Vietnamese, to our list of supported languages, and will keep adding more. If your preferred language isn't supported in DevTools, let us know!
See also:
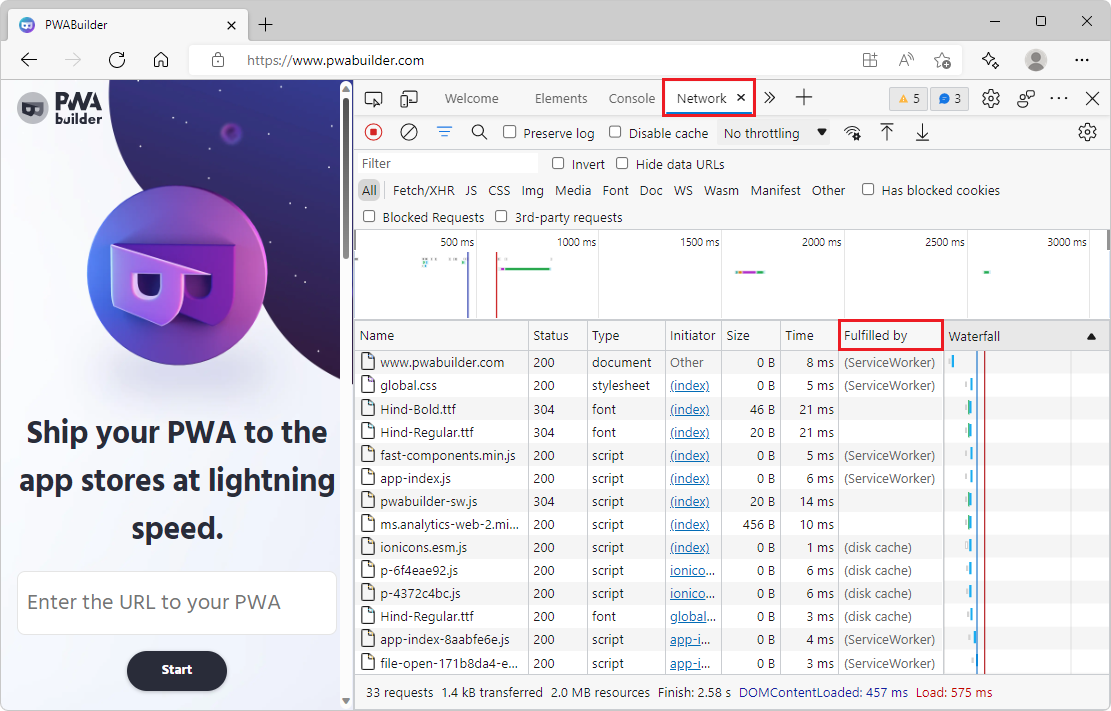
The Network tool now displays how a request was fulfilled
In Microsoft Edge 100, the Network tool supports a new Fulfilled by column in the request log. If the request was fulfilled by your service worker or from the cache, that information is now tracked in the Fulfilled by column. When exporting or importing the request log as a HAR file, the information in the Fulfilled by column is also included.
See also:
- Filter requests by properties in Network features reference.
- Service worker improvements.
For the history of this feature, see Issue #16.
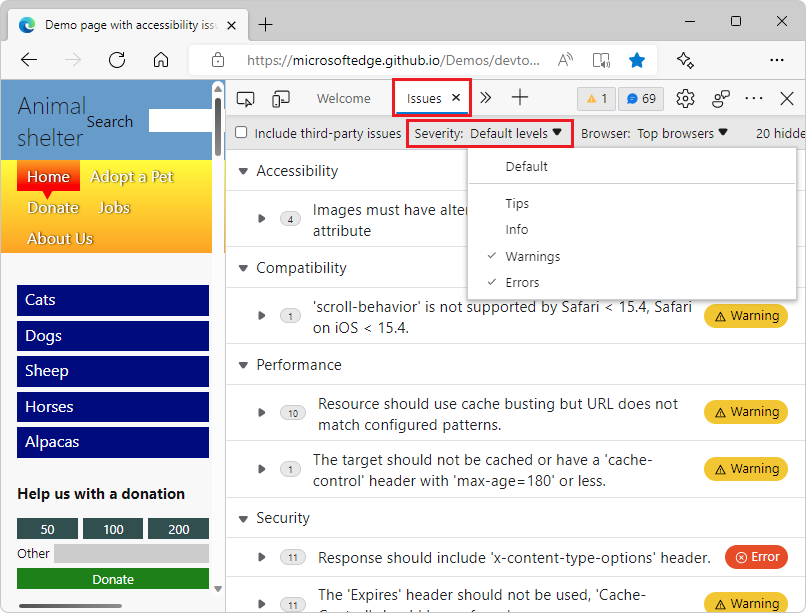
Filter messages in the Issues tool by severity and browser target
In the Issues tool, the new Severity and Browser dropdown lists allow you to filter messages by severity and browser target, to help you focus on the most relevant feedback. You can select or clear the options in each dropdown list.
To see all relevant messages, you might need to refresh the page. If prompted, in the Issues tool, click the Regenerate issues button.
By default, the Severity filter is set to show only warnings and errors:
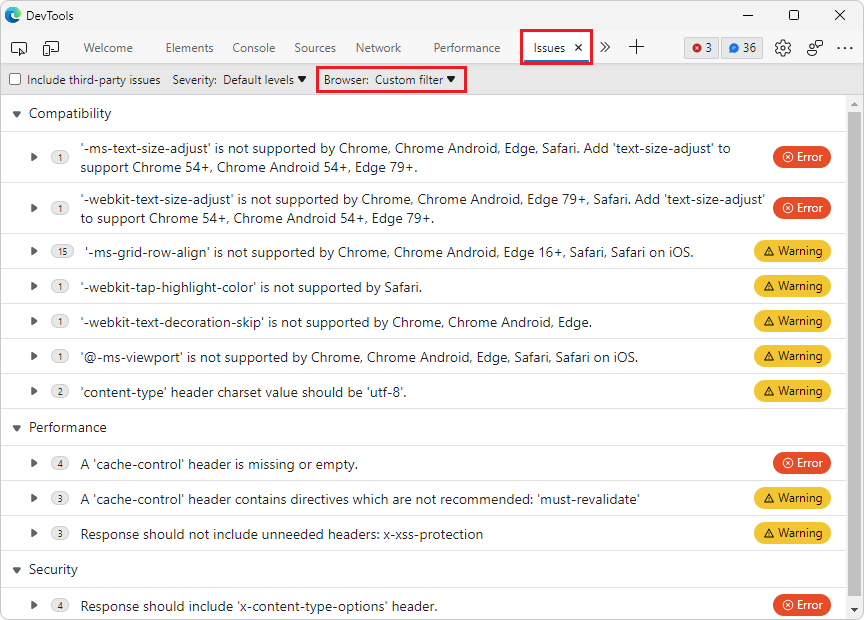
The Browser filter only applies to browser compatibility feedback, which is shown in the Compatibility section of the Issues list. By default, the Browser filter shows messages for the top browsers, as defined by Browserslist:
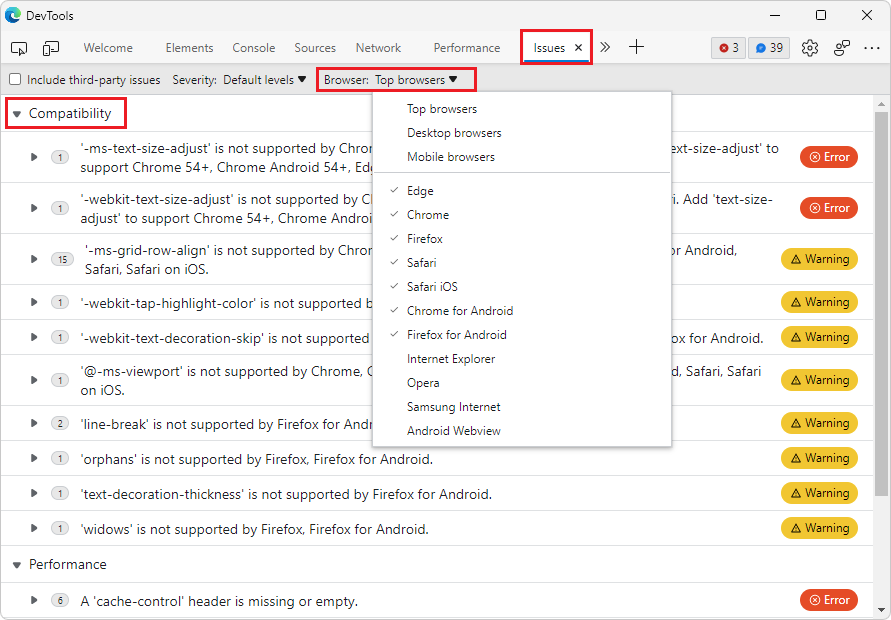
In the following example, messages about Firefox and Firefox for Android are filtered out:
See also:
- Filter issues in Find and fix problems using the Issues tool.
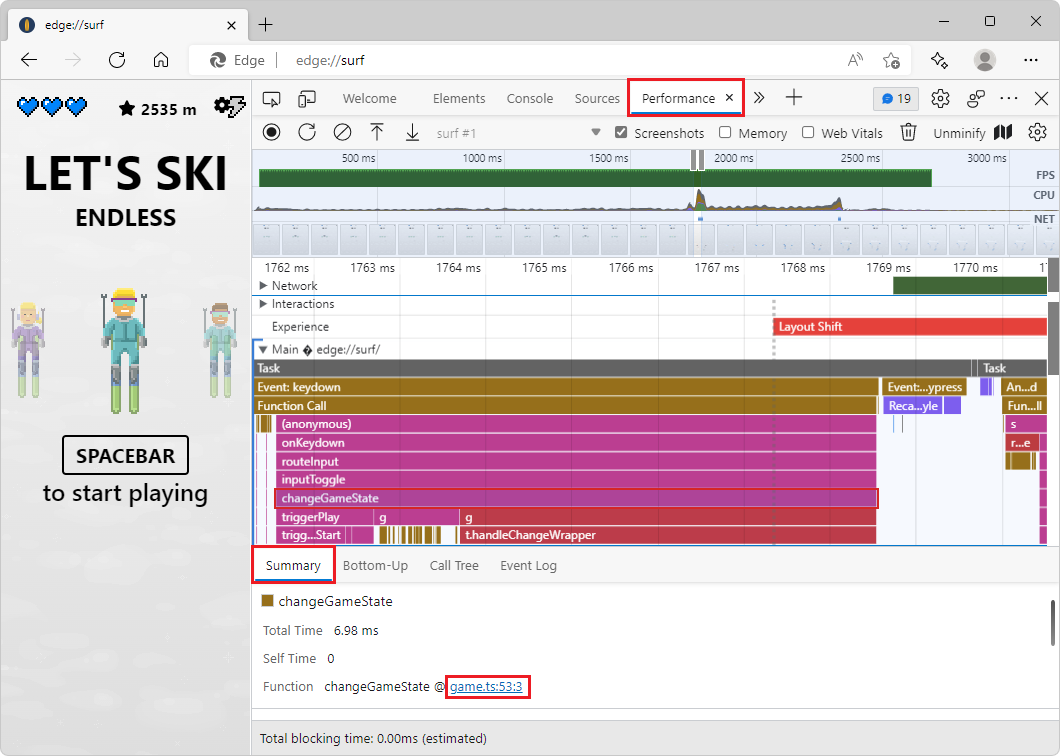
When importing a performance profile, links now map to your original code
When recording a performance profile, the flame chart in the Performance tool displays links from each event on the main thread to the corresponding JavaScript function in the Sources tool. However, these links are broken when you export and import a performance profile.
In Microsoft Edge 100, the links from an imported performance profile now use source maps from Azure Artifacts symbol server to map back to your familiar, original source code. The performance profile must have been exported in Microsoft Edge 100 (or greater), so that the profile includes the information that's needed to resolve source maps in the exported performance trace.
See also:
- Map the processed code to your original source code, for debugging
- Securely debug original code by publishing source maps to the Azure Artifacts symbol server
- Securely debug original code by using Azure Artifacts symbol server source maps
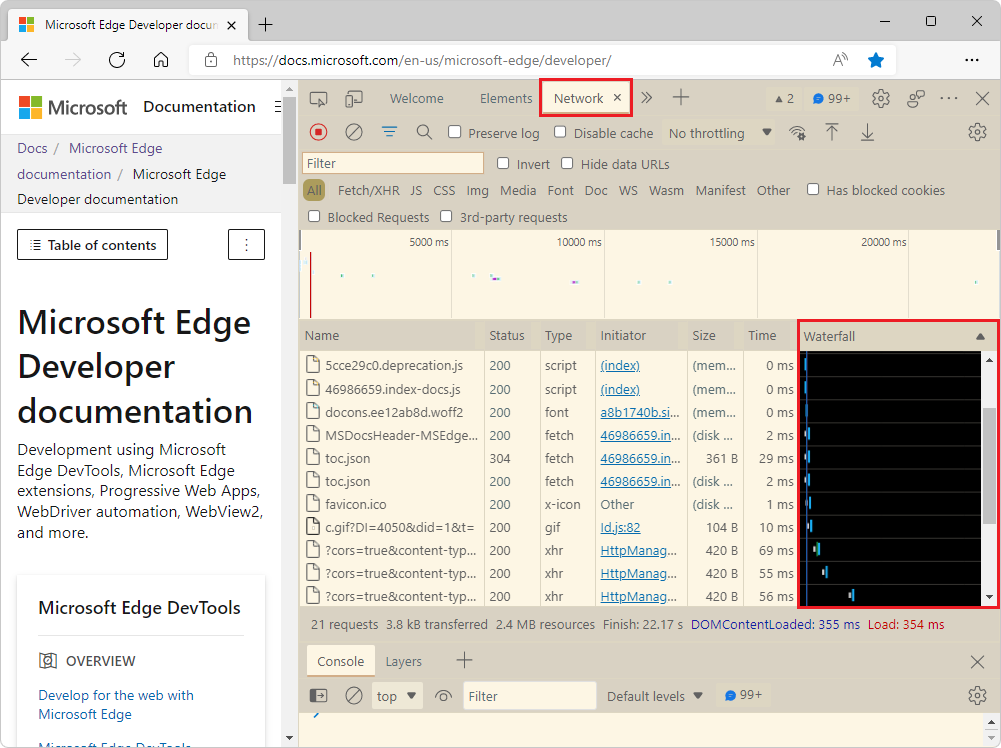
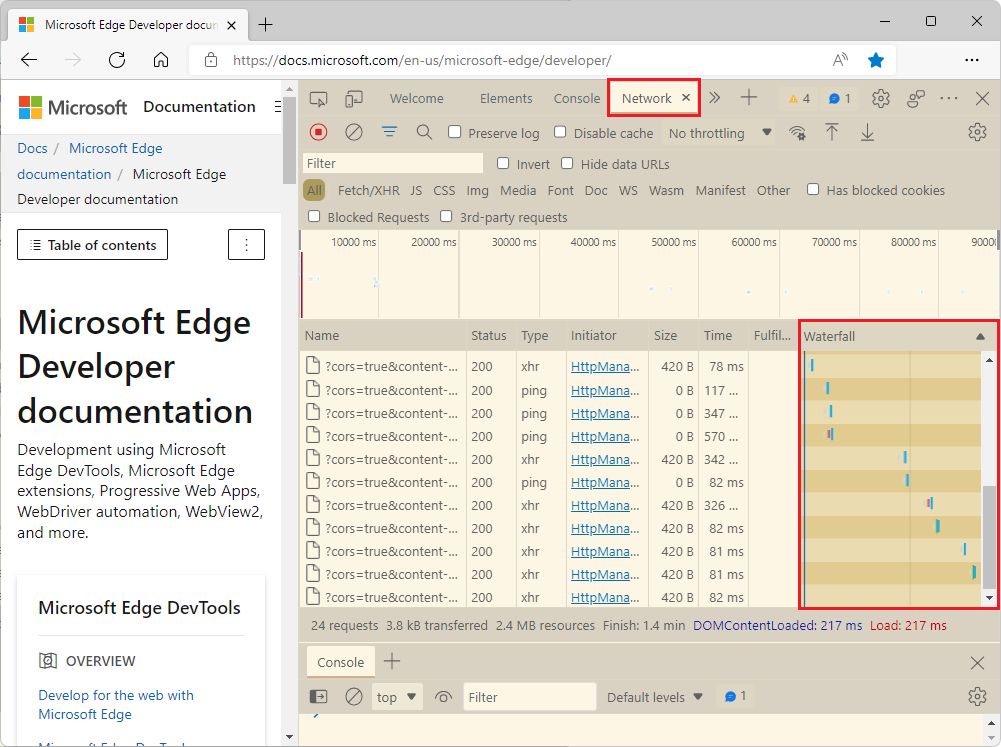
Fix: The Waterfall view in the Network tool now matches Visual Studio Code themes
Update: Starting with Microsoft Edge 131, the Visual Studio Code themes feature is removed, and such themes revert to the default themes:
- Light+
- Dark+
In previous versions of Microsoft Edge, the Waterfall view of requests in the Network tool didn't match the themes from Visual Studio Code that apply to the rest of DevTools. In Microsoft Edge 100, this issue has been fixed.
Before Microsoft Edge 100, the selected theme wasn't applied in the Waterfall view:
Now in Microsoft Edge 100, the selected theme is applied to the Waterfall view of requests in the Network tool:
See also:
- Display the timing relationship of requests in Network features reference - the Waterfall view for requests in the Network tool.
Announcements from the Chromium project
Microsoft Edge version 100 also includes the following updates from the Chromium project:
- View and edit @supports at rules in the Styles pane
- Preview class/function properties on hover
- Partially presented frames in the Performance panel