Note
Access to this page requires authorization. You can try signing in or changing directories.
Access to this page requires authorization. You can try changing directories.
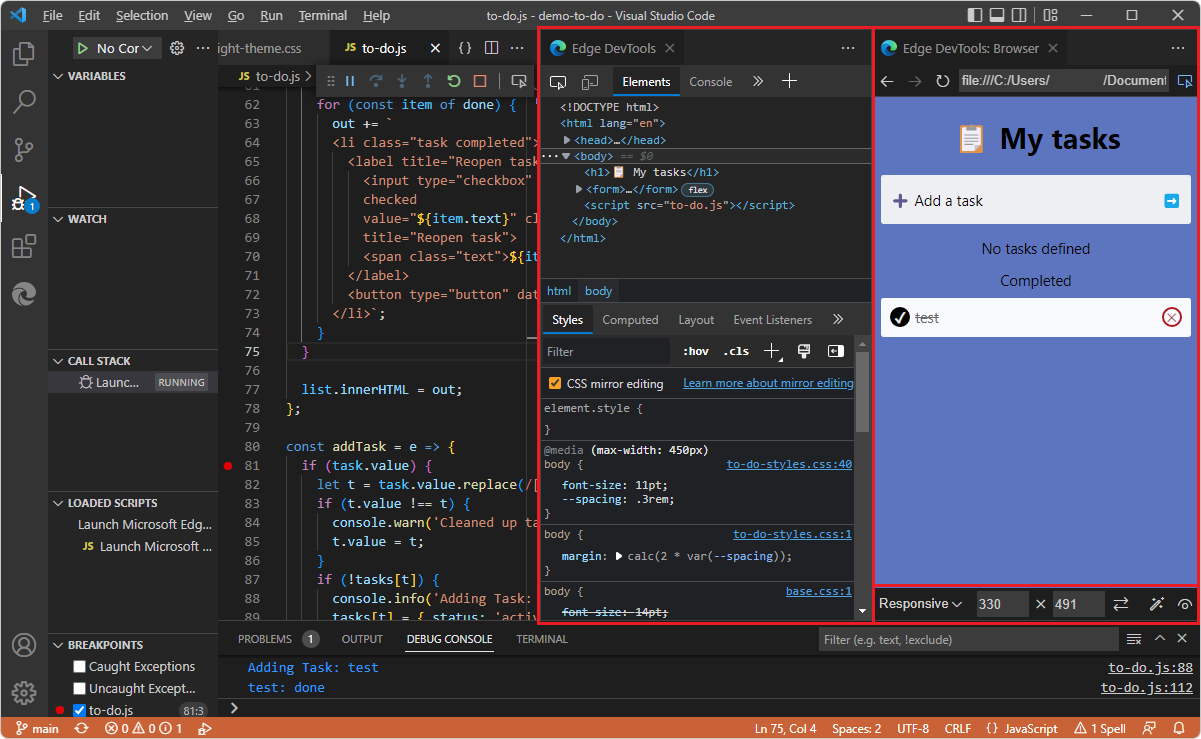
The Microsoft Edge DevTools extension for Visual Studio Code lets you use Microsoft Edge DevTools and an embedded version of the Microsoft Edge Browser including Device Emulation, right from within Visual Studio Code. The DevTools extension provides many of the same tools that are in the DevTools that's in the Microsoft Edge browser, from within Visual Studio Code.
Visual Studio Code is a lightweight but powerful source code editor for Windows, Linux, and macOS. Visual Studio Code is a full IDE (integrated development environment) that has powerful features for web development. Visual Studio Code includes built-in support for JavaScript, TypeScript, and Node.js, so it's a great tool for web developers, especially with this DevTools extension.
The DevTools extension for Visual Studio Code enables you to:
Develop webpages and use DevTools without leaving Visual Studio Code. This extension gives you an alternative to using DevTools for webpage development within the browser window.
Emulate devices, such as displaying your webpage in various viewport sizes during development.
Test the accessibility of your webpages from within Visual Studio Code.
Live-edit CSS and SASS and see your changes reflected immediately in a browser instance while editing your actual source files. CSS mirror editing allows you to control whether to save changes to your
.cssfile. DevTools opens and edits your.cssfiles, but without automatically saving the files, so that you can decide and control whether to save the changes that you made within the Styles tab of the Elements tool.
Approaches compared
The DevTools extension for Visual Studio Code is one of several different ways to use DevTools to change your local files.
| Approach | Pros and Cons | Article |
|---|---|---|
| Browser > DevTools > Elements tool | You have to manually copy changes from DevTools into your source files. | Inspect, edit, and debug HTML and CSS with the Elements tool |
| Browser > DevTools > Sources tool > Workspace tab to define a Workspace | Always saves the changes, which could discourage experimenting | Select a local Workspace, to use DevTools to edit files and save changes to disk in Sources tool overview |
| Browser > DevTools > Settings > Experiments > Open source files in Visual Studio Code | Always saves the changes, which could discourage experimenting | Experiments > Opening source files in Visual Studio Code. |
| Microsoft Edge DevTools extension for Visual Studio Code | Automatically opens and edits the CSS source file but doesn't automatically save the file, so you get to choose whether to save the edits. | The present article. |
2-way editing
Changes are reflected among the source files in the opened folder, the Edge DevTools tab, and the Edge DevTools: Browser tab, as follows.
CSS
Through CSS mirror editing, you can change CSS in the Edge DevTools tab, and it automatically changes in the .html or .css source file, as well as being reflected in the Edge DevTools: Browser tab. DevTools lets you decide whether to save the change, allowing you to experiment.
You can change CSS in the .css or .html source file, save the change, and then reload the webpage in the Edge DevTools: Browser tab, which also updates the Edge DevTools tab.
HTML
You can edit the DOM tree in the Edge DevTools tab (such as changing <h2>Success!</h2> to <h2>CSS Success!</h2>), then press Enter, then refresh the Edge DevTools: Browser tab to see the change. (This doesn't automatically edit the .html source file.)
You can change HTML in the .html source file, save the change, and then reload the webpage in the Edge DevTools: Browser tab, which also updates the Edge DevTools tab.
Tasks supported by the developer tools
The DevTools extension for Visual Studio Code allows you to:
| Task | Article |
|---|---|
| Get live analysis of problems in your source code. | Inline and live issue analysis |
| Start a new browser instance with DevTools for your project. | Opening DevTools and the DevTools browser |
| Emulate different devices and see your project in different display modes. | Device emulation |
| View the runtime DOM structure and layout of your page using the Elements tool. | Opening source files from the Elements tool |
| Analyze and change CSS styles of your project with live preview and live changes to your project's source files. | Update .css files from within the Styles tool (CSS mirror editing) |
| Analyze site traffic using the Network tool. | Network tool integration |
| Log information, try out JavaScript, and access the Window/DOM using the Console tool. | Console integration |
| Inspect storage and service workers using the Application tool. | Application tool integration |
| Use the extension in the Visual Studio Code debugging workflow. | Integration with Visual Studio Code debugging |
Overview of the tools in the DevTools extension
The following tools are included in the DevTools extension for Visual Studio Code. The following articles are not specifically focused on the DevTools extension for Visual Studio Code, but are for the Microsoft Edge browser DevTools.
| Tool | Purpose | Article |
|---|---|---|
| Elements tool | Inspect, edit, and debug your HTML and CSS. You can edit in the tool while displaying the changes live in the browser. Debug your HTML using the DOM tree, and inspect and work on the CSS for your webpage. | Inspect, edit, and debug HTML and CSS with the Elements tool |
| Console tool | An intelligent, rich command line within DevTools. A great companion tool to use with others tools. Provides a powerful way to script functionality, inspect the current webpage, and manipulate the current webpage using JavaScript. | Console overview |
| Network tool | Use the Network tool to make sure that resources are being downloaded or uploaded as expected. Inspect the properties of an individual resource, such as the HTTP headers, content, or size. | Inspect network activity |
| Application tool | Use the Application tool to manage storage for web app pages, including manifest, service workers, local storage, cookies, cache storage, and background services. | The Application tool, to manage storage |
| Issues tool | The Issues tool automatically analyzes the current webpage, reports issues grouped by type, and provides documentation to help explain and resolve the issues. | Find and fix problems using the Issues tool |
| Network conditions tool | Use the Network conditions tool to disable the browser cache, set network throttling, set the user agent string, and set Content-Encodings such as deflate, gzip, and br. | Network conditions tool |
| Network request blocking tool | Use the Network request blocking tool to test blocking network requests to a specified URL pattern and see how a webpage behaves. | Network request blocking tool |
| Inspect tool | Use the Inspect tool to see information about an item within a rendered webpage. When the Inspect tool is active, you hover over items in the webpage, and DevTools adds an information overlay and grid highlighting on the webpage. | Analyze pages using the Inspect tool |
| Device Emulation | Use the Device Emulation tool, also called Device Simulation Mode or Device Mode, to approximate how your page looks and responds on a mobile device. | Emulate mobile devices (Device Emulation) |
For the list of all tools that are in the Microsoft Edge browser version of DevTools, see About the list of tools.
See also
- Get started using the DevTools extension for Visual Studio Code
- Opening DevTools and the DevTools browser
External pages:
- Supercharging VS Code Live Server - If you use the Live Server extension in Visual Studio Code to see the changes in your web products live, you can improve the experience even more by getting a browser and DevTools embedded in Visual Studio Code using the Microsoft Edge DevTools extension for Visual Studio Code.
- Getting Started - Documentation for Visual Studio Code.
- vscode-edge-devtools repo - source code for the Microsoft Edge Developer Tools extension for Visual Studio Code.
- Microsoft Edge DevTools extension for Visual Studio Code in the Visual Studio Marketplace.