Note
Access to this page requires authorization. You can try signing in or changing directories.
Access to this page requires authorization. You can try changing directories.
Microsoft Dataverse as a platform supports interaction with many millions of records, filtered down to the relevant security roles. Dataverse presents data in a way that permits the correct record to be found in a reliable fashion.
Model-driven apps provide a range of reporting options to enable users to understand the data associated with their business area more easily.
Some types of reporting are straightforward to implement, and others require more advanced techniques.
Simple reporting techniques
All of the techniques described here are native to Dataverse. They provide a simple method by which application lifecycle management can be applied.
Table views
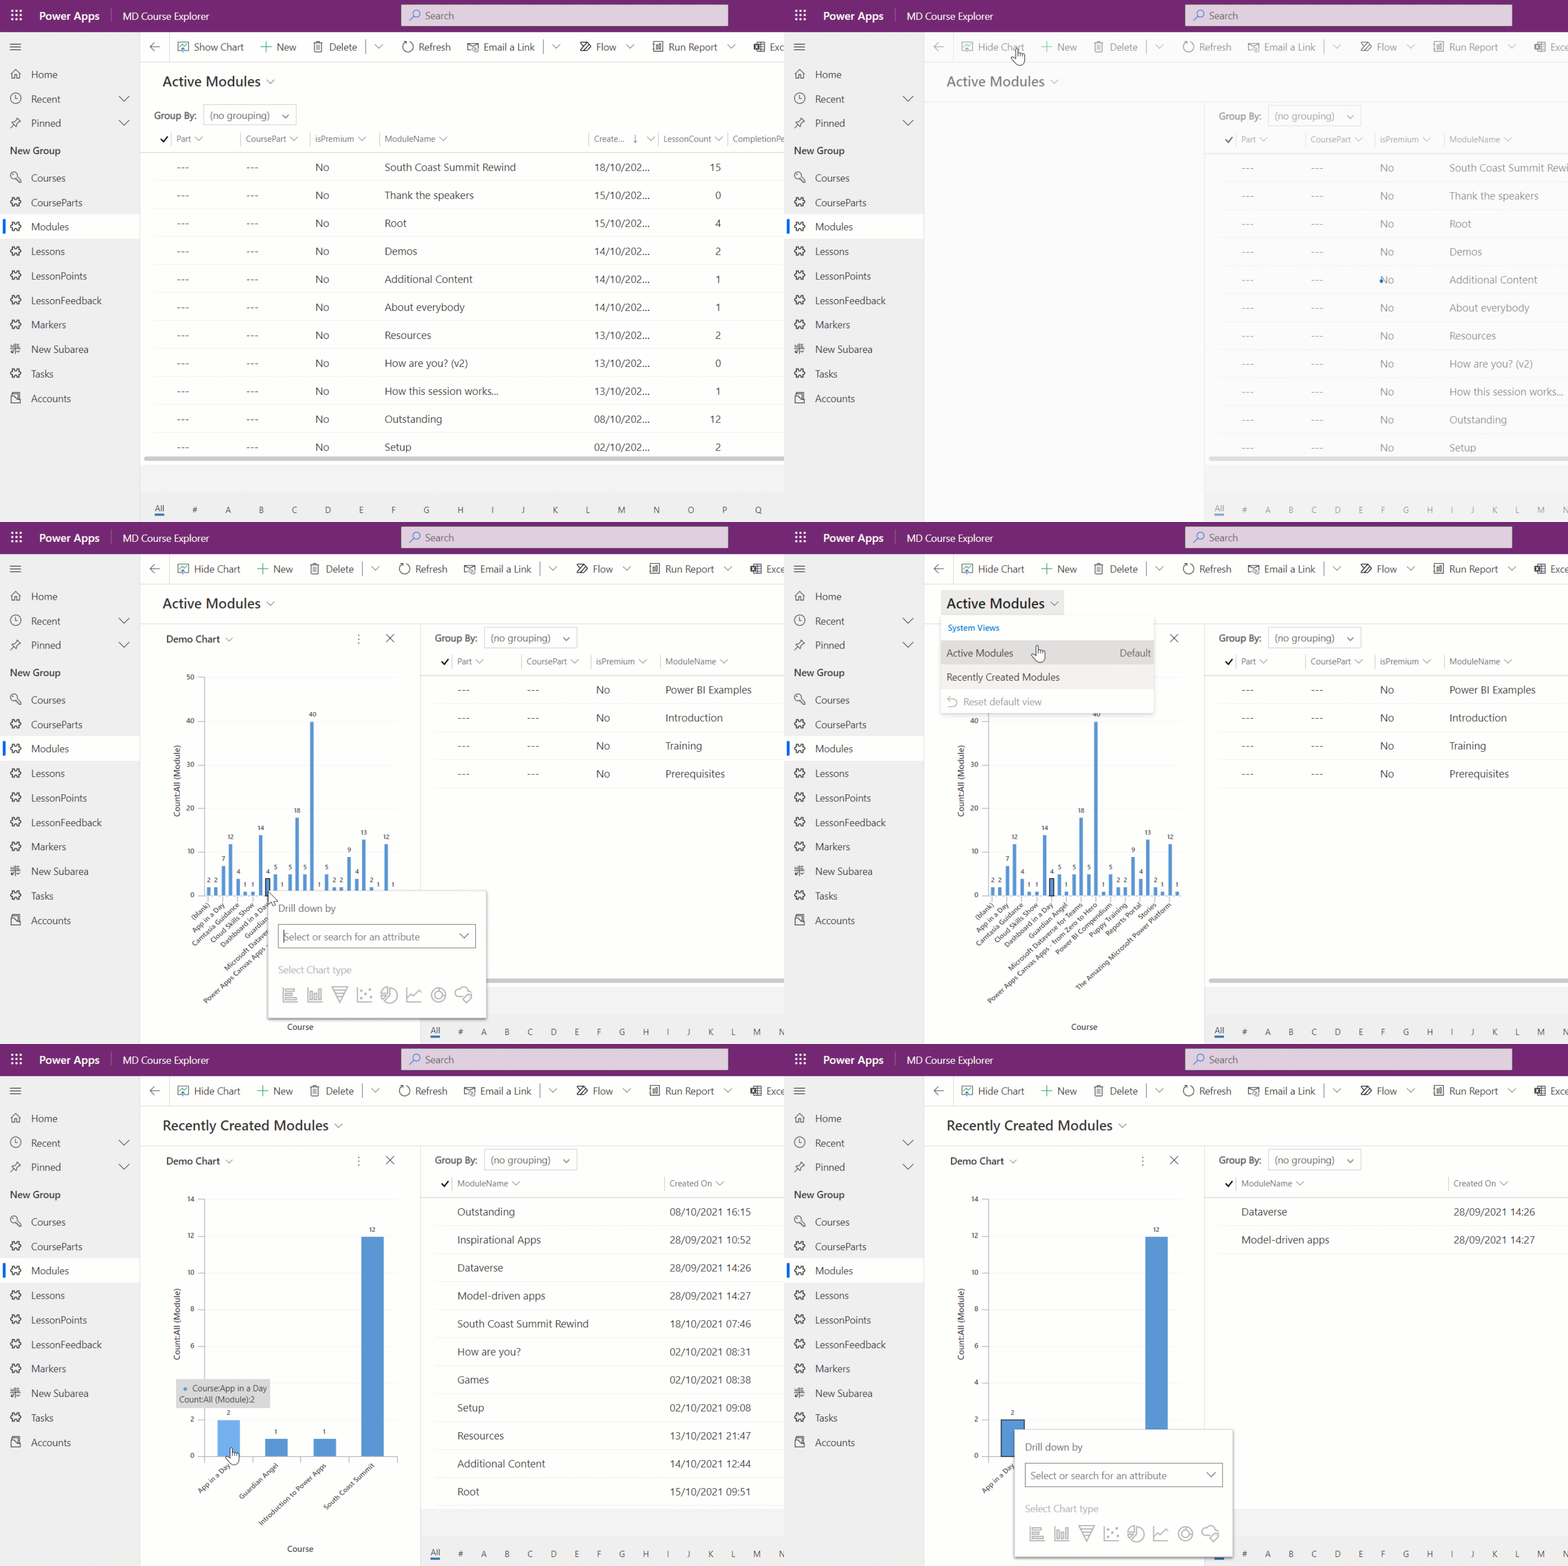
At the most basic level, table views offer a straightforward native experience in which records are presented in a tabular format. It's easy to overlook the power of views. A table can have multiple views, all of which have individual sorting and filtering applied to them, which offers a simple set of review options to the user.
Charts
Charts allow app users to view the data presented in a view in a range of ways, which include bar, pie, and line charts. Once again, a table can have multiple charts associated with it, and the charts themselves provide interactivity that enables a user to select a bar and the view filters accordingly.
The extract here shows views and charts used to create an efficient user experience.

Forms
Forms can often be thought of as a method of entering data for a record. However, forms are an excellent way of providing the user columns of metadata associated with a record. Similar to views and charts, a table can have multiple forms. This permits forms to be developed that are most suited to the business needs of the individual.
Working with SQL Server Reporting style reports
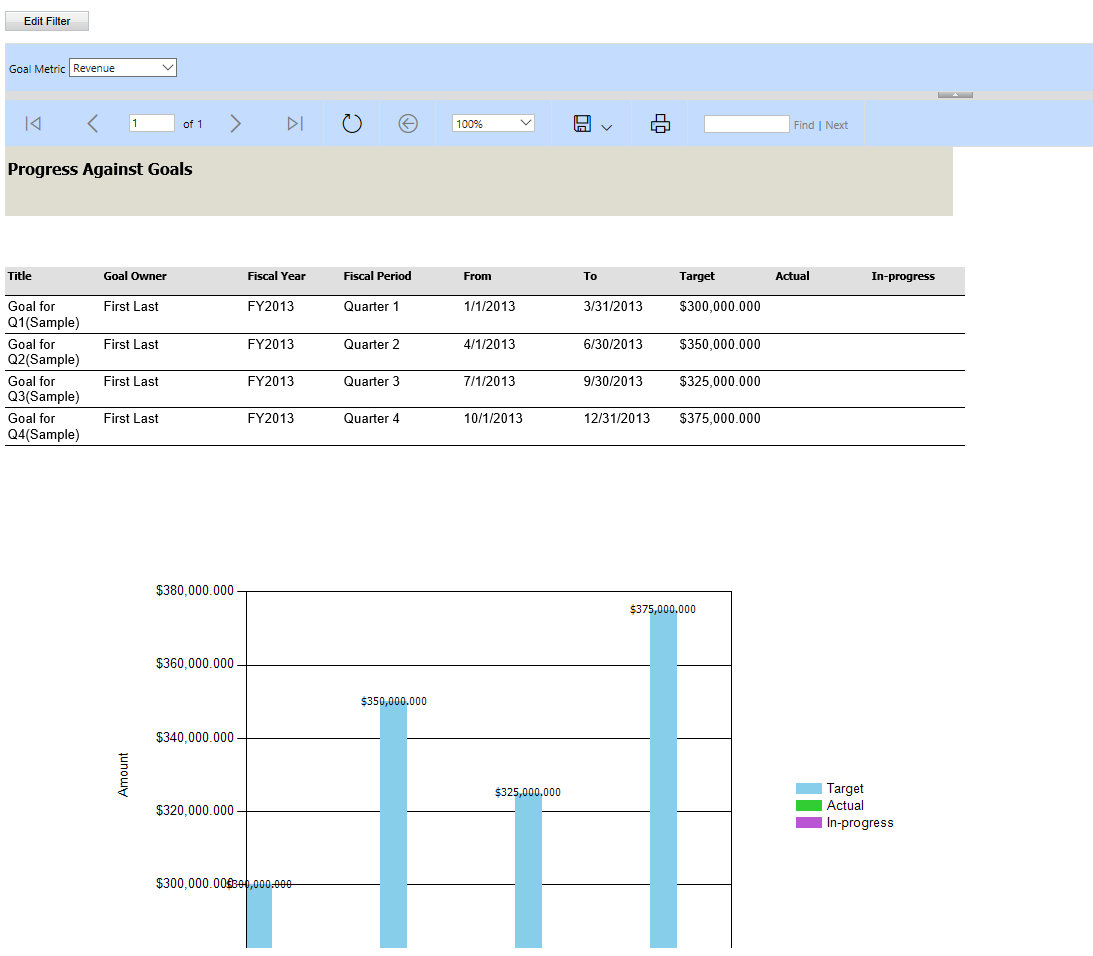
SQL Server Reporting Services (SSRS) reports allow pixel perfect paginated reports to be created that can be rendered on screen and distributed in a range of ways such as PDF, CSV, Excel, and so on. The reports are created using the classic editor and are solution aware, which helps with application lifecycle management. Learn more about SSRS reports

Power BI Reporting
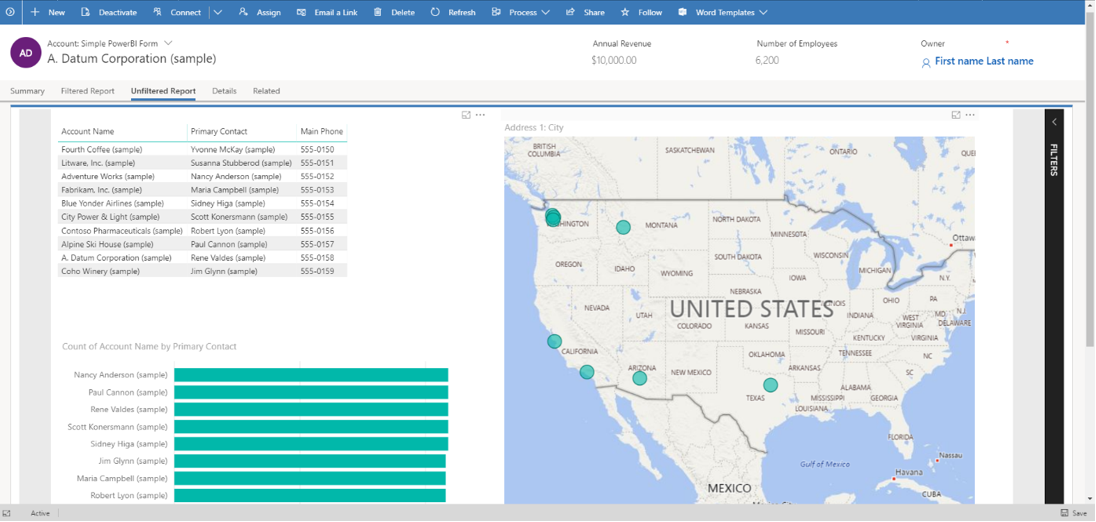
Power BI is a powerful and interactive reporting tool. Power BI dashboards and reports can be introduced into model-driven apps in a range of ways. You can also add Power BI reports and datasets as components in Power Apps solutions. Once you've added a Power BI report to a solution, it can be seamlessly managed as part of your application lifecycle management (ALM) process across environments and tenants.
Additionally, unless direct query techniques are used, record-level security must be reconfigured into the Power BI reports.
There are three techniques for adding Power BI into your model driven apps.
| Technique | Notes | Power BI Object |
|---|---|---|
| Embed a Power BI report in a model-driven system form | This allows a Power BI report to be presented within a table form and this can be performed in the context of the current record. | Report |
| Create or edit a Power BI embedded system dashboard | This is a technique that an administrator can use to introduce a Power BI dashboard | Dashboard |
| How app users can add or edit Power BI visualizations on their dashboards | This allows a full Power BI dashboard to be introduced, however it's introduced by the user, not an administrator. | Dashboard |

Excel integration
Microsoft Excel integration lets users easily build self-service reports using, PowerView, PowerPivot, and PowerQuery.
Next Steps
Create a system chart for a table
Reporting considerations
Working with views
Working with forms
Learn more about SSRS reports
Power BI Overview