Note
Access to this page requires authorization. You can try signing in or changing directories.
Access to this page requires authorization. You can try changing directories.
Case overview statistics provide information for case-level metrics. They also contain a table of cases in the actual view with standard and custom case-level metrics, including generated case cost metrics, which are based on the financial attributes in the process.
Statistical charts
The metrics in the following table are available in the chart.
| Metric | Description |
|---|---|
| New events | Number of started events for the duration of the process. |
| Active events over time | Number of active events for the duration of the process. |
| Cases over time | Number of new cases. |
| Active cases | Number of active cases for the duration of the process. |
| Variants | Distribution of cases per process variant. To learn more, go to Variants overview. |
| Events per case | Number of events recorded in the process instance data. The statistics value reflects the number of lines in the log per case. |
| Cases duration | Occurrence of cases with varying duration. The total spread of case duration is divided into intervals of equal size (the X-axis on the chart). The chart displays the quantity of cases whose duration falls in these intervals. |
| Case utilization | Efficiency of cases can be used as an indicator of the time spent performing an activity relative to the time between performing activities in the case. If the value is 100%, all time of the case is used for the performance of activities. This chart is available if there are two timestamps recorded in the data and imported with the process. |
| Mean active time | This chart is available if there are two timestamps recorded in the data and imported with the process. The average duration of the activity shows the average amount of time spent on activities in each process instance. The total spread of activity times in cases is divided into intervals of equal size (the X-axis on the chart). The chart displays the quantity of cases whose activity time falls in these intervals. |
| Mean waiting time | Average waiting time indicates the average amount of time spent between the performance of activities in each process instance. The total spread of waiting times in cases is divided into intervals of equal size (the X-axis on the chart). The chart displays the number of cases whose waiting time falls in these intervals. |
| Self-loop count | Distribution of cases per self-loops within the case. |
| Loop count | Distribution of cases per loops within the case. |
| Rework count | Distribution of cases per rework (loops and self-loops together) within the case. |
Besides these standard statistics, the list contains all defined Case level custom metrics with continuous output data type and Case(cost) metrics, which are automatically generated by the Power Automate Process Mining desktop app for each finance attribute.
Summary header and table of cases
The summary provides an overview of standard metrics provided by the Process Mining desktop app. The list of these metrics isn't configurable and no additional metrics can be included in this summary row. The table of cases contains standard metrics, generated case cost metrics, and custom metrics applicable on the case level.
The metrics in the following table are available in the summary header.
| Metric | Description |
|---|---|
| Event Count, Case count | Total number of events and cases in actual view. |
| Activities | Number of unique activities in the actual view. The activity attribute is defined in process import/configuration. This metric is not affected by the selection of the mining attribute on the process map. |
| Resources | Number of unique resources in the actual view. Resource attribute is defined in process import/configuration. In the case of multiple resource attributes, the first one (according to the order of process attributes) is used. |
| Variant count | Number of variants generated by process activity. Selection of mining attribute or variant mining attribute (on Variants screen) does not affect this metric. |
| Median case duration, mean case duration | Median and average case duration. |
| Mean active time | Average duration of all events in one case calculated over all cases. This metric is calculated only for event logs with defined event duration (event has start and end timestamps or start timestamp and event duration). For one timestamp, the event logs duration of events isn't known and the Process Mining desktop app isn't able to calculate active time. In such an event log, active time for all cases is zero. |
| Mean waiting time | Average waiting time is calculated as the time difference between the end of the previous activity and the start of the current activity. In the event log, without event duration, the all-time difference between the start of two events is considered as waiting time. |
| Mean utilization | Average utilization of cases. Utilization is calculated as the ratio between case duration and duration of case events. This metric is calculated only for event logs with defined event duration. In processes without event duration, utilization per case and thus mean utilization for all cases is zero. |
| Start, end | Date of the start of the earliest case and date of the end of the latest case in the actual view. |
| Self-loop cases | Percentage of cases that involve particular amounts of self-loops relative to the total number of cases in the process. |
| Loop cases | Percentage of cases that involve particular amounts of loops relative to the total number of cases in the process. |
| Rework cases | Percentage of cases that involve particular amounts of reworks relative to the total number of cases in the process. |
Case cost
The value represents the case cost of the financial attribute that is present in the brackets. Whenever one or more financial attributes are specified during the import process, they automatically become available in the statistics table both as additional columns in the table and as parameters available for the chart.
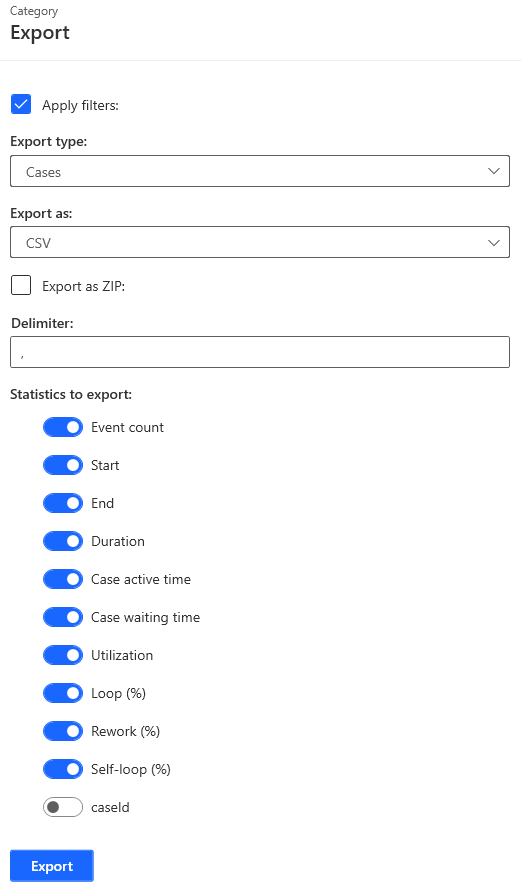
Case information export
Case information can be exported from the Case overview.
In the open view, select Export on the left panel.
In the Export type dropdown menu, select Cases.
Verify that the Export as selection is CSV and the Delimiter field is a comma.
Select statistics to be exported.
Select Export.