Note
Access to this page requires authorization. You can try signing in or changing directories.
Access to this page requires authorization. You can try changing directories.
After you select the data source you want to use, you're taken to the Power Query Editor. The Query Editor is a powerful tool to transform your data. To learn more, go to The Power Query user interface.
Here are some reasons why you might want to transform the data:
You might not be interested in all the activity names that are logged, and so you want to filter for specific activity names that are important to the process you're trying to mine.
You might want to rename some of the activity names to be more descriptive and understandable. This is often not the case with names in a database.
You might be interested in only a specific date range, and not the entire history of data.
You might want to combine multiple ID columns to form the case ID. This is often done when the ID you want to use for process mining doesn't exist or is a combination of multiple IDs in the application. For example, when a customer files support tickets, the support ticket might be assigned to multiple customer service agents. If you want to analyze how each agent handles each ticket, you would combine the agent ID and the ticket ID into the case ID.
Filter activity names
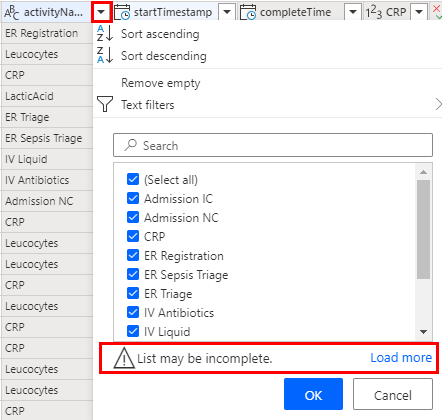
Select the caret next to the activity name column to bring up the sort and filter menu.
If there's a message that says List may be incomplete, select Load more.
Select only the activity names that you want to analyze. Uncheck any name you want to exclude.
Alternatively, you can use the Text filter menu for more advanced filtering. For more information on filtering by value, go to Filter by values in a column.
Rename activities
- Ensure that the Activity Name column is selected.
- Above the toolbar, select the Transform tab.
- On the toolbar, select Replace values.
- Under Values to find, type the activity name as it appears in the data source that you want to replace.
- Under Replace with, type the activity name you want to show in the process map.
- Repeat this process for all the values you want to replace.
Reduce the number of total records
One strategy for reducing the total number of records is to use only the latest records. To do this, you need to first sort the data by time.
Open the sort and filter menu by selecting the caret next to the startTimestamp column.
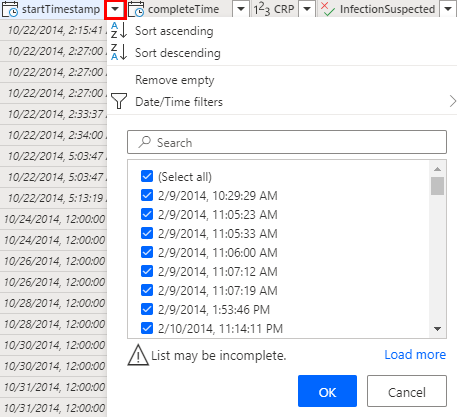
To have the most recent records show up first, select Sort descending.
Select OK, and then select Keep rows on the toolbar.
Enter 150000 under Number of rows.
Select OK to filter for the top 150,000 rows.
Combine multiple IDs
You can use Ctrl + click to select multiple columns that you want to combine.
- On the Transform tab toolbar, select Merge columns.
- (Optional) Select a separator from the dropdown list. Alternatively, you can select none.
- Change the name (or make a note of the default name that's generated), so you can select it when mapping to a case ID.
Map data
Mapping tells the process mining capability what column is mapped to which attribute type (for example, case ID, activity name, or timestamp).
- To navigate to the Mapping screen, select Next.
- Use the dropdown menus next to the respective columns to select their attribute type. For more information, follow the description of the attribute types.
- When the data is ingested from Azure Data Lake Gen2 using a CSV file format, you can use the dropdown menus in the Data type column to change the data types for the import. For columns having numeric values, consider their analytical usage of whether the attribute is a continuous value (for example, invoice amount set to Number) or a categorical value (for example, material code set to Text).
- Case ID, Activity, and Start timestamp are mandatory attributes to continue with the analysis.
- To start the analysis of your process, select Save and analyze.