Note
Access to this page requires authorization. You can try signing in or changing directories.
Access to this page requires authorization. You can try changing directories.
APPLIES TO: ![]() Power BI Desktop
Power BI Desktop ![]() Power BI service
Power BI service
You've read Reports in Power BI and now you want to create your own. There are different ways to create a report. In this article, we start by creating a basic report in the Power BI service from an Excel file. Once you understand the basics of creating a report, check out the Related content for more articles.
Prerequisites
Import the Excel file
This method of creating a report starts with a file and a blank report canvas. If you want to follow along, download the Retail Analysis sample Excel file and save it to your computer or to OneDrive for work or school.
In the navigation pane, select My Workspace. Then select New > Semantic model.
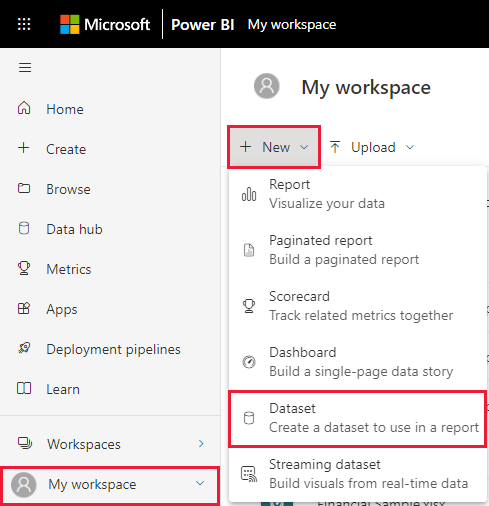
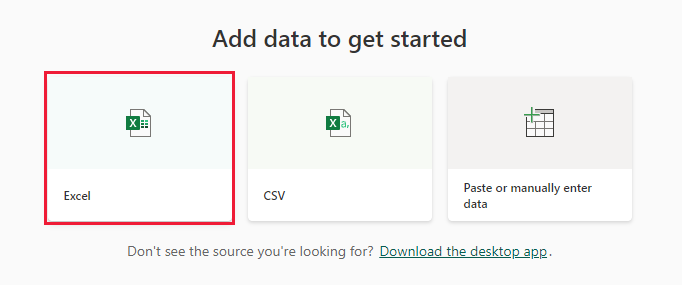
Select Excel.
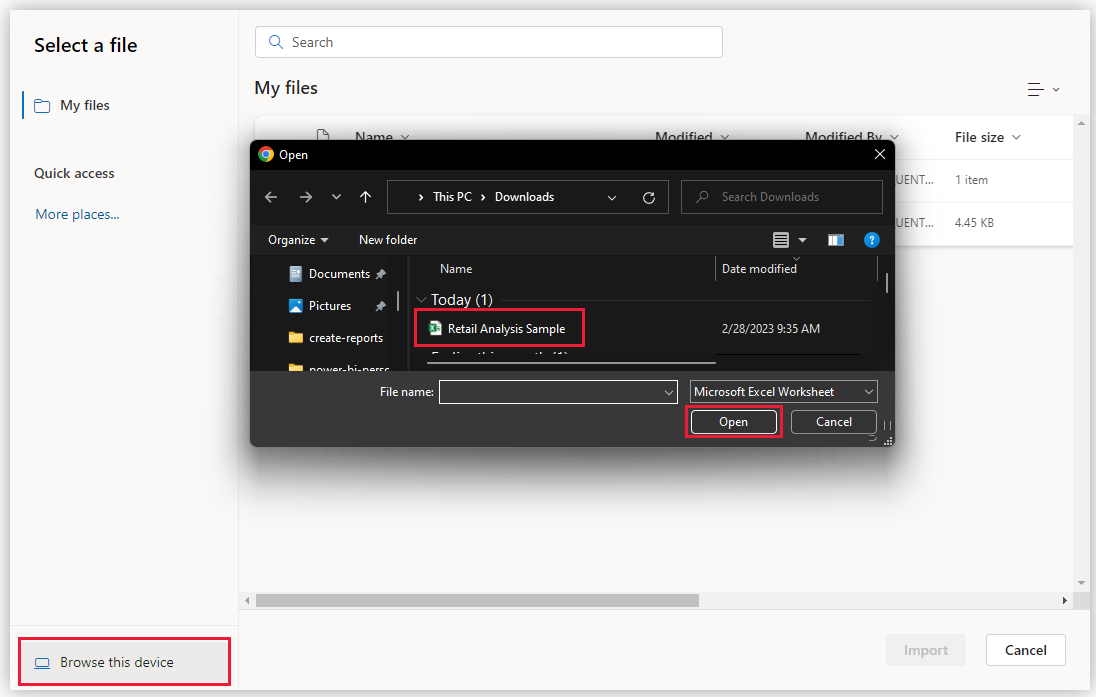
Select Browse this device. Go to the location where you saved the Retail Analysis sample then select Open.
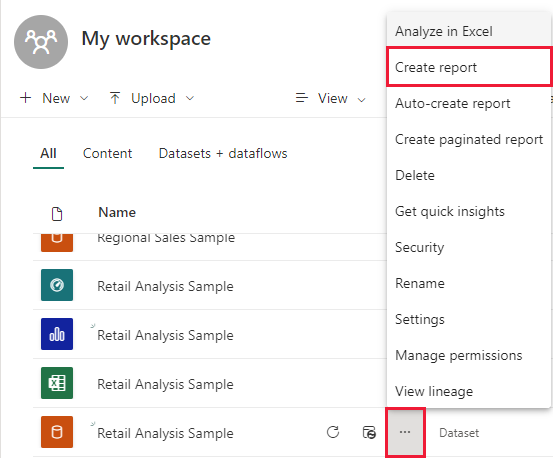
After the Excel file imports, it's listed as a semantic model in the workspace list.
Next to the semantic model, select More options (...), and then choose Create report.
The report editor opens.
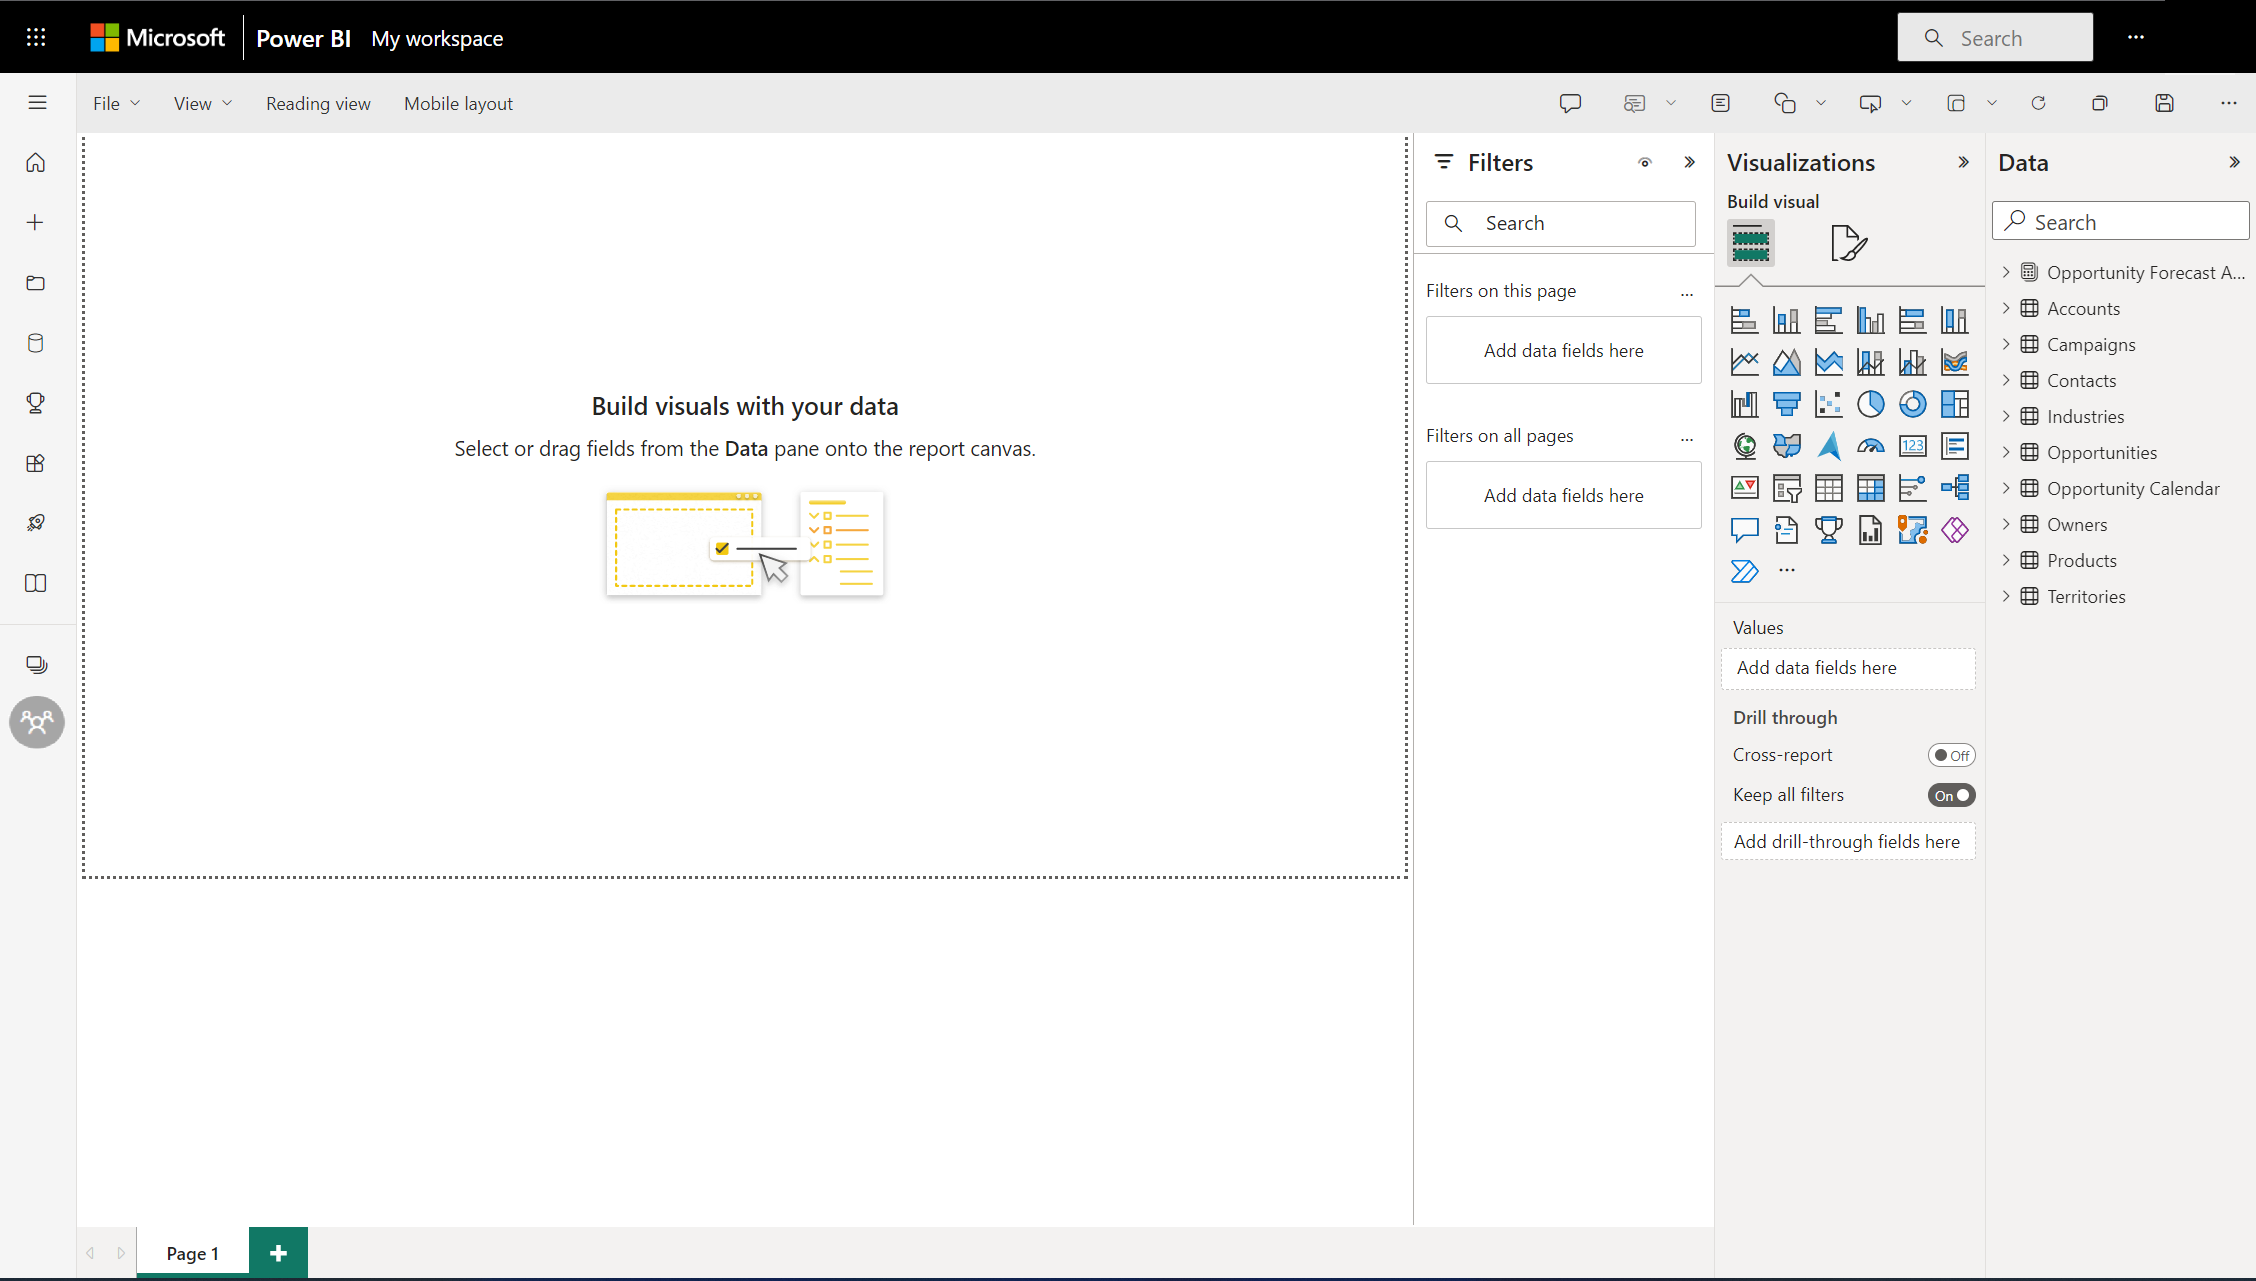

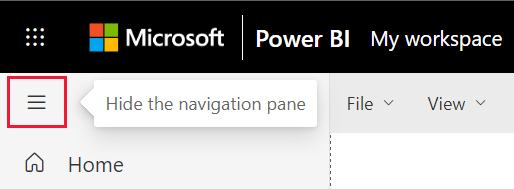
Tip
Select the menu icon to hide the navigation pane to give you more room.
Add a radial gauge to the report
Now that our semantic model is imported, let's start answering some questions. Our Chief Marketing Officer (CMO) wants to know how close the company is to meeting this year's sales goals. Learn how a gauge is a good visualization choice for displaying this type of information with Visualizations in Power BI reports.
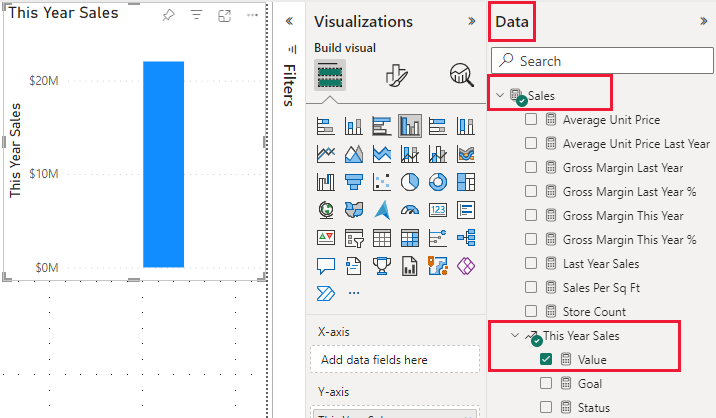
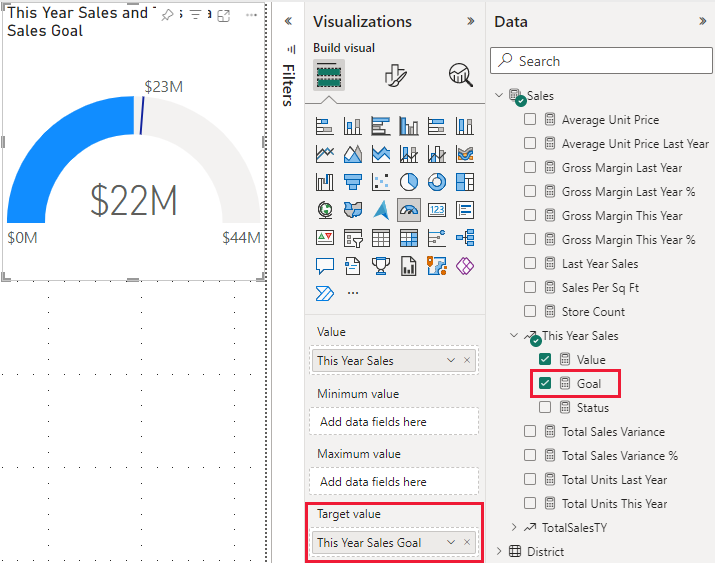
In the Data pane, select Sales > This Year Sales > Total Sales Variance.
Convert the visual to a gauge by selecting the gauge template icon
 from the Visualizations pane.
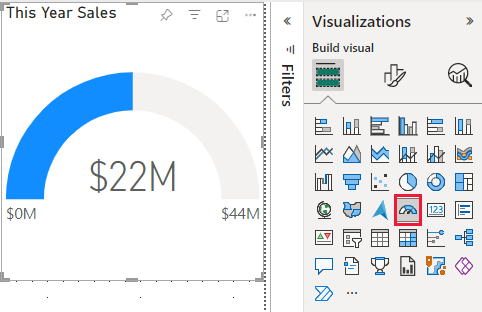
Drag Sales > This Year Sales > Goal to the Target value well. This shows we're close to our goal.
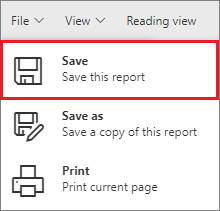
Now would be a good time to save your report.
Add an area chart and slicer to the report
Our CMO has other questions for us to answer. They want to know how sales this year compare to last year. They also want to see the findings by district.
First, let's make some room on our canvas. Select the gauge and move it into the top-right corner. Then grab and drag one of the corners and make it smaller.
Deselect the gauge. In the Data pane, select Sales > This Year Sales > Value and select Sales > Last Year Sales.
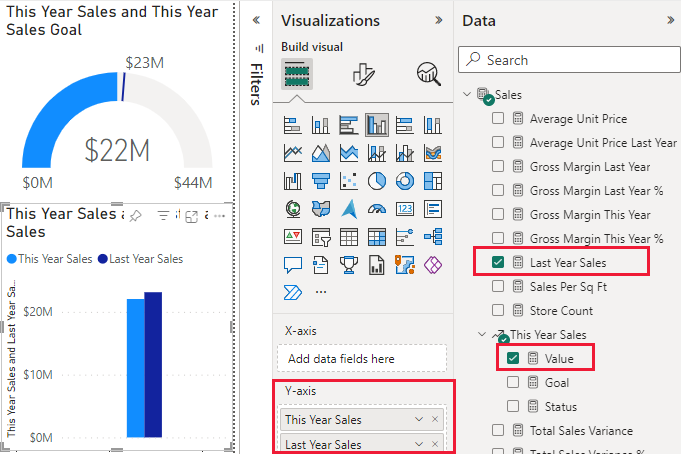
Convert the visual to an Area chart by selecting the Area chart template
 from the Visualizations pane.
Select Time > Period to add it to the X-Axis well.
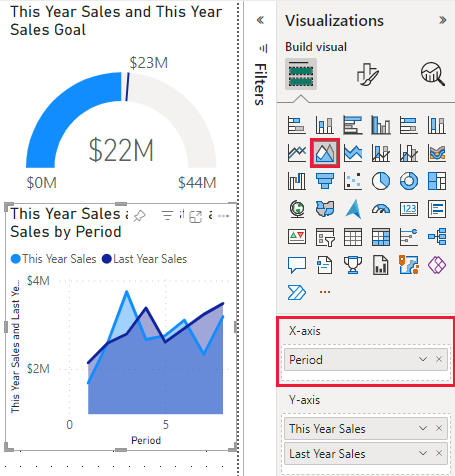
To sort the visualization by time period, select the ellipses and choose Sort by Period.
Now let's add the slicer. Select an empty area on the canvas and choose the Slicer
 template. We now have an empty slicer on our canvas.
From the Data pane, select District > District. Move and resize the slicer.
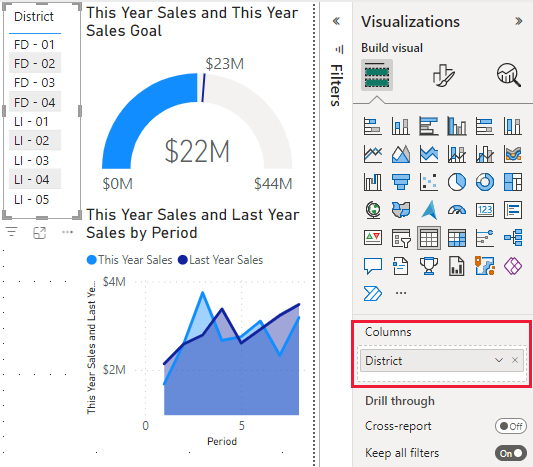
Use the slicer to look for patterns and insights by District.
Continue exploring your data and adding visualizations. When you find especially interesting insights, learn how to pin them to a dashboard with Create a Power BI dashboard from a report.