Note
Access to this page requires authorization. You can try signing in or changing directories.
Access to this page requires authorization. You can try changing directories.
When a visual has a hierarchy, you can allow users to use the Power BI drill-down feature to reveal more details.
Read more about the Power BI drill-down feature at Drill mode in the Power BI service. To allows the visual to enable or disable the drill feature dynamically, see Dynamic drill-down control.
Enable drill-down support in the visual
To support drill-down actions in your visual, add a new field to capabilities.json named drill-down. This field has one property called roles that contains the name of the dataRole you want to enable drill-down actions on.
    "drilldown": {
        "roles": [
            "category"
        ]
    }
Note
The drill-down dataRole must be of Grouping type.
max property in the dataRole conditions must be set to 1.
Once you add the role to the drill-down field, users can drag multiple fields into the data role.
For example:
{
    "dataRoles": [
        {
            "displayName": "Category",
            "name": "category",
            "kind": "Grouping"
        },
        {
            "displayName": "Value",
            "name": "value",
            "kind": "Measure"
        }
    ],
    "drilldown": {
        "roles": [
            "category"
        ]
    },
    "dataViewMappings": [
        {
            "categorical": {
                "categories": {
                    "for": {
                        "in": "category"
                    }
                },
                "values": {
                    "select": [
                        {
                            "bind": {
                                "to": "value"
                            }
                        }
                    ]
                }
            }
        }
    ]
}
Create a visual with drill-down support
To create a visual with drill-down support, run the following command:
pbiviz new testDrillDown -t default
To create a default sample visual, apply the above sample of capabilities.json to the newly created visual.
Create the property for div container to hold HTML elements of the visual:
"use strict";

import "core-js/stable";
import "./../style/visual.less";
// imports

export class Visual implements IVisual {
    // visual properties
    // ...
    private div: HTMLDivElement; // <== NEW PROPERTY

    constructor(options: VisualConstructorOptions) {
        // constructor body
        // ...
    }

    public update(options: VisualUpdateOptions) {
        // update method body
        // ...
    }

    /**
     * Returns properties pane formatting model content hierarchies, properties and latest formatting values, Then populate properties pane.
     * This method is called once each time we open the properties pane or when the user edits any format property.
     */
    public getFormattingModel(): powerbi.visuals.FormattingModel {
        return this.formattingSettingsService.buildFormattingModel(this.formattingSettings);
    }
}
Update the constructor of the visual:
export class Visual implements IVisual {
    // visual properties
    // ...
    private div: HTMLDivElement;

    constructor(options: VisualConstructorOptions) {
        console.log('Visual constructor', options);
        this.formattingSettingsService = new FormattingSettingsService();
        this.target = options.element;
        this.updateCount = 0;

        if (document) {
            const new_p: HTMLElement = document.createElement("p");
            new_p.appendChild(document.createTextNode("Update count:"));
            const new_em: HTMLElement = document.createElement("em");
            this.textNode = document.createTextNode(this.updateCount.toString());
            new_em.appendChild(this.textNode);
            new_p.appendChild(new_em);
            this.div = document.createElement("div"); // <== CREATE DIV ELEMENT
            this.target.appendChild(new_p);
        }
    }
}
To create buttons, update the update visual's method:
export class Visual implements IVisual {
    // ...

    public update(options: VisualUpdateOptions) {
        this.formattingSettings = this.formattingSettingsService.populateFormattingSettingsModel(VisualFormattingSettingsModel, options.dataViews);
        console.log('Visual update', options);

        const dataView: DataView = options.dataViews[0];
        const categoricalDataView: DataViewCategorical = dataView.categorical;

        // don't create elements if no data
        if (!options.dataViews[0].categorical ||
            !options.dataViews[0].categorical.categories) {
            return
        }

        // to display current level of hierarchy
        if (typeof this.textNode !== undefined) {
            this.textNode.textContent = categoricalDataView.categories[categoricalDataView.categories.length - 1].source.displayName.toString();
        }

        // remove old elements
        // for better performance use D3js pattern:
        // https://d3js.org/#enter-exit
        while (this.div.firstChild) {
            this.div.removeChild(this.div.firstChild);
        }

        // create buttons for each category value
        categoricalDataView.categories[categoricalDataView.categories.length - 1].values.forEach( (category: powerbi.PrimitiveValue, index: number) => {
            let button = document.createElement("button");
            button.innerText = category.toString();

            this.div.appendChild(button);
        })

    }
    // ...
Apply simple styles in .\style\visual.less:
button {
    margin: 5px;
    min-width: 50px;
    min-height: 50px;
}
Prepare sample data for testing the visual:
| H1 | H2 | H3 | VALUES |
|---|---|---|---|
| A | A1 | A11 | 1 |
| A | A1 | A12 | 2 |
| A | A2 | A21 | 3 |
| A | A2 | A22 | 4 |
| A | A3 | A31 | 5 |
| A | A3 | A32 | 6 |
| B | B1 | B11 | 7 |
| B | B1 | B12 | 8 |
| B | B2 | B21 | 9 |
| B | B2 | B22 | 10 |
| B | B3 | B31 | 11 |
| B | B3 | B32 | 12 |
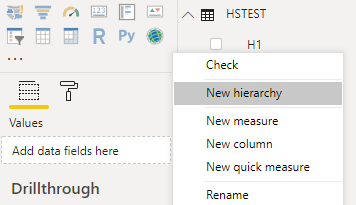
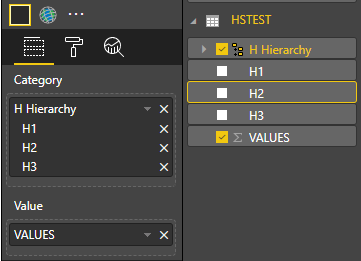
And create Hierarchy in Power BI Desktop:
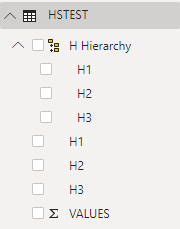
Include all category columns (H1, H2, H3) to the new hierarchy:
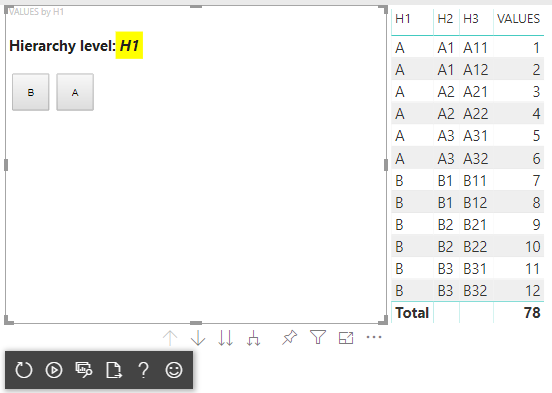
After those steps you should get following visual:
Add context menu to visual elements
To add a context menu to the buttons on the visual:
Save host object in the properties of the visual and call createSelectionManager method to the create selection manager to display a context menu by using Power BI Visuals API.
"use strict";

import "core-js/stable";
import "./../style/visual.less";
// default imports

import IVisualHost = powerbi.extensibility.visual.IVisualHost;
import ISelectionManager = powerbi.extensibility.ISelectionManager;
import ISelectionId = powerbi.visuals.ISelectionId;

export class Visual implements IVisual {
    // visual properties
    // ...
    private div: HTMLDivElement;
    private host: IVisualHost; // <== NEW PROPERTY
    private selectionManager: ISelectionManager; // <== NEW PROPERTY

    constructor(options: VisualConstructorOptions) {
        // constructor body
        // save the host in the visuals properties
        this.host = options.host;
        // create selection manager
        this.selectionManager = this.host.createSelectionManager();
        // ...
    }

    public update(options: VisualUpdateOptions) {
        // update method body
        // ...
    }

    // ...
}
Change the body of forEach function callback to:
    categoricalDataView.categories[categoricalDataView.categories.length - 1].values.forEach( (category: powerbi.PrimitiveValue, index: number) => {
        // create selectionID for each category value
        let selectionID: ISelectionId = this.host.createSelectionIdBuilder()
            .withCategory(categoricalDataView.categories[0], index)
            .createSelectionId();

        let button = document.createElement("button");
        button.innerText = category.toString();

        // add event listener to click event
        button.addEventListener("click", (event) => {
            // call select method in the selection manager
            this.selectionManager.select(selectionID);
        });

        button.addEventListener("contextmenu", (event) => {
            // call showContextMenu method to display context menu on the visual
            this.selectionManager.showContextMenu(selectionID, {
                x: event.clientX,
                y: event.clientY
            });
            event.preventDefault();
        });

        this.div.appendChild(button);
    });
Apply data to the visual:
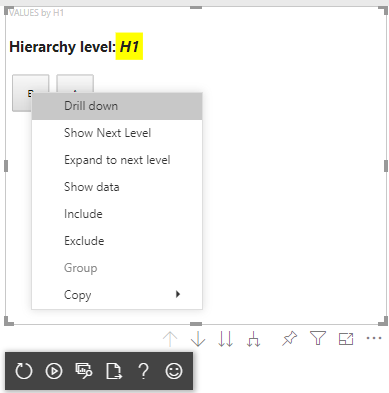
In the final step you should get visual with selections and context menu:
Add drill-down support for matrix data view mapping
To test the visual with matrix data view mappings, first prepare sample data:
| Row 1 | Row 2 | Row 3 | Column 1 | Column 2 | Column 3 | Values |
|---|---|---|---|---|---|---|
| R1 | R11 | R111 | C1 | C11 | C111 | 1 |
| R1 | R11 | R112 | C1 | C11 | C112 | 2 |
| R1 | R11 | R113 | C1 | C11 | C113 | 3 |
| R1 | R12 | R121 | C1 | C12 | C121 | 4 |
| R1 | R12 | R122 | C1 | C12 | C122 | 5 |
| R1 | R12 | R123 | C1 | C12 | C123 | 6 |
| R1 | R13 | R131 | C1 | C13 | C131 | 7 |
| R1 | R13 | R132 | C1 | C13 | C132 | 8 |
| R1 | R13 | R133 | C1 | C13 | C133 | 9 |
| R2 | R21 | R211 | C2 | C21 | C211 | 10 |
| R2 | R21 | R212 | C2 | C21 | C212 | 11 |
| R2 | R21 | R213 | C2 | C21 | C213 | 12 |
| R2 | R22 | R221 | C2 | C22 | C221 | 13 |
| R2 | R22 | R222 | C2 | C22 | C222 | 14 |
| R2 | R22 | R223 | C2 | C22 | C223 | 16 |
| R2 | R23 | R231 | C2 | C23 | C231 | 17 |
| R2 | R23 | R232 | C2 | C23 | C232 | 18 |
| R2 | R23 | R233 | C2 | C23 | C233 | 19 |
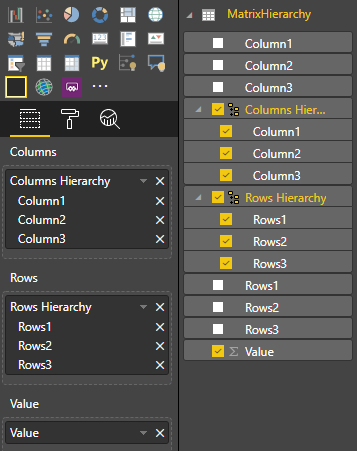
Then apply the following data view mapping to the visual:
{
    "dataRoles": [
        {
            "displayName": "Columns",
            "name": "columns",
            "kind": "Grouping"
        },
        {
            "displayName": "Rows",
            "name": "rows",
            "kind": "Grouping"
        },
        {
            "displayName": "Value",
            "name": "value",
            "kind": "Measure"
        }
    ],
    "drilldown": {
        "roles": [
            "columns",
            "rows"
        ]
    },
    "dataViewMappings": [
        {
            "matrix": {
                "columns": {
                    "for": {
                        "in": "columns"
                    }
                },
                "rows": {
                    "for": {
                        "in": "rows"
                    }
                },
                "values": {
                    "for": {
                        "in": "value"
                    }
                }
            }
        }
    ]
}
Apply data to the visual:
Import required interfaces to process matrix data view mappings:
// ...
import DataViewMatrix = powerbi.DataViewMatrix;
import DataViewMatrixNode = powerbi.DataViewMatrixNode;
import DataViewHierarchyLevel = powerbi.DataViewHierarchyLevel;
// ...
Create two properties for two divs of rows and columns elements:
export class Visual implements IVisual {
    // ...
    private rowsDiv: HTMLDivElement;
    private colsDiv: HTMLDivElement;
    // ...
    constructor(options: VisualConstructorOptions) {
        // constructor body
        // ...
        // Create div elements and append to main div of the visual
        this.rowsDiv = document.createElement("div");
        this.target.appendChild(this.rowsDiv);

        this.colsDiv = document.createElement("div");
        this.target.appendChild(this.colsDiv);
    }
    // ...
}
Check the data before rendering elements and display the current level of hierarchy:
export class Visual implements IVisual {
    // ...
    constructor(options: VisualConstructorOptions) {
        // constructor body
    }

    public update(options: VisualUpdateOptions) {
        this.formattingSettings = this.formattingSettingsService.populateFormattingSettingsModel(VisualFormattingSettingsModel, options.dataViews);
        console.log('Visual update', options);

        const dataView: DataView = options.dataViews[0];
        const matrixDataView: DataViewMatrix = dataView.matrix;

        // if the visual doesn't receive the data no reason to continue rendering
        if (!matrixDataView ||
            !matrixDataView.columns ||
            !matrixDataView.rows ) {
            return
        }

        // to display current level of hierarchy
        if (typeof this.textNode !== undefined) {
            this.textNode.textContent = categoricalDataView.categories[categoricalDataView.categories.length - 1].source.displayName.toString();
        }
        // ...
    }
    // ...
}
Create function treeWalker for traverse the hierarchy:
export class Visual implements IVisual {
    // ...
    public update(options: VisualUpdateOptions) {
        // ...

        // if the visual doesn't receive the data no reason to continue rendering
        if (!matrixDataView ||
            !matrixDataView.columns ||
            !matrixDataView.rows ) {
            return
        }

        const treeWalker = (matrixNode: DataViewMatrixNode, index: number, levels: DataViewHierarchyLevel[], div: HTMLDivElement)  => {
            // ...
            if (matrixNode.children) {
                // ...
                // traversing child nodes
                matrixNode.children.forEach((node, index) => treeWalker(node, index, levels, childDiv));
            }
        }

        // traversing rows
        const rowRoot: DataViewMatrixNode = matrixDataView.rows.root;
        rowRoot.children.forEach((node, index) => treeWalker(node, index, matrixDataView.rows.levels, this.rowsDiv));

        // traversing columns
        const colRoot = matrixDataView.columns.root;
        colRoot.children.forEach((node, index) => treeWalker(node, index, matrixDataView.columns.levels, this.colsDiv));
    }
    // ...
}
Generate the selections for datapoints.
const treeWalker = (matrixNode: DataViewMatrixNode, index: number, levels: DataViewHierarchyLevel[], div: HTMLDivElement)  => {
    // generate selectionID for each node of matrix
    const selectionID: ISelectionID = this.host.createSelectionIdBuilder()
        .withMatrixNode(matrixNode, levels)
        .createSelectionId();
    // ...
    if (matrixNode.children) {
        // ...
        // traversing child nodes
        matrixNode.children.forEach((node, index) => treeWalker(node, index, levels, childDiv));
    }
}
Create div for each level of hierarchy:
const treeWalker = (matrixNode: DataViewMatrixNode, index: number, levels: DataViewHierarchyLevel[], div: HTMLDivElement)  => {
    // generate selectionID for each node of matrix
    const selectionID: ISelectionID = this.host.createSelectionIdBuilder()
        .withMatrixNode(matrixNode, levels)
        .createSelectionId();
    // ...
    if (matrixNode.children) {
        // create div element for level
        const childDiv = document.createElement("div");
        // add to current div
        div.appendChild(childDiv);
        // create paragraph element to display next
        const p = document.createElement("p");
        // display level name on paragraph element
        const level = levels[matrixNode.level];
        p.innerText = level.sources[level.sources.length - 1].displayName;
        // add paragraph element to created child div
        childDiv.appendChild(p);
        // traversing child nodes
        matrixNode.children.forEach((node, index) => treeWalker(node, index, levels, childDiv));
    }
}
Create buttons to interact with visual and display context menu for matrix datapoints:
const treeWalker = (matrixNode: DataViewMatrixNode, index: number, levels: DataViewHierarchyLevel[], div: HTMLDivElement)  => {
    // generate selectionID for each node of matrix
    const selectionID: ISelectionID = this.host.createSelectionIdBuilder()
        .withMatrixNode(matrixNode, levels)
        .createSelectionId();

    // create button element
    let button = document.createElement("button");
    // display node value/name of the button's text
    button.innerText = matrixNode.value.toString();

    // add event listener on click
    button.addEventListener("click", (event) => {
        // call select method in the selection manager
        this.selectionManager.select(selectionID);
    });

    // display context menu on click
    button.addEventListener("contextmenu", (event) => {
        // call showContextMenu method to display context menu on the visual
        this.selectionManager.showContextMenu(selectionID, {
            x: event.clientX,
            y: event.clientY
        });
        event.preventDefault();
    });

    div.appendChild(button);

    if (matrixNode.children) {
        // ...
    }
}
Clear div elements before render elements again:
public update(options: VisualUpdateOptions) {
    // ...
    const treeWalker = (matrixNode: DataViewMatrixNode, index: number, levels: DataViewHierarchyLevel[], div: HTMLDivElement)  => {
        // ...
    }

    // remove old elements
    // to better performance use D3js pattern:
    // https://d3js.org/#enter-exit
    while (this.rowsDiv.firstChild) {
        this.rowsDiv.removeChild(this.rowsDiv.firstChild);
    }
    // create label for row elements
    const prow = document.createElement("p");
    prow.innerText = "Rows";
    this.rowsDiv.appendChild(prow);

    while (this.colsDiv.firstChild) {
        this.colsDiv.removeChild(this.colsDiv.firstChild);
    }
    // create label for columns elements
    const pcol = document.createElement("p");
    pcol.innerText = "Columns";
    this.colsDiv.appendChild(pcol);

    // render elements for rows
    const rowRoot: DataViewMatrixNode = matrixDataView.rows.root;
    rowRoot.children.forEach((node, index) => treeWalker(node, index, matrixDataView.rows.levels, this.rowsDiv));

    // render elements for columns
    const colRoot = matrixDataView.columns.root;
    colRoot.children.forEach((node, index) => treeWalker(node, index, matrixDataView.columns.levels, this.colsDiv));
}
Finally, you should get a visual with context menu: