Note
Access to this page requires authorization. You can try signing in or changing directories.
Access to this page requires authorization. You can try changing directories.
Datamarts let you create reusable and auto-generated semantic models to create reports in various ways in Power BI. This article describes the various ways you can use datamarts, and their auto-generated semantic models, to create reports.
Important
Since November 1, 2025, Power BI datamarts are no longer supported, and datamarts are not accessible from workspaces. To avoid losing your data and breaking reports built on top of datamarts, migrate your datamart to warehouse. To learn more, see Upgrade a Power BI Datamart to a Warehouse.
For example, you can establish a live connection to a shared semantic model in the Power BI service and create many different reports from the same semantic model. You can create your perfect data model in Power BI Desktop and publish it to the Power BI service. Then you and others can create multiple different reports in separate .pbix files from that common data model and save them to different workspaces. Advanced users can build reports from a datamart using a composite model or using the SQL Endpoint.
Reports that use datamarts can be created in either of the following two tools:
- Using the Power BI service
- Using Power BI Desktop
Let's take a look at how datamarts can be used with each, in turn.
Create reports in the Power BI service
Scenario 1: From within the datamart experience, using the ribbon and the main home tab, navigate to the New report button. This provides a native, quick way to create reports.
Selecting New report opens a browser tab to the report editing canvas to a new report that is built on the semantic model. When you save your new report you're prompted to choose a workspace, provided you have write permissions for that workspace. If you don't have write permissions, or if you're a free user and the semantic model resides in a Premium-capacity workspace, the new report is saved in your My workspace.
Scenario 2: Using the auto-generated semantic model and action menu in the workspace: In the Power BI workspace, navigate to the auto-generated semantic model and select the More menu (...) to create a report in the Power BI service.
Selecting the More opens the report editing canvas to a new report that is built on the semantic model. When you save your new report, it's saved in the workspace that contains the semantic model as long as you have write permissions on that workspace. If you don't have write permissions, or if you're a free user and the semantic model resides in a Premium-capacity workspace, the new report is saved in your My workspace.
Scenario 3: Using the auto-generated semantic model and semantic model details page. In the Power BI workspace list, select the auto-generated semantic model's name to get to the semantic model details page, where you can find details about the semantic model and see related reports. You can also create a report directly from this page. To learn more about creating a report in this fashion, see semantic model details.
In the data hub, you see datamarts and their associated auto-generated semantic models. Select the datamart to navigate to the datamart's details page where you can see the datamart’s metadata, supported actions, lineage and impact analysis, along with related reports created from that datamart. Auto-generated semantic models derived from datamarts behave the same as any semantic model.
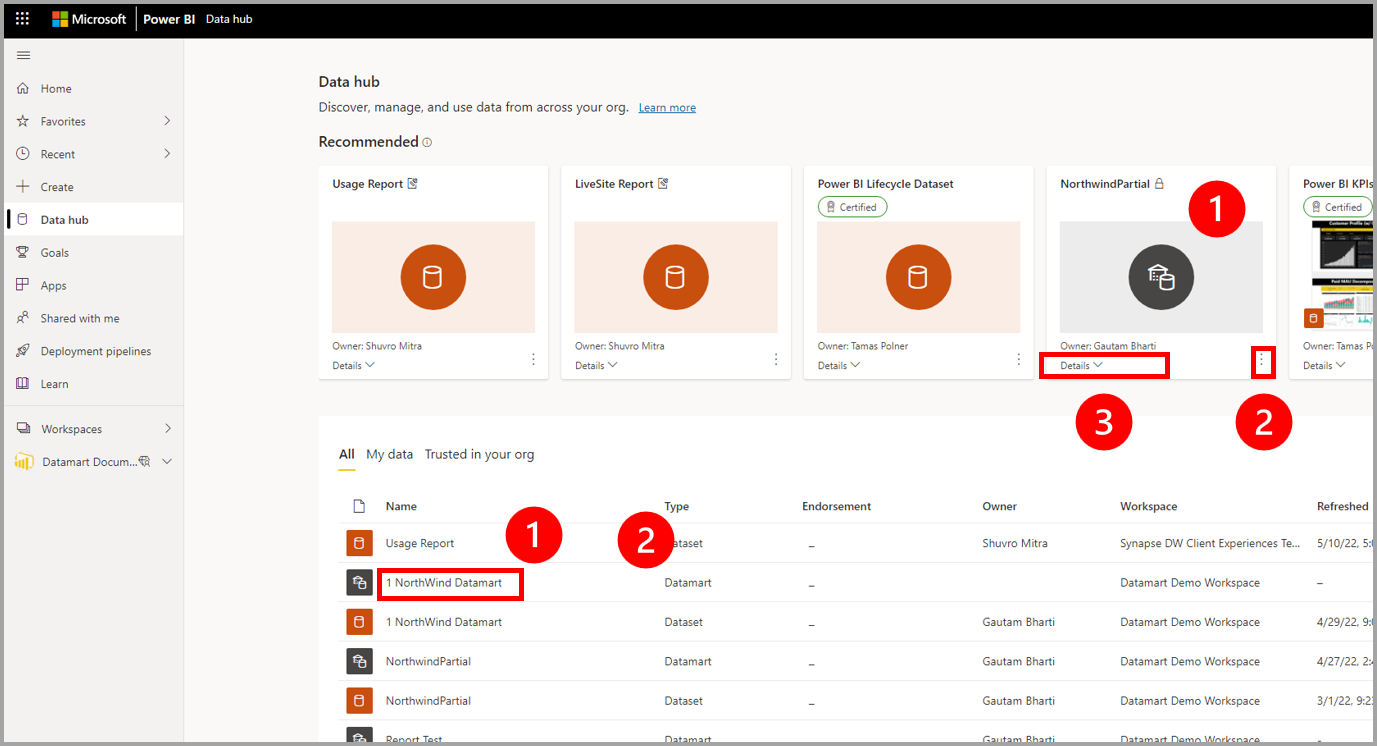
To find the datamart, you begin with the data hub. The image below shows the data hub in the Power BI service, with the following numbered information:
- Select a datamart to view its datamart details page
- Select the More menu (...) to display the options menu
- Select Details to view details summary.
Create reports using Power BI Desktop
You can build reports from semantic models with Power BI Desktop using a Live connection to the semantic model. For information on how to make the connection, see connect to semantic models from Power BI Desktop.
For advanced situations where you want to add more data or change the storage mode, see use composite models in Power BI Desktop.
Complete the following steps to connect to a datamart in Power BI Desktop:
- Navigate to the datamart settings in your workspace and copy the SQL endpoint connection string.
- In Power BI Desktop select the SQL Server connector from the ribbon or from Get Data.
- Paste the connection string into the connector dialog.
- For authentication, select organizational account.
- Authenticate using Microsoft Entra ID - MFA (the same way you would connect to Power BI)
- Select Connect.
- Select the data items you want to include or not include in your semantic model.
For more information, see connect to on-premises data in SQL Server. You don't need to set up a gateway with datamarts to use them in Power BI.
Related content
This article provided information about creating reports using datamarts.
The following articles provide more information about datamarts and Power BI:
- Introduction to datamarts
- Understand datamarts
- Get started with datamarts
- Analyzing datamarts
- Access control in datamarts
- Datamart administration
For more information about dataflows and transforming data, see the following articles:
