Note
Access to this page requires authorization. You can try signing in or changing directories.
Access to this page requires authorization. You can try changing directories.
Microsoft provides a variety of monitoring tools and processes to help you maintain the health and performance of your Power Platform apps and services. A key component of your monitoring efforts is end-to-end traceability.
Tip
The article provides an example scenario and visual representation of how to trace events across multiple services. This solution is a generalized example scenario architecture, which can be used for many different scenarios and industries.
Architecture diagram
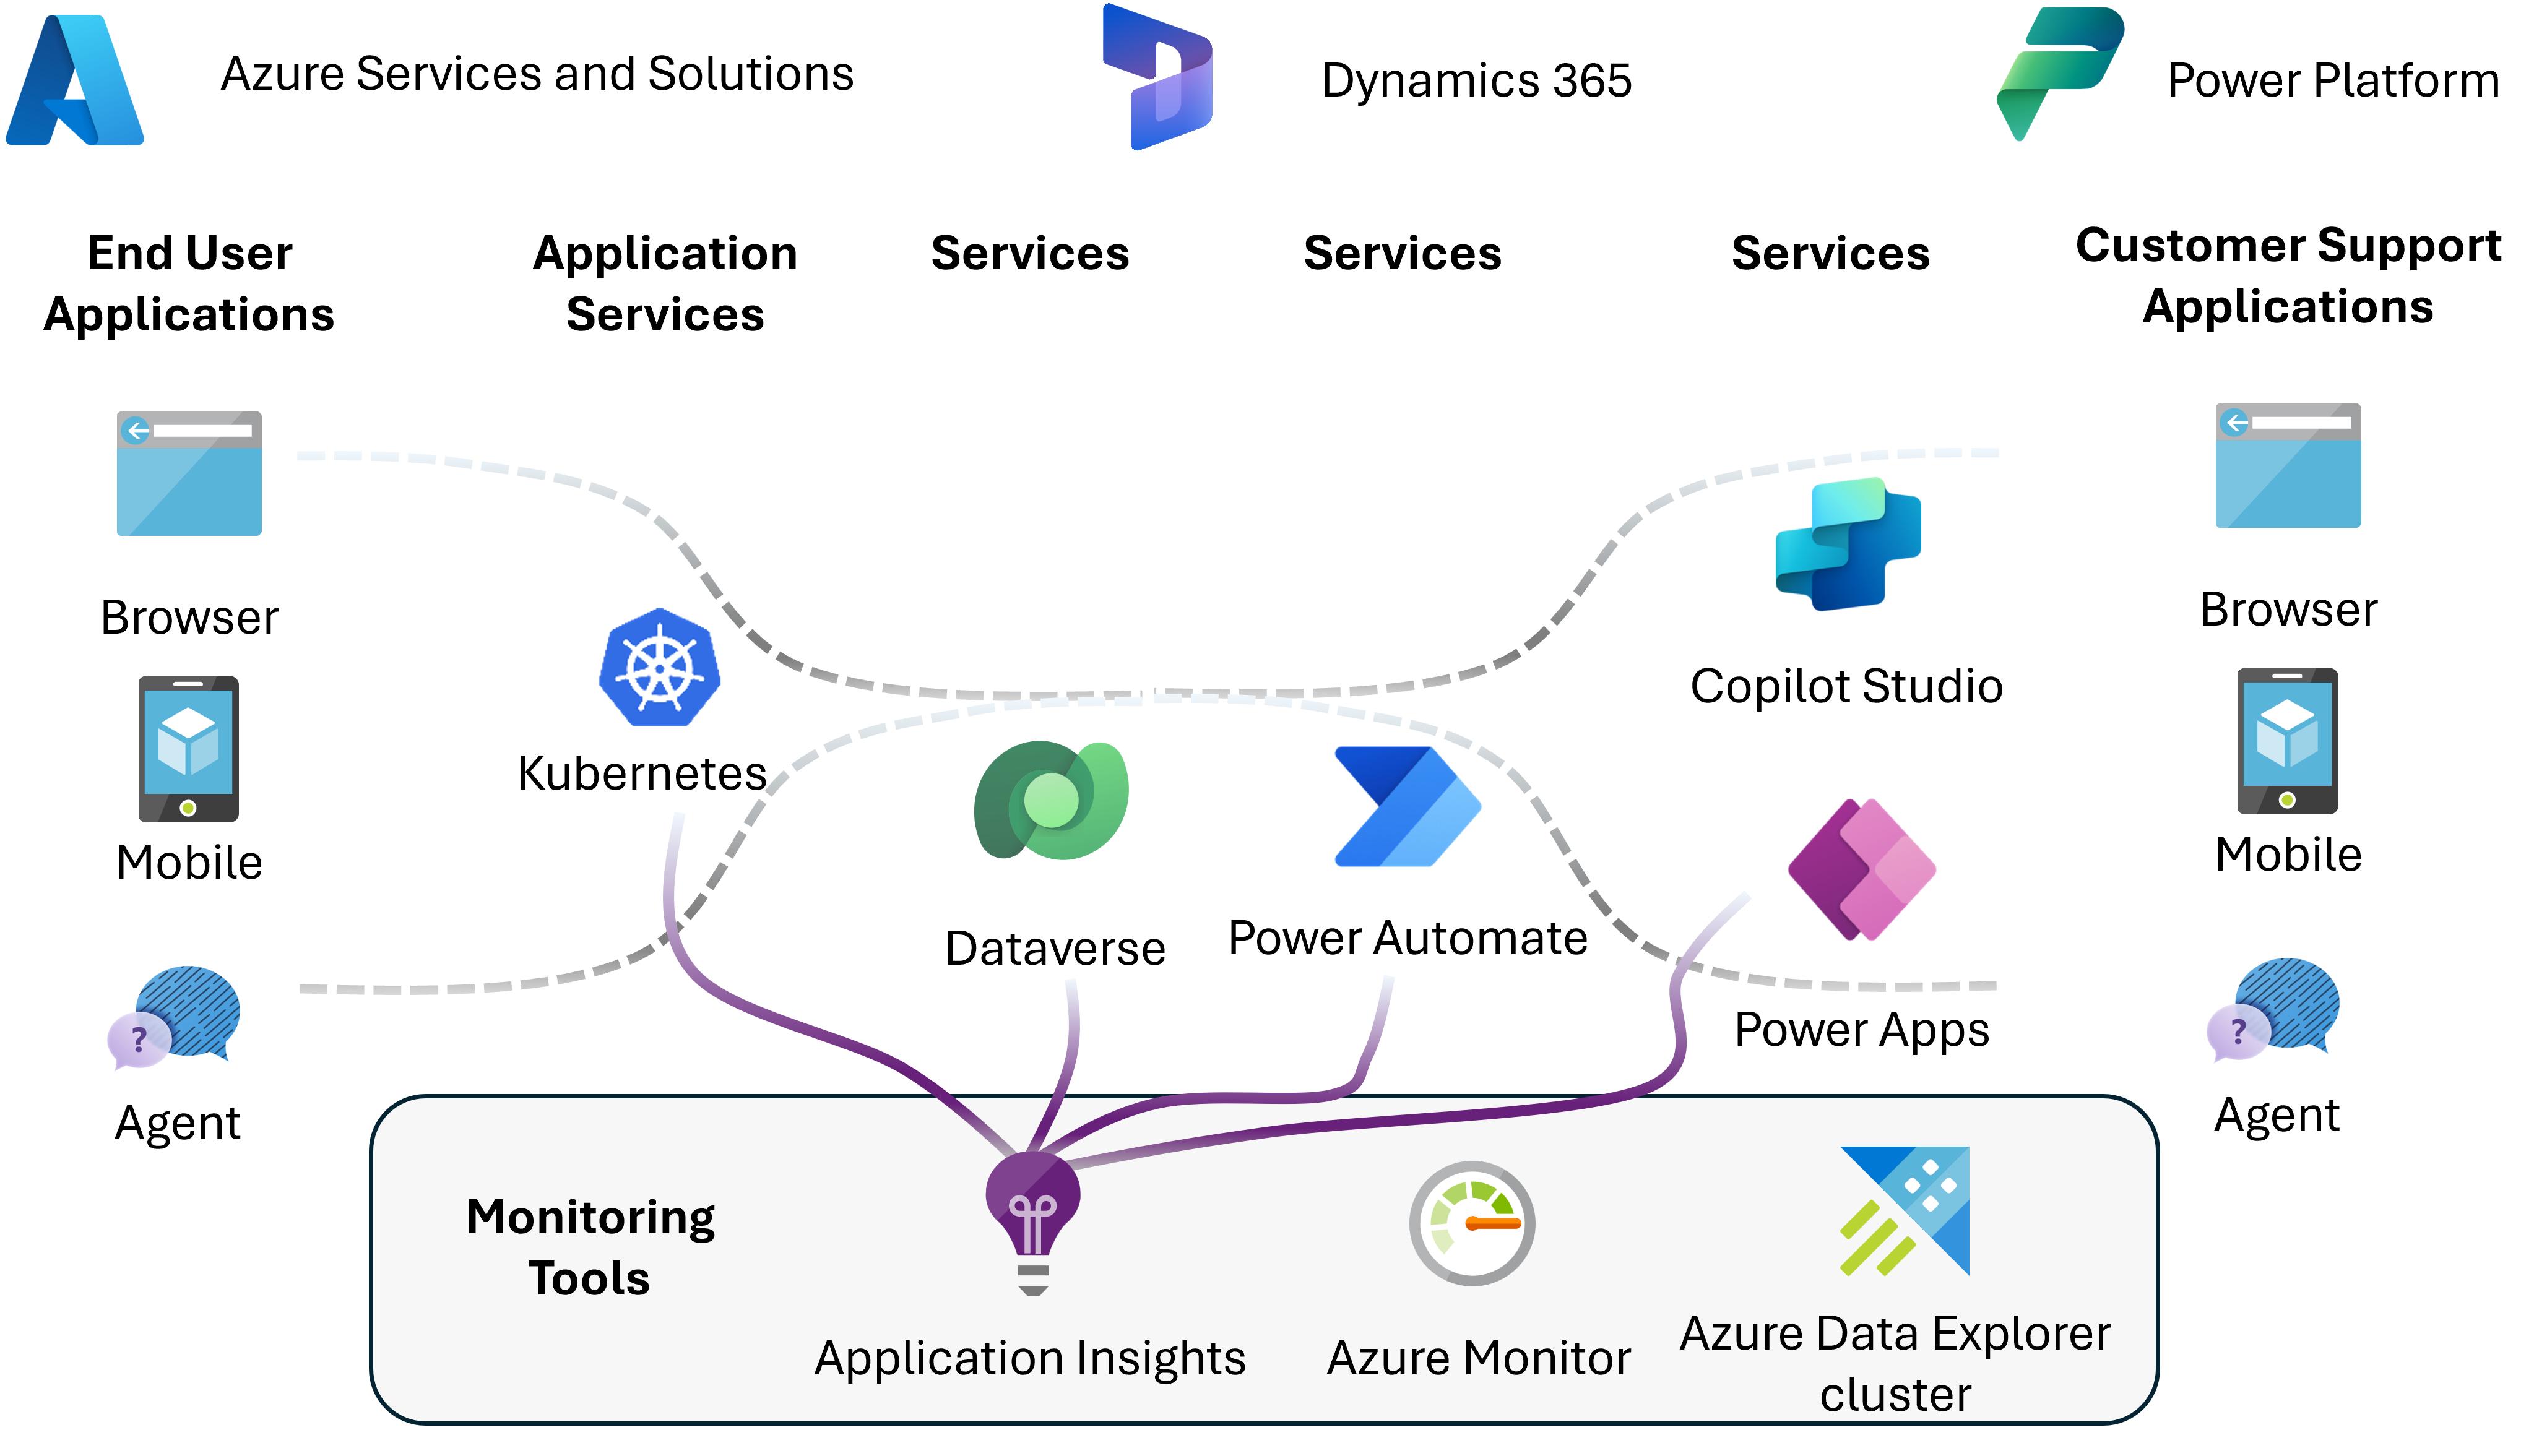
Workflow
The following steps describe the Azure to Dataverse Web API workflow that's shown in the example architecture diagram:
End user applications: Azure services and solutions like Azure Functions, web services, and Kubernetes start a distributed transaction that's related to a specific event generated by the user or an agent.
Dataverse Web API: Azure services add a trace parent to requests to Dataverse entities and custom APIs. The trace parent can be included in the request body or tag query string.
The trace parent is a W3C Trace Context header that contains the trace ID, span ID, and other information about the request. The header is used to correlate telemetry data across different components in the architecture.
Dataverse messages: Requests are sent to Dataverse as messages. Messages can relate to an entity or a custom defined API and can have pre- and post- actions applied to them. These actions can be an Application Insights distributed tracking.
Plug-ins: Use Dataverse C# plug-ins to generate distributed tracing telemetry to relate the Azure request to the Dataverse action.
Azure Monitor: Create KQL queries to query and correlate telemetry across components.
The following steps describe the Power Platform workflow:
Instrument: Configure the Power Platform resource with the Application Insights connection string/key.
Trace: Copilot Studio, Power Apps, and Power Automate start a transaction by calling a custom Dataverse API.
Components
The example architecture includes monitoring tools and services and the Power Platform components that generate telemetry data.
Monitoring tools and services
Azure Monitor is a comprehensive solution for collecting, analyzing, and acting on telemetry from your cloud and on-premises environments. It uses Kusto Query Language (KQL) to query and correlate telemetry data across different components. Learn more in Get started with log queries in Azure Monitor logs and Query data in Azure Monitor using Azure Data Explorer.
Application Insights is an OpenTelemetry feature of Azure Monitor that allows you to monitor web applications, services, and other components in your architecture. It provides powerful analytics tools to help you diagnose issues and understand what users actually do with your app.
Azure Data Explorer is a fast and highly scalable analytics platform that's designed to analyze large volumes of data in near real time. You can use Azure Data Explorer to query and analyze telemetry data from Application Insights, Azure Monitor, and other Azure services.
Power Platform components
Microsoft Dataverse is the data platform that underlies much of the Microsoft Cloud, including Power Platform. You can use Application Insights to receive diagnostics and performance telemetry from Dataverse. Learn more in Analyze model-driven apps and Microsoft Dataverse telemetry with Application Insights.
Copilot Studio is a graphical, low-code tool for building agents and agent flows. You can capture telemetry data from your agents to monitor their performance with Application Insights. Learn more in Capture telemetry with Application Insights.
Power Apps canvas apps are a blank canvas on which you drop components to build a user interface to data sources. You can monitor your canvas apps with Application Insights. Learn more in Analyze system-generated logs using Application Insights.
Power Apps model-driven apps are apps that you build using data models and predefined components. Like canvas apps, model-driven apps generate telemetry that you can monitor with Application Insights. Learn more in Analyze model-driven apps and Microsoft Dataverse telemetry with Application Insights.
Power Automate is a graphical, low-code tool for building automated workflows. You can export cloud flow telemetry data to Application Insights at the environment level. Learn more in Set up Application Insights with Power Automate.
Power BI is a collection of software services, apps, and connectors that work together to turn sometimes unrelated sources of data into coherent, visually immersive, and interactive insights. You can use it to query and visualize telemetry data.
Scenario details
This architecture is designed to allow telemetry to be correlated across multiple components within Power Platform and from systems outside Power Platform by implementing the W3C Trace Context recommendation to:
- Correlate trace and request records in Application Insights using dependency records.
- Support end-to-end traceability of operations.
- Enable teams to configure telemetry to diagnose and resolve issues.
- Allow external systems to pass distributed tracing context to Power Platform.
- Include Power Platform components in a distributed tracing session.
Considerations
These considerations implement the pillars of Power Platform Well-Architected, a set of guiding tenets that improve the quality of a workload. Learn more in Microsoft Power Platform Well-Architected.
Reliability
Ensure that the implemented solution fits into your monitoring and alerting strategy.
Operational Excellence
To effectively monitor your workload for security, performance, and reliability, you need a comprehensive system with its own stack that provides the foundation for all monitoring, detection, and alerting functions. Learn more in Recommendations for designing and creating a monitoring system.
Performance Efficiency
The suggestions in this example scenario allow you to collect workload performance data recommendation for Power Platform workloads.
Next step
Contributors
Microsoft maintains this article. The following contributors wrote this article.
Principal authors:
- Grant Archibald, Senior Program Manager