Quickstart: Detect motion and emit events
![]()
Alternatively, check out topics under Create video applications in the service.
Note
Azure Video Analyzer has been retired and is no longer available.
Azure Video Analyzer for Media is not affected by this retirement. It is now rebranded to Azure Video Indexer. Click here to read more.
This quickstart walks you through the steps to get started with Azure Video Analyzer. It uses an Azure VM as an IoT Edge device and a simulated live video stream. After completing the setup steps, you'll be able to run a simulated live video stream through a video pipeline that detects and reports any motion in that stream. The following diagram shows a graphical representation of that pipeline.

This article is based on sample code written in C#.
This article is based on sample code written in Python.
Prerequisites
An Azure account that includes an active subscription. Create an account for free if you don't already have one.
Note
You will need an Azure subscription where you have access to both Contributor role, and User Access Administrator role. If you do not have the right permissions, please reach out to your account administrator to grant you those permissions.
Visual Studio Code, with the following extensions:
Tip
When you're installing the Azure IoT Tools extension, you might be prompted to install Docker. Feel free to ignore the prompt.
Set up Azure resources
The deployment process will take about 20 minutes. Upon completion, you will have certain Azure resources deployed in the Azure subscription, including:
- Video Analyzer account - This cloud service is used to register the Video Analyzer edge module, and for playing back recorded video and video analytics.
- Storage account - For storing recorded video and video analytics.
- Managed Identity - This is the user assigned managed identity used to manage access to the above storage account.
- Virtual machine - This is a virtual machine that will serve as your simulated edge device.
- IoT Hub - This acts as a central message hub for bi-directional communication between your IoT application, IoT Edge modules and the devices it manages.
In addition to the resources mentioned above, following items are also created in the 'deployment-output' file share in your storage account, for use in quickstarts and tutorials:
- appsettings.json - This file contains the device connection string and other properties needed to run the sample application in Visual Studio Code.
- env.txt - This file contains the environment variables that you will need to generate deployment manifests using Visual Studio Code.
- deployment.json - This is the deployment manifest used by the template to deploy edge modules to the simulated edge device.
Tip
If you run into issues creating all of the required Azure resources, please use the manual steps in this quickstart.
Overview
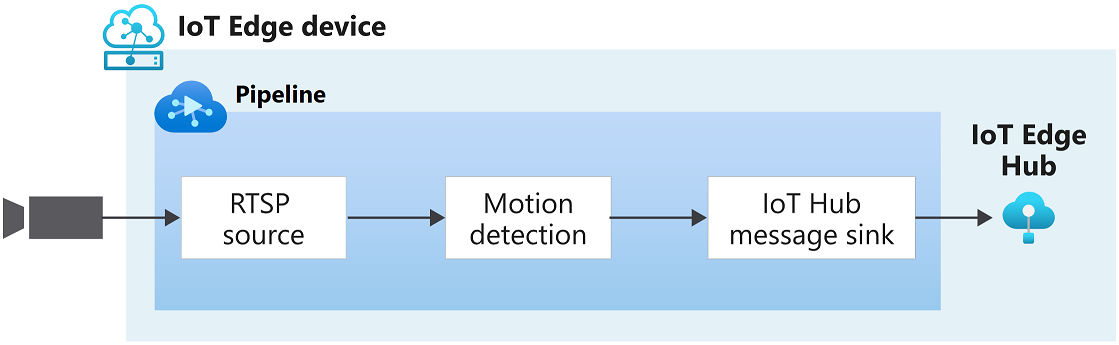
This diagram shows you how the signal flows in this quickstart. An edge module simulates an IP camera hosting a Real-Time Streaming Protocol (RTSP) server. An RTSP source node pulls the video feed from this server and sends video frames to the motion detection processor node. The motion detection processor node enables you to detect motion in live video. It examines incoming video frames and determines if there is movement in the video. If motion is detected, it passes on the video frame to the next node in the pipeline, and emits an event. Finally, any emitted events are sent to the IoT hub message sink where they are published to IoT Hub.
Set up your development environment
Get the sample code
Clone the AVA C# samples repository.
Start Visual Studio Code, and open the folder where the repo has been downloaded.
In Visual Studio Code, browse to the src/cloud-to-device-console-app folder and create a file named appsettings.json. This file contains the settings needed to run the program.
Browse to the file share in the storage account created in the setup step above, and locate the appsettings.json file under the "deployment-output" file share. Click on the file, and then hit the "Download" button. The contents should open in a new browser tab, which should look like:
{
    "IoThubConnectionString" : "HostName=xxx.azure-devices.net;SharedAccessKeyName=iothubowner;SharedAccessKey=XXX",
    "deviceId" : "avasample-iot-edge-device",
    "moduleId" : "avaedge"
}
The IoT Hub connection string lets you use Visual Studio Code to send commands to the edge modules via Azure IoT Hub. Copy the above JSON into the src/cloud-to-device-console-app/appsettings.json file.
Next, browse to the src/edge folder and create a file named .env. This file contains properties that Visual Studio Code uses to deploy modules to an edge device.
Browse to the file share in the storage account created in the setup step above, and locate the env.txt file under the "deployment-output" file share. Click on the file, and then hit the "Download" button. The contents should open in a new browser tab, which should look like:
     SUBSCRIPTION_ID="<Subscription ID>"
     RESOURCE_GROUP="<Resource Group>"
     AVA_PROVISIONING_TOKEN="<Provisioning token>"
     VIDEO_INPUT_FOLDER_ON_DEVICE="/home/localedgeuser/samples/input"
     VIDEO_OUTPUT_FOLDER_ON_DEVICE="/var/media"
     APPDATA_FOLDER_ON_DEVICE="/var/lib/videoanalyzer"
     CONTAINER_REGISTRY_USERNAME_myacr="<your container registry username>"
     CONTAINER_REGISTRY_PASSWORD_myacr="<your container registry password>"
Copy the JSON from your env.txt into the src/edge/.env file.
Connect to the IoT Hub
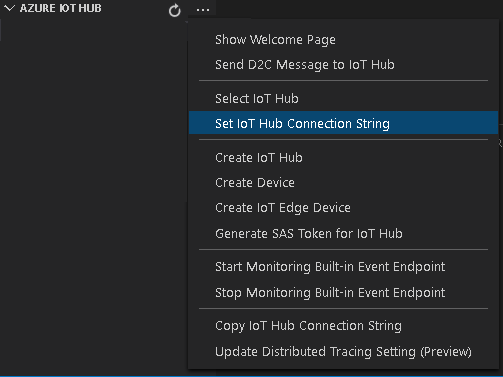
In Visual Studio Code, set the IoT Hub connection string by selecting the More actions icon next to the AZURE IOT HUB pane in the lower-left corner. Copy the string from the src/cloud-to-device-console-app/appsettings.json file.
Note
You might be asked to provide Built-in endpoint information for the IoT Hub. To get that information, in Azure portal, navigate to your IoT Hub and look for Built-in endpoints option in the left navigation pane. Click there and look for the Event Hub-compatible endpoint under Event Hub compatible endpoint section. Copy and use the text in the box. The endpoint will look something like this:
Endpoint=sb://iothub-ns-xxx.servicebus.windows.net/;SharedAccessKeyName=iothubowner;SharedAccessKey=XXX;EntityPath=<IoT Hub name>In about 30 seconds, refresh Azure IoT Hub in the lower-left section. You should see the edge device
avasample-iot-edge-device, which should have the following modules deployed:- Edge Hub (module name edgeHub)
- Edge Agent (module name edgeAgent)
- Video Analyzer (module name avaedge)
- RTSP simulator (module name rtspsim)
Prepare to monitor the modules
When you use run this quickstart or tutorial, events will be sent to the IoT Hub. To see these events, follow these steps:
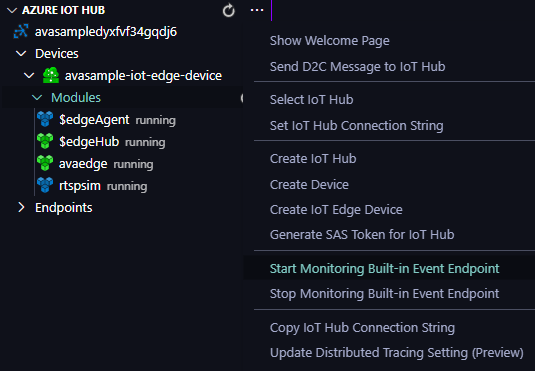
Open the Explorer pane in Visual Studio Code, and look for Azure IoT Hub in the lower-left corner.
Expand the Devices node.
Right-click on
avasample-iot-edge-device, and select Start Monitoring Built-in Event Endpoint.Note
You might be asked to provide Built-in endpoint information for the IoT Hub. To get that information, in Azure portal, navigate to your IoT Hub and look for Built-in endpoints option in the left navigation pane. Click there and look for the Event Hub-compatible endpoint under Event Hub compatible endpoint section. Copy and use the text in the box. The endpoint will look something like this:
Endpoint=sb://iothub-ns-xxx.servicebus.windows.net/;SharedAccessKeyName=iothubowner;SharedAccessKey=XXX;EntityPath=<IoT Hub name>
Get the sample code
Clone the AVA Python samples repository.
Start Visual Studio Code, and open the folder where the repo has been downloaded.
In Visual Studio Code, browse to the src/cloud-to-device-console-app folder and create a file named appsettings.json. This file contains the settings needed to run the program.
Browse to the file share in the storage account created in the setup step above, and locate the appsettings.json file under the "deployment-output" file share. Click on the file, and then hit the "Download" button. The contents should open in a new browser tab, which should look like:
{
  "IoThubConnectionString": "HostName=xxx.azure-devices.net;SharedAccessKeyName=iothubowner;SharedAccessKey=XXX",
  "deviceId": "avasample-iot-edge-device",
  "moduleId": "avaedge"
}
The IoT Hub connection string lets you use Visual Studio Code to send commands to the edge modules via Azure IoT Hub. Copy the above JSON into the src/cloud-to-device-console-app/appsettings.json file.
Next, browse to the src/edge folder and create a file named .env. This file contains properties that Visual Studio Code uses to deploy modules to an edge device.
Browse to the file share in the storage account created in the setup step above, and locate the env.txt file under the "deployment-output" file share. Click on the file, and then hit the "Download" button. The contents should open in a new browser tab, which should look like:
     SUBSCRIPTION_ID="<Subscription ID>"
     RESOURCE_GROUP="<Resource Group>"
     AVA_PROVISIONING_TOKEN="<Provisioning token>"
     VIDEO_INPUT_FOLDER_ON_DEVICE="/home/localedgeuser/samples/input"
     VIDEO_OUTPUT_FOLDER_ON_DEVICE="/var/media"
     APPDATA_FOLDER_ON_DEVICE="/var/lib/videoanalyzer"
     CONTAINER_REGISTRY_USERNAME_myacr="<your container registry username>"
     CONTAINER_REGISTRY_PASSWORD_myacr="<your container registry password>"
Copy the JSON from your env.txt into the src/edge/.env file.
Connect to the IoT Hub
In Visual Studio Code, set the IoT Hub connection string by selecting the More actions icon next to the AZURE IOT HUB pane in the lower-left corner. Copy the string from the src/cloud-to-device-console-app/appsettings.json file.
Note
You might be asked to provide Built-in endpoint information for the IoT Hub. To get that information, in Azure portal, navigate to your IoT Hub and look for Built-in endpoints option in the left navigation pane. Click there and look for the Event Hub-compatible endpoint under Event Hub compatible endpoint section. Copy and use the text in the box. The endpoint will look something like this:
Endpoint=sb://iothub-ns-xxx.servicebus.windows.net/;SharedAccessKeyName=iothubowner;SharedAccessKey=XXX;EntityPath=<IoT Hub name>In about 30 seconds, refresh Azure IoT Hub in the lower-left section. You should see the edge device
avasample-iot-edge-device, which should have the following modules deployed:- Edge Hub (module name edgeHub)
- Edge Agent (module name edgeAgent)
- Video Analyzer (module name avaedge)
- RTSP simulator (module name rtspsim)
Prepare to monitor the modules
When you use run this quickstart or tutorial, events will be sent to the IoT Hub. To see these events, follow these steps:
Open the Explorer pane in Visual Studio Code, and look for Azure IoT Hub in the lower-left corner.
Expand the Devices node.
Right-click on
avasample-iot-edge-device, and select Start Monitoring Built-in Event Endpoint.Note
You might be asked to provide Built-in endpoint information for the IoT Hub. To get that information, in Azure portal, navigate to your IoT Hub and look for Built-in endpoints option in the left navigation pane. Click there and look for the Event Hub-compatible endpoint under Event Hub compatible endpoint section. Copy and use the text in the box. The endpoint will look something like this:
Endpoint=sb://iothub-ns-xxx.servicebus.windows.net/;SharedAccessKeyName=iothubowner;SharedAccessKey=XXX;EntityPath=<IoT Hub name>
Review the sample video
When you set up the Azure resources, a short video of highway traffic is copied to the Linux VM in Azure that you're using as the IoT Edge device. This quickstart uses the video file to simulate a live stream.
Open an application such as VLC media player. Select Ctrl+N and then paste a link to the highway intersection sample video to start playback. You see the footage of many vehicles moving in highway traffic.
Examine the sample files
In Visual Studio Code, go to src/edge. You'll see the .env file and a few deployment template files.
The deployment template refers to the deployment manifest for the edge device, where variables are used for some properties. The .env file contains the values for those variables.
Go to the src/cloud-to-device-console-app folder. Here you see the appsettings.json file and a few other files:
c2d-console-app.csproj - The project file for Visual Studio Code.
operations.json - A list of the operations that you want the program to run.
Program.cs - The sample program code. This code:
- Loads the app settings.
- Invokes direct methods that are exposed by the Video Analyzer edge module. You can use the module to analyze live video streams by invoking its direct methods.
- Pauses so you can examine the program's output in the TERMINAL window and examine the events generated by the module in the OUTPUT window.
- Invokes direct methods to clean up resources.
In Visual Studio Code, go to src/edge. You'll see the .env file and a few deployment template files.
The deployment template refers to the deployment manifest for the edge device, where variables are used for some properties. The .env file contains the values for those variables.
Go to the src/cloud-to-device-console-app folder. Here you see the appsettings.json file and a few other files:
operations.json - A list of the operations that you want the program to run.
main.py - The sample program code. This code:
- Loads the app settings.
- Invokes direct methods that are exposed by the Azure Video Analyzer module. You can use the module to analyze live video streams by invoking its direct methods.
- Pauses so you can examine the program's output in the TERMINAL window and examine the events generated by the module in the OUTPUT window.
- Invokes direct methods to clean up resources.
Generate and deploy the deployment manifest
The deployment manifest defines what modules are deployed to an edge device. It also defines configuration settings for those modules.
Follow these steps to generate the manifest from the template file and then deploy it to the edge device.
Open Visual Studio Code.
Next to the AZURE IOT HUB pane, select the More actions icon to set the IoT Hub connection string. You can copy the string from the src/cloud-to-device-console-app/appsettings.json file.
Note
You might be asked to provide Built-in endpoint information for the IoT Hub. To get that information, in Azure portal, navigate to your IoT Hub and look for Built-in endpoints option in the left navigation pane. Click there and look for the Event Hub-compatible endpoint under Event Hub compatible endpoint section. Copy and use the text in the box. The endpoint will look something like this:
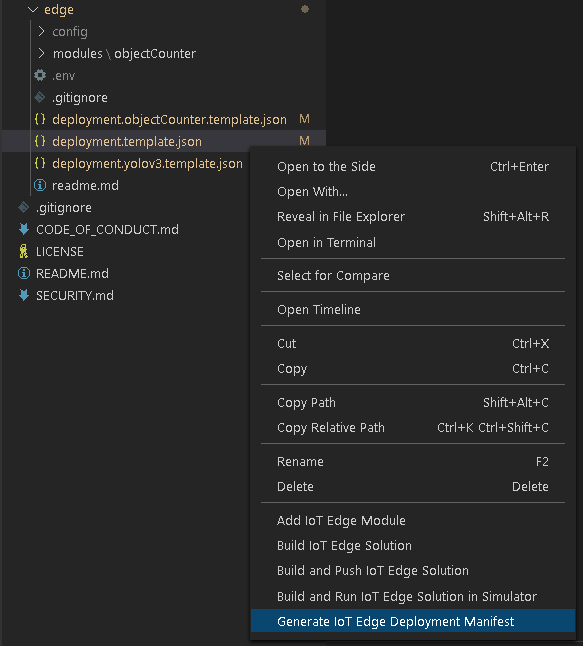
Endpoint=sb://iothub-ns-xxx.servicebus.windows.net/;SharedAccessKeyName=iothubowner;SharedAccessKey=XXX;EntityPath=<IoT Hub name>Right-click src/edge/deployment.template.json and select Generate IoT Edge Deployment Manifest.
This action should create a manifest file named deployment.amd64.json in the src/edge/config folder.
Right-click src/edge/config/deployment.amd64.json, select Create Deployment for Single Device, and then select the name of your edge device.
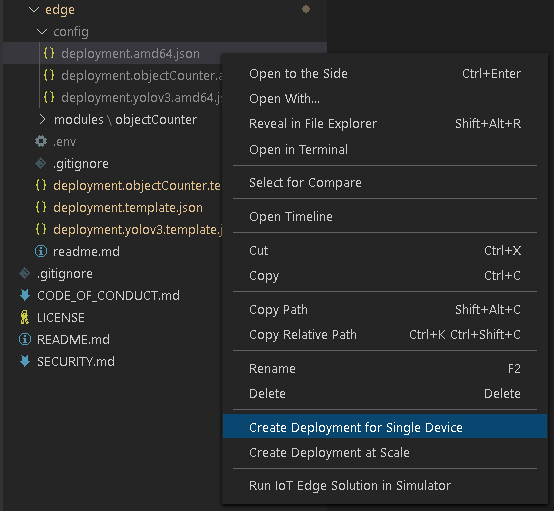
When you're prompted to select an IoT Hub device, choose avasample-iot-edge-device from the drop-down menu.
After about 30 seconds, in the lower-left corner of the window, refresh Azure IoT Hub. The edge device now shows the following deployed modules:
- Video Analyzer edge module (module name
avaedge) - Real-Time Streaming Protocol (RTSP) simulator (module name
rtspsim)
- Video Analyzer edge module (module name
The deployment manifest defines what modules are deployed to an edge device. It also defines configuration settings for those modules.
Follow these steps to generate the manifest from the template file and then deploy it to the edge device.
Open Visual Studio Code.
Next to the AZURE IOT HUB pane, select the More actions icon to set the IoT Hub connection string. You can copy the string from the src/cloud-to-device-console-app/appsettings.json file.
Note
You might be asked to provide Built-in endpoint information for the IoT Hub. To get that information, in Azure portal, navigate to your IoT Hub and look for Built-in endpoints option in the left navigation pane. Click there and look for the Event Hub-compatible endpoint under Event Hub compatible endpoint section. Copy and use the text in the box. The endpoint will look something like this:
Endpoint=sb://iothub-ns-xxx.servicebus.windows.net/;SharedAccessKeyName=iothubowner;SharedAccessKey=XXX;EntityPath=<IoT Hub name>Right-click src/edge/deployment.template.json and select Generate IoT Edge Deployment Manifest.
This action should create a manifest file named deployment.amd64.json in the src/edge/config folder.
Right-click src/edge/config/deployment.amd64.json, select Create Deployment for Single Device, and then select the name of your edge device.
When you're prompted to select an IoT Hub device, choose avasample-iot-edge-device from the drop-down menu.
After about 30 seconds, in the lower-left corner of the window, refresh Azure IoT Hub. The edge device now shows the following deployed modules:
- Azure Video Analyzer (module name
avaedge) - Real-Time Streaming Protocol (RTSP) simulator (module name
rtspsim)
- Azure Video Analyzer (module name
Prepare to monitor events
You'll use the Video Analyzer edge module to detect motion in the incoming live video stream and send events to IoT Hub. To see these events, follow these steps:
Open the Explorer pane in Visual Studio Code and look for Azure IoT Hub in the lower-left corner.
Expand the Devices node.
Right-click avasample-iot-edge-device and select Start Monitoring Built-in Event Endpoint.
Note
You might be asked to provide Built-in endpoint information for the IoT Hub. To get that information, in Azure portal, navigate to your IoT Hub and look for Built-in endpoints option in the left navigation pane. Click there and look for the Event Hub-compatible endpoint under Event Hub compatible endpoint section. Copy and use the text in the box. The endpoint will look something like this:
Endpoint=sb://iothub-ns-xxx.servicebus.windows.net/;SharedAccessKeyName=iothubowner;SharedAccessKey=XXX;EntityPath=<IoT Hub name>
You will use the Azure Video Analyzer module to detect motion in the incoming live video stream and send events to IoT Hub. To see these events, follow these steps:
- Open the Explorer pane in Visual Studio Code and look for Azure IoT Hub in the lower-left corner.
- Expand the Devices node.
- Right-click avasample-iot-edge-device and select Start Monitoring Built-in Event Endpoint.
Note
You might be asked to provide Built-in endpoint information for the IoT Hub. To get that information, in Azure portal, navigate to your IoT Hub and look for Built-in endpoints option in the left navigation pane. Click there and look for the Event Hub-compatible endpoint under Event Hub compatible endpoint section. Copy and use the text in the box. The endpoint will look something like this: Endpoint=sb://iothub-ns-xxx.servicebus.windows.net/;SharedAccessKeyName=iothubowner;SharedAccessKey=XXX;EntityPath=<IoT Hub name>
Run the sample program
Follow these steps to run the sample code:
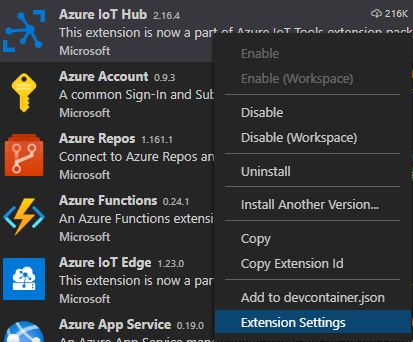
In Visual Studio Code, open the Extensions tab (or press Ctrl+Shift+X) and search for Azure IoT Hub.
Right click and select Extension Settings.
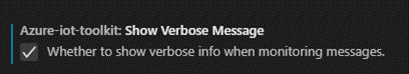
Search and enable “Show Verbose Message”.
In Visual Studio Code, go to src/cloud-to-device-console-app/operations.json.
On the pipelineTopologySet node, make sure you see the following value:
"pipelineTopologyUrl" : "https://raw.githubusercontent.com/Azure/video-analyzer/main/pipelines/live/topologies/motion-detection/topology.json"On the
livePipelineSetandlivePipelineDeletenodes, ensure that the value of topologyName matches the value of the name property in the pipeline topology:"topologyName" : "MotionDetection"Start a debugging session by selecting the F5 key. The TERMINAL window will display some messages.
The operations.json file starts off with calls to
pipelineTopologyListandlivePipelineList. If you cleaned up resources after you finished previous quickstarts, then this process will return empty lists.----------------------- Request: pipelineTopologyList -------------------------------------------------- { "@apiVersion": "1.1" } --------------- Response: pipelineTopologyList - Status: 200 --------------- { "value": [] } --------------------------------------------------------------------------The TERMINAL window shows the next set of direct method calls:
- A call to
pipelineTopologySetthat uses the preceding pipelineTopologyUrl - A call to
livePipelineSetthat uses the following body:
{ "@apiVersion": "1.1", "name": "Sample-Pipeline-1", "properties": { "topologyName": "MotionDetection", "description": "Sample pipeline description", "parameters": [ { "name": "rtspUrl", "value": "rtsp://rtspsim:554/media/camera-300s.mkv" }, { "name": "rtspUserName", "value": "testuser" }, { "name": "rtspPassword", "value": "testpassword" } ] } }- A call to
livePipelineActivatethat starts the live pipeline and the flow of video. - A second call to
livePipelineListthat shows that the live pipeline is in the running state.
- A call to
The output in the TERMINAL window pauses at
Press Enter to continue. Don't select Enter yet. Scroll up to see the JSON response payloads for the direct methods you invoked.Switch to the OUTPUT window in Visual Studio Code. You see messages that the Video Analyzer edge module is sending to the IoT hub. The following section of this quickstart discusses these messages.
The live pipeline continues to run and print results. The RTSP simulator keeps looping the source video. To stop the live pipeline, return to the TERMINAL window and select Enter.
The next series of calls cleans up resources:
- A call to
livePipelineDeactivatedeactivates the pipeline. - A call to
livePipelineDeletedeletes the pipeline. - A call to
pipelineTopologyDeletedeletes the topology. - A final call to
pipelineTopologyListshows that the list is empty.
- A call to
Follow these steps to run the sample code:
In Visual Studio Code, open the Extensions tab (or press Ctrl+Shift+X) and search for Azure IoT Hub.
Right click and select Extension Settings.
Search and enable “Show Verbose Message”.
In Visual Studio Code, go to src/cloud-to-device-console-app/operations.json.
On the
pipelineTopologySetnode, make sure you see the following value:"pipelineTopologyUrl" : "https://raw.githubusercontent.com/Azure/video-analyzer/main/pipelines/live/topologies/motion-detection/topology.json"On the
livePipelineSetandlivePipelineDeletenodes, ensure that the value of topologyName matches the value of the name property in the pipeline topology:"topologyName" : "MotionDetection"-
- Navigate to the
TERMINALwindow in VS Code - Use the cd command to navigate to /video-analyzer-iot-edge-python-main/src/cloud-to-device-console-app directory
- Run "python main.py" then you will see messages printed in the
TERMINALwindow
- Navigate to the
The operations.json file starts off with calls to
pipelineTopologyListandlivePipelineList. If you cleaned up resources after you finished previous quickstarts, then this process will return empty lists.----------------------- Request: pipelineTopologyList -------------------------------------------------- { "@apiVersion": "1.1" } --------------- Response: pipelineTopologyList - Status: 200 --------------- { "value": [] } --------------------------------------------------------------------------The TERMINAL window shows the next set of direct method calls:
- A call to
pipelineTopologySetthat uses the preceding pipelineTopologyUrl - A call to
livePipelineSetthat uses the following body:
{ "@apiVersion": "1.1", "name": "Sample-Pipeline-1", "properties": { "topologyName": "MotionDetection", "description": "Sample pipeline description", "parameters": [ { "name": "rtspUrl", "value": "rtsp://rtspsim:554/media/camera-300s.mkv" }, { "name": "rtspUserName", "value": "testuser" }, { "name": "rtspPassword", "value": "testpassword" } ] } }- A call to
livePipelineActivatethat starts the live pipeline and the flow of video. - A second call to
livePipelineListthat shows that the live pipeline is in the running state.
- A call to
The output in the TERMINAL window pauses at
Press Enter to continue. Don't select Enter yet. Scroll up to see the JSON response payloads for the direct methods you invoked.Switch to the OUTPUT window in Visual Studio Code. You see messages that the Azure Video Analyzer module is sending to the IoT hub. The following section of this quickstart discusses these messages.
The live pipeline continues to run and print results. The RTSP simulator keeps looping the source video. To stop the live pipeline, return to the TERMINAL window and select Enter.
The next series of calls cleans up resources:
- A call to
livePipelineDeactivatedeactivates the pipeline. - A call to
livePipelineDeletedeletes the pipeline. - A call to
pipelineTopologyDeletedeletes the topology. - A final call to
pipelineTopologyListshows that the list is empty.
- A call to
Interpret results
When you run the live pipeline, the results from the motion detector processor node pass through the IoT Hub message sink node to the IoT hub. The messages you see in the OUTPUT window of Visual Studio Code contain a body section and an applicationProperties section. For more information, see Create and read IoT Hub messages.
In the following messages, the Video Analyzer edge module defines the application properties and the content of the body.
MediaSessionEstablished event
When a live pipeline is activated, the RTSP source node attempts to connect to the RTSP server that runs on the rtspsim-live555 container. If the connection succeeds, then the following event is printed.
[IoTHubMonitor] [10:51:34 AM] Message received from [avasample-iot-edge-device/avaedge]:
{
  "body": {
  {
    "sdp": "SDP:\nv=0\r\no=- 1620204694595500 1 IN IP4 xxx.xxx.xxx.xxx\r\ns=Matroska video+audio+(optional)subtitles, streamed by the LIVE555 Media Server\r\ni=media/camera-300s.mkv\r\nt=0 0\r\na=tool:LIVE555 Streaming Media v2020.08.19\r\na=type:broadcast\r\na=control:*\r\na=range:npt=0-300.000\r\na=x-qt-text-nam:Matroska video+audio+(optional)subtitles, streamed by the LIVE555 Media Server\r\na=x-qt-text-inf:media/camera-300s.mkv\r\nm=video 0 RTP/AVP 96\r\nc=IN IP4 0.0.0.0\r\nb=AS:500\r\na=rtpmap:96 H264/90000\r\na=fmtp:96 packetization-mode=1;profile-level-id=4D0029;sprop-parameter-sets=Z00AKeKQCgC3YC3AQEBpB4kRUA==,aO48gA==\r\na=control:track1\r\n"
  },
  "properties": {
    "topic": "/subscriptions/00000000-0000-0000-0000-000000000000/resourceGroups/ava-sample-deployment/providers/Microsoft.Media/videoAnalyzers/avasample",
    "subject": "/edgeModules/avaedge/livePipelines/Sample-Pipeline-1/sources/rtspSource",
    "eventType": "Microsoft.VideoAnalyzer.Diagnostics.MediaSessionEstablished",
    "eventTime": "2021-05-06T00:58:58.602Z",
    "dataVersion": "1.0"
  },
  "systemProperties": {
    "iothub-connection-device-id": "avasample-iot-edge-device",
    "iothub-connection-module-id": "avaedge",
    "iothub-message-source": "Telemetry",
    "messageId": "459c3255-7c86-4ff5-a1e5-7ce3fcb07627",
    "contentType": "application/json",
    "contentEncoding": "utf-8"
  }
}
In the preceding output:
- The message is a diagnostics event, MediaSessionEstablished. It indicates that the RTSP source node (the subject) connected with the RTSP simulator and has begun to receive a (simulated) live feed.
- The sdp section contains data about the diagnostics event. In this case, the data comprises the Session Description Protocol (SDP) details.
MotionDetection event
When motion is detected, the Video Analyzer module sends an inference event. The**type is set to motion to indicate that it's a result from the motion detection processor.
Here's an example of this message:
{
  "body": {
    "timestamp": 145818422564951,
    "inferences": [
      {
        "type": "motion",
        "motion": {
          "box": {
            "l": 0.322176,
            "t": 0.574627,
            "w": 0.525,
            "h": 0.088889
          }
        }
      }
    ]
  },
  "properties": { … },
  "systemProperties": { … }
}
In this example:
The body value is data about the analytics event. In this case, the event is an inference event, so the body contains timestamp and inferences data.
The inferences data indicates that the type is motion. It has additional data about that motion event.
The box section contains the coordinates for a bounding box around the moving object. The values are normalized by the width and height of the video, in pixels. For example, to get the original pixel coordinates you would multiply the horizontal dimensions by 1920 and the vertical dimensions by 1080.
l - distance from left of image
t - distance from top of image
w - width of bounding box
h - height of bounding box
When you run the live pipeline, the results from the motion detector processor node pass through the IoT Hub message sink node to the IoT hub. The messages you see in the OUTPUT window of Visual Studio Code contain a body section and an applicationProperties section. For more information, see Create and read IoT Hub messages.
In the following messages, the Azure Video Analyzer module defines the application properties and the content of the body.
MediaSessionEstablished event
When a live pipeline is activated, the RTSP source node attempts to connect to the RTSP server that runs on the rtspsim-live555 container. If the connection succeeds, then the following event is printed.
[IoTHubMonitor] [10:51:34 AM] Message received from [avasample-iot-edge-device/avaedge]:
{
  "body": {
  {
    "sdp": "SDP:\nv=0\r\no=- 1620204694595500 1 IN IP4 xxx.xxx.xxx.xxx\r\ns=Matroska video+audio+(optional)subtitles, streamed by the LIVE555 Media Server\r\ni=media/camera-300s.mkv\r\nt=0 0\r\na=tool:LIVE555 Streaming Media v2020.08.19\r\na=type:broadcast\r\na=control:*\r\na=range:npt=0-300.000\r\na=x-qt-text-nam:Matroska video+audio+(optional)subtitles, streamed by the LIVE555 Media Server\r\na=x-qt-text-inf:media/camera-300s.mkv\r\nm=video 0 RTP/AVP 96\r\nc=IN IP4 0.0.0.0\r\nb=AS:500\r\na=rtpmap:96 H264/90000\r\na=fmtp:96 packetization-mode=1;profile-level-id=4D0029;sprop-parameter-sets=Z00AKeKQCgC3YC3AQEBpB4kRUA==,aO48gA==\r\na=control:track1\r\n"
  },
  "properties": {
    "topic": "/subscriptions/00000000-0000-0000-0000-000000000000/resourceGroups/ava-sample-deployment/providers/Microsoft.Media/videoAnalyzers/avasample",
    "subject": "/edgeModules/avaedge/livePipelines/Sample-Pipeline-1/sources/rtspSource",
    "eventType": "Microsoft.VideoAnalyzer.Diagnostics.MediaSessionEstablished",
    "eventTime": "2021-05-06T00:58:58.602Z",
    "dataVersion": "1.0"
  },
  "systemProperties": {
    "iothub-connection-device-id": "avasample-iot-edge-device",
    "iothub-connection-module-id": "avaedge",
    "iothub-message-source": "Telemetry",
    "messageId": "459c3255-7c86-4ff5-a1e5-7ce3fcb07627",
    "contentType": "application/json",
    "contentEncoding": "utf-8"
  }
}
In the preceding output:
- The message is a diagnostics event, MediaSessionEstablished. It indicates that the RTSP source node (the subject) connected with the RTSP simulator and has begun to receive a (simulated) live feed.
- The sdp section contains data about the diagnostics event. In this case, the data comprises the Session Description Protocol (SDP) details.
MotionDetection event
When motion is detected, the Video Analyzer module sends an inference event. The type is set to motion to indicate that it's a result from the motion detection processor.
Here's an example of this message:
{
  "body": {
    "timestamp": 145818422564951,
    "inferences": [
      {
        "type": "motion",
        "motion": {
          "box": {
            "l": 0.322176,
            "t": 0.574627,
            "w": 0.525,
            "h": 0.088889
          }
        }
      }
    ]
  },
  "properties": { … },
  "systemProperties": { … }
}
In this example:
The body value is data about the analytics event. In this case, the event is an inference event, so the body contains timestamp and inferences data.
The inferences data indicates that the type is motion. It has additional data about that motion event.
The box section contains the coordinates for a bounding box around the moving object. The values are normalized by the width and height of the video, in pixels. For example, to get the original pixel coordinates you would multiply the horizontal dimensions by 1920 and the vertical dimensions by 1080.
l - distance from left of image
t - distance from top of image
w - width of bounding box
h - height of bounding box
Clean up resources
If you intend to try the other quickstarts, then you should keep the resources you created. Otherwise, in the Azure portal, go to your resource groups, select the resource group where you ran this quickstart, and then delete all of the resources.
Next steps
Follow Quickstart: Analyze a live video feed from a (simulated) IP camera using your own HTTP model to apply AI to live video feeds.
Review additional challenges for advanced users:
- Use an IP camera that supports RTSP instead of using the RTSP simulator. You can find IP cameras that support RTSP on the ONVIF conformant products page. Look for devices that conform with profiles G, S, or T.
- Use an AMD64 or x64 Linux device rather than using a Linux VM in Azure. This device must be in the same network as the IP camera. Follow the instructions in Install Azure IoT Edge runtime on Linux. Then follow the instructions in Deploy your first IoT Edge module to a virtual Linux device register the device with Azure IoT Hub.