Tutorial: Record and stream inference metadata with video
![]()
Alternatively, check out topics under Create video applications in the service.
Note
Azure Video Analyzer has been retired and is no longer available.
Azure Video Analyzer for Media is not affected by this retirement. It is now rebranded to Azure Video Indexer. Click here to read more.
In this tutorial, you will learn how to use Azure Video Analyzer to record live video and inference metadata to the cloud and play back that recording with visual inference metadata. In this use case, you will be continuously recording video, while using a custom model to detect objects (yoloV3) and a Video Analyzer processor (object tracker) to track objects. As video is being continuously recorded, so will the inference metadata from the objects being detected and tracked.
If you don't have an Azure subscription, create an Azure free account before you begin.
Suggested pre-reading
Read these articles before you begin:
- Azure Video Analyzer on IoT Edge overview
- Azure Video Analyzer on IoT Edge terminology
- Video Analyzer Pipeline concepts
- Continuous video recording
- Quickstart: Analyze a live video feed from a (simulated) IP camera using your own HTTP model
- Quickstart: Track objects in a live video
Prerequisites
Prerequisites for this tutorial are:
An Azure account that includes an active subscription. Create an account for free if you don't already have one.
Note
You will need an Azure subscription where you have access to both Contributor role, and User Access Administrator role. If you do not have the right permissions, please reach out to your account administrator to grant you those permissions.
Visual Studio Code, with the following extensions:
Tip
When you're installing the Azure IoT Tools extension, you might be prompted to install Docker. Feel free to ignore the prompt.
Set up Azure resources
The deployment process will take about 20 minutes. Upon completion, you will have certain Azure resources deployed in the Azure subscription, including:
- Video Analyzer account - This cloud service is used to register the Video Analyzer edge module, and for playing back recorded video and video analytics.
- Storage account - For storing recorded video and video analytics.
- Managed Identity - This is the user assigned managed identity used to manage access to the above storage account.
- Virtual machine - This is a virtual machine that will serve as your simulated edge device.
- IoT Hub - This acts as a central message hub for bi-directional communication between your IoT application, IoT Edge modules and the devices it manages.
In addition to the resources mentioned above, following items are also created in the 'deployment-output' file share in your storage account, for use in quickstarts and tutorials:
- appsettings.json - This file contains the device connection string and other properties needed to run the sample application in Visual Studio Code.
- env.txt - This file contains the environment variables that you will need to generate deployment manifests using Visual Studio Code.
- deployment.json - This is the deployment manifest used by the template to deploy edge modules to the simulated edge device.
Tip
If you run into issues creating all of the required Azure resources, please use the manual steps in this quickstart.
Overview

The diagram is a pictorial representation of a pipeline and additional modules that accomplish the desired scenario. Three IoT Edge modules are involved:
- Video Analyzer module.
- An edge module running an AI model behind an HTTP endpoint. This AI module uses the YOLOv3 model, which can detect many types of objects.
- An RTSP simulator module to simulate an RTSP camera.
As the diagram shows, you'll use an RTSP source node in the pipeline to capture the simulated live video of traffic on a highway and send that video to two paths:
The first path is to an HTTP extension node. The HTTP extension node plays the role of a proxy. It converts every 10th video frame to the specified image type. Then it relays the image over HTTP to another edge module that runs an AI model behind an HTTP endpoint. In this example, that edge module is built by using the YOLOv3 model, which can detect many types of objects. The HTTP extension processor node gathers the detection results and sends these results and all the video frames (not just the 10th frame) to the object tracker node. The object tracker node uses optical flow techniques to track the object in the 9 frames that did not have the AI model applied to them. The tracker node publishes its results to the video sink node and the IoT Hub sink node. The video sink node will use the inference metadata from the object tracker node to be played back with the recorded video. The IoT Hub message sink node then sends those events to IoT Edge Hub.
The second path is directly from the RTSP source to the video sink node to accomplish continuous video recording. The video that will be used in this tutorial is a highway intersection sample video.
In this tutorial, you will:
- Setup your development environment.
- Deploy the required edge modules.
- Create and deploy the live pipeline.
- Interpret the results.
- Clean up resources.
Set up your development environment
Get the sample code
Clone the AVA C# samples repository.
Start Visual Studio Code, and open the folder where the repo has been downloaded.
In Visual Studio Code, browse to the src/cloud-to-device-console-app folder and create a file named appsettings.json. This file contains the settings needed to run the program.
Browse to the file share in the storage account created in the setup step above, and locate the appsettings.json file under the "deployment-output" file share. Click on the file, and then hit the "Download" button. The contents should open in a new browser tab, which should look like:
{
    "IoThubConnectionString" : "HostName=xxx.azure-devices.net;SharedAccessKeyName=iothubowner;SharedAccessKey=XXX",
    "deviceId" : "avasample-iot-edge-device",
    "moduleId" : "avaedge"
}
The IoT Hub connection string lets you use Visual Studio Code to send commands to the edge modules via Azure IoT Hub. Copy the above JSON into the src/cloud-to-device-console-app/appsettings.json file.
Next, browse to the src/edge folder and create a file named .env. This file contains properties that Visual Studio Code uses to deploy modules to an edge device.
Browse to the file share in the storage account created in the setup step above, and locate the env.txt file under the "deployment-output" file share. Click on the file, and then hit the "Download" button. The contents should open in a new browser tab, which should look like:
     SUBSCRIPTION_ID="<Subscription ID>"
     RESOURCE_GROUP="<Resource Group>"
     AVA_PROVISIONING_TOKEN="<Provisioning token>"
     VIDEO_INPUT_FOLDER_ON_DEVICE="/home/localedgeuser/samples/input"
     VIDEO_OUTPUT_FOLDER_ON_DEVICE="/var/media"
     APPDATA_FOLDER_ON_DEVICE="/var/lib/videoanalyzer"
     CONTAINER_REGISTRY_USERNAME_myacr="<your container registry username>"
     CONTAINER_REGISTRY_PASSWORD_myacr="<your container registry password>"
Copy the JSON from your env.txt into the src/edge/.env file.
Connect to the IoT Hub
In Visual Studio Code, set the IoT Hub connection string by selecting the More actions icon next to the AZURE IOT HUB pane in the lower-left corner. Copy the string from the src/cloud-to-device-console-app/appsettings.json file.
Note
You might be asked to provide Built-in endpoint information for the IoT Hub. To get that information, in Azure portal, navigate to your IoT Hub and look for Built-in endpoints option in the left navigation pane. Click there and look for the Event Hub-compatible endpoint under Event Hub compatible endpoint section. Copy and use the text in the box. The endpoint will look something like this:
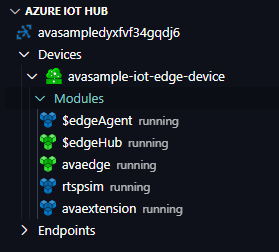
Endpoint=sb://iothub-ns-xxx.servicebus.windows.net/;SharedAccessKeyName=iothubowner;SharedAccessKey=XXX;EntityPath=<IoT Hub name>In about 30 seconds, refresh Azure IoT Hub in the lower-left section. You should see the edge device
avasample-iot-edge-device, which should have the following modules deployed:- Edge Hub (module name edgeHub)
- Edge Agent (module name edgeAgent)
- Video Analyzer (module name avaedge)
- RTSP simulator (module name rtspsim)
Prepare to monitor the modules
When you use run this quickstart or tutorial, events will be sent to the IoT Hub. To see these events, follow these steps:
Open the Explorer pane in Visual Studio Code, and look for Azure IoT Hub in the lower-left corner.
Expand the Devices node.
Right-click on
avasample-iot-edge-device, and select Start Monitoring Built-in Event Endpoint.Note
You might be asked to provide Built-in endpoint information for the IoT Hub. To get that information, in Azure portal, navigate to your IoT Hub and look for Built-in endpoints option in the left navigation pane. Click there and look for the Event Hub-compatible endpoint under Event Hub compatible endpoint section. Copy and use the text in the box. The endpoint will look something like this:
Endpoint=sb://iothub-ns-xxx.servicebus.windows.net/;SharedAccessKeyName=iothubowner;SharedAccessKey=XXX;EntityPath=<IoT Hub name>
Examine the sample files
In Visual Studio Code, browse to src/edge. You'll see the .env file that you created and a few deployment template files. This template defines which edge modules you'll deploy to the edge device (the Azure Linux VM). The .env file contains values for the variables used in these templates, such as Video Analyzer credentials.
Open src/edge/deployment.yolov3.template.json. There are three entries under the modules section that correspond to the items listed in the previous "Overview" section
- avaedge: This is the Video Analyzer on IoT Edge module.
- yolov3: This is the AI module built by using the YOLO v3 model.
- rtspsim: This is the RTSP simulator.
Next, browse to the src/cloud-to-device-console-app folder. Here you'll see the appsettings.json file that you created along with a few other files:
- c2d-console-app.csproj: The project file for Visual Studio Code.
- operations.json: This file lists the different operations that you would run.
- Program.cs: The sample program code, which:
Loads the app settings.
Invokes direct methods exposed by the Video Analyzer on IoT Edge module. You can use the module to analyze live video streams by invoking its direct methods.
Pauses for you to examine the output from the program in the TERMINAL window and the events generated by the module in the OUTPUT window.
Invokes direct methods to clean up resources.
Generate and deploy the IoT Edge deployment manifest
Right-click the src/edge/deployment.yolov3.template.json file and then select Generate IoT Edge Deployment Manifest.
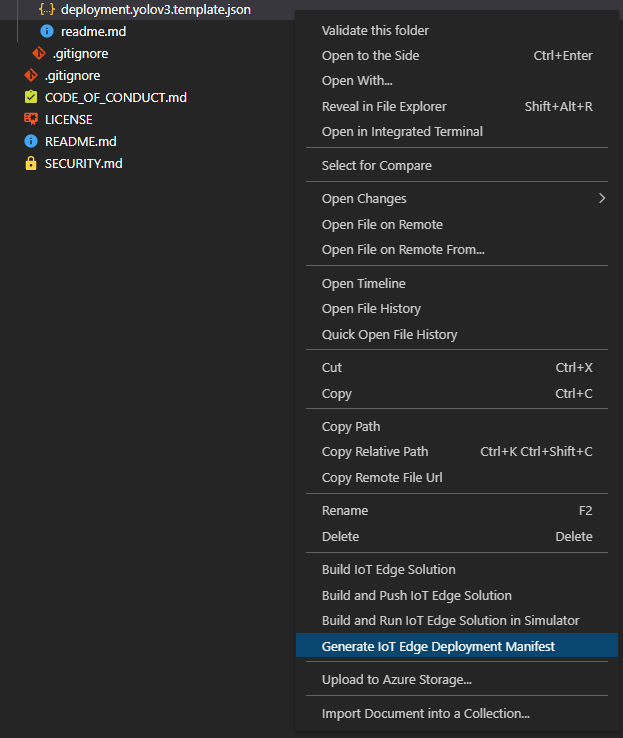
- The deployment.yolov3.amd64.json manifest file is created in the src/edge/config folder.
Right-click src/edge/config/deployment.yolov3.amd64.json and select Create Deployment for Single Device.
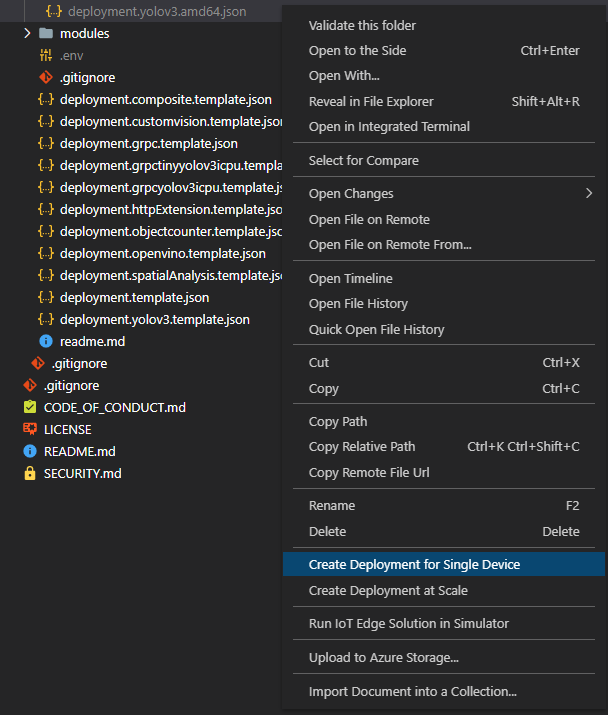
When you're prompted to select an IoT Hub device, select avasample-iot-edge-device.
After about 30 seconds, in the lower-left corner of the window, refresh Azure IoT Hub. The edge device now shows the following deployed modules:
The avaedge module, which is the Video Analyzer module.
The rtspsim module, which simulates an RTSP server and acts as the source of a live video feed.
The yolov3 module, which is the YoloV3 object detection model that applies computer vision to the images and returns multiple classes of object types
Create and deploy the live pipeline
Edit the sample files
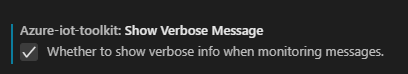
In Visual Studio Code, open the Extensions tab (or press Ctrl+Shift+X) and search for Azure IoT Hub.
Right click and select Extension Settings.
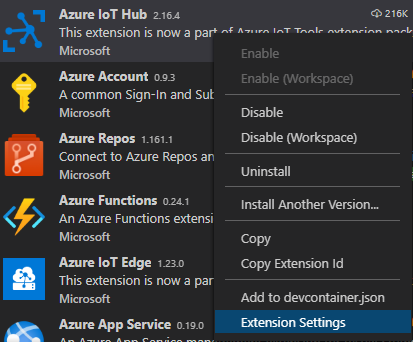
Search and enable “Show Verbose Message”.
Go to src/cloud-to-device-console-app/operations.json.
Under the pipelineTopologySet node, edit the following
"pipelineTopologyUrl" : "https://raw.githubusercontent.com/Azure/video-analyzer/main/pipelines/live/topologies/cvr-with-httpExtension-and-objectTracking/topology.json"Next, under the livePipelineSet and pipelineTopologyDelete nodes, ensure that the value of topologyName matches the value of the name property in the above pipeline topology:
"pipelineTopologyName" : "CVRHttpExtensionObjectTracking"Open the pipeline topology in a browser, and look at videoName - it is hard-coded to
sample-cvr-with-inference-metadata. This is acceptable for a tutorial. In production, you would take care to ensure that each unique RTSP camera is recorded to a video resource with a unique name.Examine the settings for the HTTP extension node.
   "samplingOptions":{
       "skipSamplesWithoutAnnotation":"false",
       "maximumSamplesPerSecond":"2"
  }
Here, skipSamplesWithoutAnnotation is set to false because the extension node needs to pass through all frames, whether or not they have inference results, to the downstream object tracker node. The object tracker is capable of tracking objects over 15 frames, approximately. Your AI model has a maximum FPS for processing, which is the highest value that maximumSamplesPerSecond should be set to.
Run the sample program
Start a debugging session by selecting F5. You'll see some messages printed in the TERMINAL window.
The operations.json file starts off with calls to pipelineTopologyList and livePipelineList. If you've cleaned up resources after previous quickstarts or tutorials, this action returns empty lists and then pauses for you to select Enter, as shown:
--------------------------------------------------------------------------
Executing operation pipelineTopologyList
-----------------------  Request: pipelineTopologyList  --------------------------------------------------
{
  "@apiVersion": "1.1"
}
---------------  Response: pipelineTopologyList - Status: 200  ---------------
{
  "value": []
}
--------------------------------------------------------------------------
Executing operation WaitForInput

Press Enter to continue
After you select Enter in the TERMINAL window, the next set of direct method calls is made:
A call to pipelineTopologySet by using the previous pipelinetopologyUrl
A call to livePipelineSet by using the following body
{
  "@apiVersion": "1.1",
  "name": "Sample-Pipeline-1",
  "properties": {
    "topologyName": "CVRHttpExtensionObjectTracking",
    "description": "Sample pipeline description",
    "parameters": [
      {
        "name": "rtspUrl",
        "value": "rtsp://rtspsim:554/media/camera-300s.mkv"
      },
      {
        "name": "rtspUserName",
        "value": "testuser"
      },
      {
        "name": "rtspPassword",
        "value": "testpassword"
      }
    ]
  }
}
A call to livePipelineActivate that starts the live pipeline and the flow of video.
A second call to livePipelineList that shows that the live pipeline is in the running state.
The output in the TERMINAL window pauses at a Press Enter to continue prompt. Don't select Enter yet. Scroll up to see the JSON response payloads for the direct methods you invoked.
Switch to the OUTPUT window in Visual Studio Code. You see messages that the Video Analyzer on IoT Edge module is sending to the IoT hub.
The pipeline continues to run and print results. The RTSP simulator keeps looping the source video. To stop the live pipeline, return to the TERMINAL window and select Enter.
The next series of calls cleans up resources:
- A call to livePipelineDeactivate deactivates the live pipeline.
- A call to livePipelineDelete deletes the live pipeline.
- A call to pipelineTopologyDelete deletes the pipeline topology.
- A final call to pipelineTopologyList shows that the list is empty.
Interpret results
When you run the live pipeline, the results from the HTTP extension processor node pass through the object tracker node to the IoT Hub sink node to the IoT hub. The messages you see in the OUTPUT window contain a body section and an applicationProperties section. For more information, see Create and read IoT Hub messages.
In the following messages, the Video Analyzer module defines the application properties and the content of the body.
Diagnostics events
MediaSessionEstablished event
When a live pipeline is activated, the RTSP source node attempts to connect to the RTSP server that runs on the rtspsim-live555 container. If the connection succeeds, then the following event is printed. The event type is Microsoft.VideoAnalyzer.Diagnostics.MediaSessionEstablished.
[IoTHubMonitor] [9:42:18 AM] Message received from [avasample-iot-edge-device/avaedge]:
{  "body": {
    "sdp": "SDP:\nv=0\r\no=- 1586450538111534 1 IN IP4 nnn.nn.0.6\r\ns=Matroska video+audio+(optional)subtitles, streamed by the LIVE555 Media Server\r\ni=media/camera-300s.mkv\r\nt=0 0\r\na=tool:LIVE555 Streaming Media v2020.03.06\r\na=type:broadcast\r\na=control:*\r\na=range:npt=0-300.000\r\na=x-qt-text-nam:Matroska video+audio+(optional)subtitles, streamed by the LIVE555 Media Server\r\na=x-qt-text-inf:media/camera-300s.mkv\r\nm=video 0 RTP/AVP 96\r\nc=IN IP4 0.0.0.0\r\nb=AS:500\r\na=rtpmap:96 H264/90000\r\na=fmtp:96 packetization-mode=1;profile-level-id=4D0029;sprop-parameter-sets=Z00AKeKQCgC3YC3AQEBpB4kRUA==,aO48gA==\r\na=control:track1\r\n"
  },
  "applicationProperties": {
    "dataVersion": "1.0",
    "topic": "/subscriptions/{subscriptionID}/resourceGroups/{name}/providers/microsoft.media/videoAnalyzers/{ava-account-name}",
    "subject": "/edgeModules/avaedge/livePipelines/Sample-Pipeline-1/sources/rtspSource",
    "eventType": "Microsoft.VideoAnalyzer.Diagnostics.MediaSessionEstablished",
    "eventTime": "2020-04-09T16:42:18.1280000Z"
  }
}
In this message, notice these details:
- The message is a diagnostics event. MediaSessionEstablished indicates that the RTSP source node (the subject) connected with the RTSP simulator and has begun to receive a (simulated) live feed.
- In applicationProperties, subject indicates that the message was generated from the RTSP source node in the live pipeline.
- In applicationProperties, eventType indicates that this event is a diagnostics event.
- The eventTime indicates the time when the event occurred.
- The body contains data about the diagnostics event. In this case, the data comprises the Session Description Protocol (SDP) details.
Operational events
Object tracking events
The HTTP extension processor node sends the 0th, 15th, 30th, … etc. frames to the yolov3 module, and receives the inference results. It then sends these results and all video frames to the object tracker node. Suppose an object was detected on frame 0 – then the object tracker will assign a unique sequenceId to that object. Then, in frames 1, 2,…,14, if it can track that object, it will output a result with the same sequenceId. In the following snippets from the results, note how the sequenceId is repeated, but the location of the bounding box has changed, as the object is moving.
From frame M:
  {
    "type": "entity",
    "subtype": "objectDetection",
    "inferenceId": "4d325fc4dc7a43b2a781bf7d6bdb3ff0",
    "sequenceId": "0999a1dde5b241c3a0b2db025f87ab32",
    "entity": {
      "tag": {
        "value": "car",
        "confidence": 0.95237225
      },
      "box": {
        "l": 0.0025893003,
        "t": 0.550063,
        "w": 0.1086607,
        "h": 0.12116724
      }
    }
  },
From frame N:
{
  "type": "entity",
  "subtype": "objectDetection",
  "inferenceId": "317aafdab7e940388be1e4c4cc58c366",
  "sequenceId": "0999a1dde5b241c3a0b2db025f87ab32",
  "entity": {
    "tag": {
      "value": "car",
      "confidence": 0.95237225
    },
    "box": {
      "l": 0.0027777778,
      "t": 0.54901963,
      "w": 0.108333334,
      "h": 0.12009804
    }
  }
},
RecordingStarted event
When the video sink node starts to record media, it emits this event of type Microsoft.VideoAnalyzers.Pipeline.Operational.RecordingStarted:
[IoTHubMonitor] [9:42:38 AM] Message received from [avasample-iot-edge-device/avaedge]:
{
  "body": {
    "outputType": "videoName",
    "outputLocation": "sample-cvr-with-inference-metadata"
  },
  "applicationProperties": {
    "topic": "/subscriptions/{subscriptionID}/resourceGroups/{resource-group-name}/providers/microsoft.media/videoAnalyzers/{ava-account-name}",
    "subject": "/edgeModules/avaedge/livePipelines/Sample-Pipeline-1/sinks/videoSink",
    "eventType": "Microsoft.VideoAnalyzers.Pipeline.Operational.RecordingStarted",
    "eventTime": "2021-04-09T09:42:38.1280000Z",
    "dataVersion": "1.0"
  }
}
The subject section in applicationProperties references the video sink node in the live pipeline, which generated this message.
The body section contains information about the output location. In this case, it's the name of the Video Analyzer resource into which video is recorded.
RecordingAvailable event
As the name suggests, the RecordingStarted event is sent when recording has started, but media data might not have been uploaded to the video resource yet. When the video sink node has uploaded media, it emits an event of type Microsoft.VideoAnalyzers.Pipeline.Operational.RecordingAvailable:
[IoTHubMonitor] [[9:43:38 AM] Message received from [ava-sample-device/avaedge]:
{
  "body": {
    "outputType": "videoName",
    "outputLocation": "sample-cvr-with-inference-metadata"
  },
  "applicationProperties": {
    "topic": "/subscriptions/{subscriptionID}/resourceGroups/{resource-group-name}/providers/microsoft.media/videoAnalyzers/{ava-account-name}",
    "subject": "/edgeModules/avaedge/livePipelines/Sample-Pipeline-1/sinks/videoSink",
    "eventType": "Microsoft.VideoAnalyzers.Pipeline.Operational.RecordingAvailable",
    "eventTime": "2021-04-09T09:43:38.1280000Z",
    "dataVersion": "1.0"
  }
}
This event indicates that enough data was written to the video resource for players or clients to start playback of the video.
The subject section in applicationProperties references the video sink node in the live pipeline, which generated this message.
The body section contains information about the output location. In this case, it's the name of the Video Analyzer resource into which video is recorded.
RecordingStopped event
When you deactivate the live pipeline, the video sink node stops recording media. It emits this event of type Microsoft.VideoAnalyzers.Pipeline.Operational.RecordingStopped:
[IoTHubMonitor] [11:33:31 PM] Message received from [ava-sample-device/avaedge]:
{
  "body": {
    "outputType": "videoName",
    "outputLocation": "sample-cvr-with-inference-metadata"
  },
  "applicationProperties": {
    "topic": "/subscriptions/{subscriptionID}/resourceGroups/{resource-group-name}/providers/microsoft.media/videoAnalyzers/{ava-account-name}",
    "subject": "/edgeModules/avaedge/livePipelines/Sample-Pipeline-1/sinks/videoSink",
    "eventType": "Microsoft.VideoAnalyzers.Pipeline.Operational.RecordingStopped",
    "eventTime": "2021-04-10T11:33:31.051Z",
    "dataVersion": "1.0"
  }
}
This event indicates that recording has stopped.
The subject section in applicationProperties references the video sink node in the live pipeline, which generated this message.
The body section contains information about the output location, which in this case is the name of the Video Analyzer resource into which video is recorded.
Streaming the recording with visual inference metadata
You can examine the Video Analyzer video resource that was created by the live pipeline by logging in to the Azure portal and viewing the video.
- Open your web browser, and go to the Azure portal. Enter your credentials to sign in to the portal. The default view is your service dashboard.
- Locate your Video Analyzers account among the resources you have in your subscription, and open the account pane.
- Select Videos in the Video Analyzers list.
- You'll find a video listed with the name
sample-cvr-with-inference-metadata. This is the name chosen in your pipeline topology file. - Select the video.
- On the video details page, click the Play icon
- To view the inference metadata as bounding boxes on the video, click the bounding box icon (circled in red)
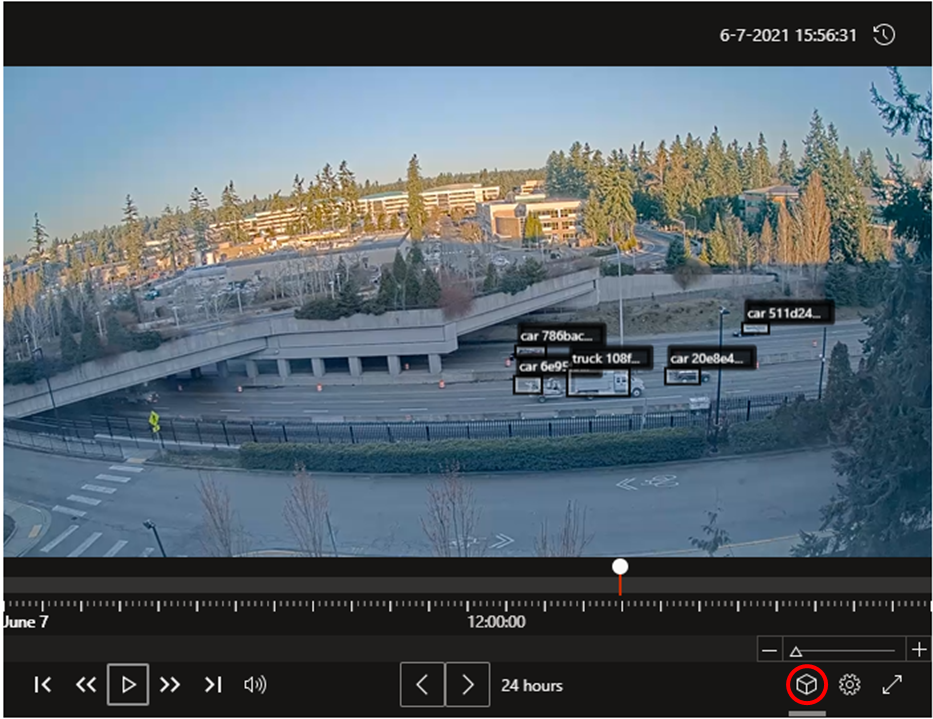
Note
Because the source of the video was a container simulating a camera feed, the time stamps in the video are related to when you activated the live pipeline and when you deactivated it.
Clean up resources
If you want to try other quickstarts or tutorials, keep the resources that you created. Otherwise, go to the Azure portal, go to your resource groups, select the resource group where you ran this quickstart, and delete all the resources.
Next steps
- Use an IP camera with support for RTSP instead of using the RTSP simulator. You can search for IP cameras with RTSP support on the ONVIF conformant products page by looking for devices that conform with profiles G, S, or T.
- Use an AMD64 or X64 Linux device (vs. using an Azure Linux VM). This device must be in the same network as the IP camera. Follow the instructions in Install Azure IoT Edge runtime on Linux. Then follow the instructions in the Deploy your first IoT Edge module to a virtual Linux device quickstart to register the device with Azure IoT Hub.