Note
Access to this page requires authorization. You can try signing in or changing directories.
Access to this page requires authorization. You can try changing directories.
Introduction
In the preconfigured solutions, you can configure rules that trigger when a telemetry value for a device reaches a specific threshold. Use dynamic telemetry with the remote monitoring preconfigured solution describes how you can add custom telemetry values, such as ExternalTemperature to your solution. This article shows you how to create custom rule for dynamic telemetry types in your solution.
This tutorial uses a simple Node.js simulated device to generate dynamic telemetry to send to the preconfigured solution back end. You then add custom rules in the RemoteMonitoring Visual Studio solution and deploy this customized back end to your Azure subscription.
To complete this tutorial, you need:
- An active Azure subscription. If you don’t have an account, you can create a free trial account in just a couple of minutes. For details, see Azure Free Trial.
- Node.js version 0.12.x or later to create a simulated device.
- Visual Studio 2015 or Visual Studio 2017 to modify the preconfigured solution back end with your new rules.
Provision the solution
If you haven't already provisioned the remote monitoring preconfigured solution in your account:
- Sign in to azureiotsuite.com using your Azure account credentials, and click + to create a solution.
- Click Select on the Remote monitoring tile.
- Enter a Solution name for your remote monitoring preconfigured solution.
- Select the Region and Subscription you want to use to provision the solution.
- Click Create Solution to begin the provisioning process. This process typically takes several minutes to run.
Wait for the provisioning process to complete
- Click the tile for your solution with Provisioning status.
- Notice the Provisioning states as Azure services are deployed in your Azure subscription.
- Once provisioning completes, the status changes to Ready.
- Click the tile to see the details of your solution in the right-hand pane.
Note
If you are encountering issues deploying the pre-configured solution, review Permissions on the azureiotsuite.com site and the FAQ. If the issues persist, create a service ticket on the portal.
Are there details you'd expect to see that aren't listed for your solution? Give us feature suggestions on User Voice.
Make a note of the solution name you chose for your deployment. You need this solution name later in this tutorial.
Configure the Node.js simulated device
On the remote monitoring dashboard, click + Add a device and then add a custom device. Make a note of the IoT Hub hostname, device id, and device key. You need them later in this tutorial when you prepare the remote_monitoring.js device client application.
Ensure that Node.js version 0.12.x or later is installed on your development machine. Run
node --versionat a command prompt or in a shell to check the version. For information about using a package manager to install Node.js on Linux, see Installing Node.js via package manager.When you have installed Node.js, clone the latest version of the azure-iot-sdk-node repository to your development machine. Always use the master branch for the latest version of the libraries and samples.
From your local copy of the azure-iot-sdk-node repository, copy the following two files from the node/device/samples folder to an empty folder on your development machine:
- packages.json
- remote_monitoring.js
Open the remote_monitoring.js file and look for the following variable definition:
var connectionString = "[IoT Hub device connection string]";Replace [IoT Hub device connection string] with your device connection string. Use the values for your IoT Hub hostname, device id, and device key that you made a note of in step 1. A device connection string has the following format:
HostName={your IoT Hub hostname};DeviceId={your device id};SharedAccessKey={your device key}If your IoT Hub hostname is contoso and your device id is mydevice, your connection string looks like the following snippet:
var connectionString = "HostName=contoso.azure-devices.net;DeviceId=mydevice;SharedAccessKey=2s ... =="Save the file. Run the following commands in a shell or command prompt in the folder that contains these files to install the necessary packages and then run the sample application:
npm install
node remote_monitoring.js
Observe dynamic telemetry in action
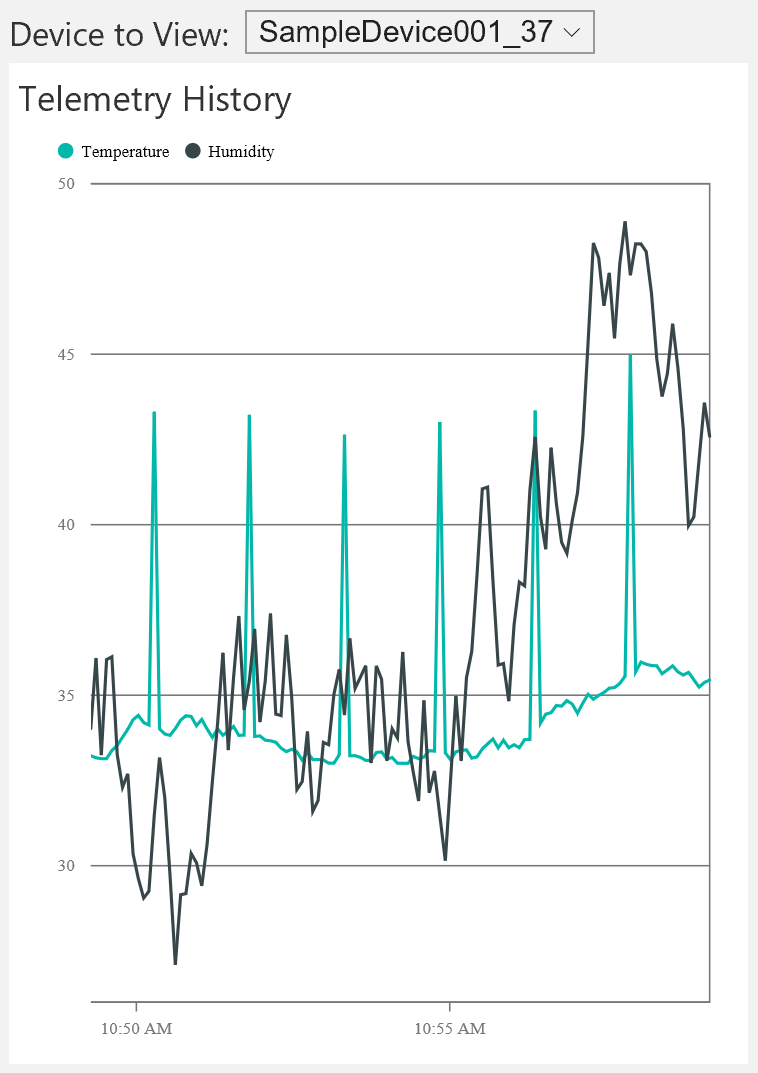
The dashboard shows the temperature and humidity telemetry from the existing simulated devices:
If you select the Node.js simulated device you ran in the previous section, you see temperature, humidity, and external temperature telemetry:
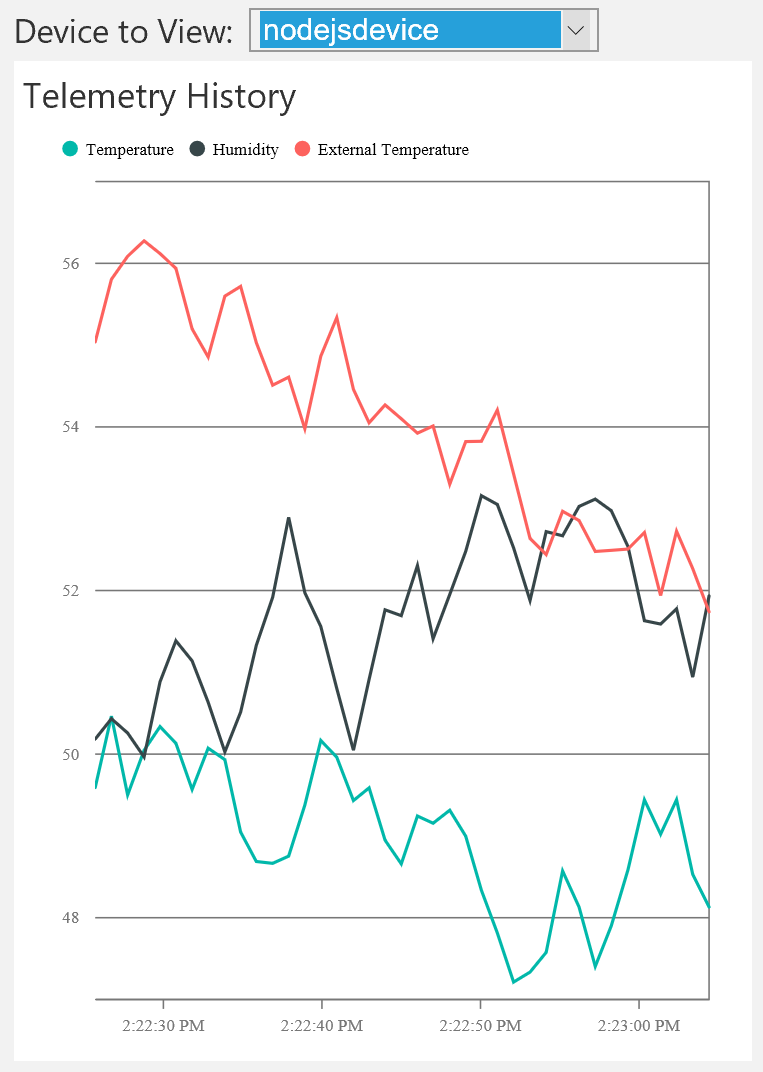
The remote monitoring solution automatically detects the additional external temperature telemetry type and adds it to the chart on the dashboard.
You can stop the Node.js console app when you have verified that it is sending ExternalTemperature telemetry to the preconfigured solution. Keep the console window open because you run this Node.js console app again after you add the custom rule to the solution.
Rule storage locations
Information about rules is persisted in two locations:
- DeviceRulesNormalizedTable table – This table stores a normalized reference to the rules defined by the solution portal. When the solution portal displays device rules, it queries this table for the rule definitions.
- DeviceRules blob – This blob stores all the rules defined for all registered devices and is defined as a reference input to the Azure Stream Analytics jobs. When you update an existing rule or define a new rule in the solution portal, both the table and blob are updated to reflect the changes. The rule definition displayed in the portal comes from the table store, and the rule definition referenced by the Stream Analytics jobs comes from the blob.
Update the RemoteMonitoring Visual Studio solution
The following steps show you how to modify the RemoteMonitoring Visual Studio solution to include a new rule that uses the ExternalTemperature telemetry sent from the simulated device:
If you have not already done so, clone the azure-iot-remote-monitoring repository to a suitable location on your local machine using the following Git command:
git clone https://github.com/Azure/azure-iot-remote-monitoring.gitIn Visual Studio, open the RemoteMonitoring.sln file from your local copy of the azure-iot-remote-monitoring repository.
Open the file Infrastructure\Models\DeviceRuleBlobEntity.cs and add an ExternalTemperature property as follows:
public double? Temperature { get; set; }
public double? Humidity { get; set; }
public double? ExternalTemperature { get; set; }
In the same file, add an ExternalTemperatureRuleOutput property as follows:
public string TemperatureRuleOutput { get; set; }
public string HumidityRuleOutput { get; set; }
public string ExternalTemperatureRuleOutput { get; set; }
Open the file Infrastructure\Models\DeviceRuleDataFields.cs and add the following ExternalTemperature property after the existing Humidity property:
public static string ExternalTemperature
{
get { return "ExternalTemperature"; } } ```
In the same file, update the _availableDataFields method to include ExternalTemperature as follows:
private static List<string> _availableDataFields = new List<string>
{
    Temperature, Humidity, ExternalTemperature
};
7. Open the file Infrastructure\Repository\DeviceRulesRepository.cs and modify the BuildBlobEntityListFromTableRows method as follows:
```csharp
else if (rule.DataField == DeviceRuleDataFields.Humidity)
{
    entity.Humidity = rule.Threshold;
    entity.HumidityRuleOutput = rule.RuleOutput;
}
else if (rule.DataField == DeviceRuleDataFields.ExternalTemperature)
{
  entity.ExternalTemperature = rule.Threshold;
  entity.ExternalTemperatureRuleOutput = rule.RuleOutput;
}
```
Rebuild and redeploy the solution.
You can now deploy the updated solution to your Azure subscription.
Open an elevated command prompt and navigate to the root of your local copy of the azure-iot-remote-monitoring repository.
To deploy your updated solution, run the following command substituting {deployment name} with the name of your preconfigured solution deployment that you noted previously:
build.cmd cloud release {deployment name}
Update the Stream Analytics job
When the deployment is complete, you can update the Stream Analytics job to use the new rule definitions.
In the Azure portal, navigate to the resource group that contains your preconfigured solution resources. This resource group has the same name you specified for the solution during the deployment.
Navigate to the {deployment name}-Rules Stream Analytics job.
3. Click Stop to stop the Stream Analytics job from running. (You must wait for the streaming job to stop before you can edit the query).
4. Click Query. Edit the query to include the SELECT statement for ExternalTemperature. The following sample shows the complete query with the new SELECT statement:
```
WITH AlarmsData AS
(
SELECT
     Stream.IoTHub.ConnectionDeviceId AS DeviceId,
     'Temperature' as ReadingType,
     Stream.Temperature as Reading,
     Ref.Temperature as Threshold,
     Ref.TemperatureRuleOutput as RuleOutput,
     Stream.EventEnqueuedUtcTime AS [Time]
FROM IoTTelemetryStream Stream
JOIN DeviceRulesBlob Ref ON Stream.IoTHub.ConnectionDeviceId = Ref.DeviceID
WHERE
     Ref.Temperature IS NOT null AND Stream.Temperature > Ref.Temperature

UNION ALL

SELECT
     Stream.IoTHub.ConnectionDeviceId AS DeviceId,
     'Humidity' as ReadingType,
     Stream.Humidity as Reading,
     Ref.Humidity as Threshold,
     Ref.HumidityRuleOutput as RuleOutput,
     Stream.EventEnqueuedUtcTime AS [Time]
FROM IoTTelemetryStream Stream
JOIN DeviceRulesBlob Ref ON Stream.IoTHub.ConnectionDeviceId = Ref.DeviceID
WHERE
     Ref.Humidity IS NOT null AND Stream.Humidity > Ref.Humidity

UNION ALL

SELECT
     Stream.IoTHub.ConnectionDeviceId AS DeviceId,
     'ExternalTemperature' as ReadingType,
     Stream.ExternalTemperature as Reading,
     Ref.ExternalTemperature as Threshold,
     Ref.ExternalTemperatureRuleOutput as RuleOutput,
     Stream.EventEnqueuedUtcTime AS [Time]
FROM IoTTelemetryStream Stream
JOIN DeviceRulesBlob Ref ON Stream.IoTHub.ConnectionDeviceId = Ref.DeviceID
WHERE
     Ref.ExternalTemperature IS NOT null AND Stream.ExternalTemperature > Ref.ExternalTemperature
)

SELECT *
INTO DeviceRulesMonitoring
FROM AlarmsData

SELECT *
INTO DeviceRulesHub
FROM AlarmsData
```
Click Save to change the updated rule query.
Click Start to start the Stream Analytics job running again.
Add your new rule in the dashboard
You can now add the ExternalTemperature rule to a device in the solution dashboard.
- Navigate to the solution portal.
2. Navigate to the Devices panel.
3. Locate the custom device you created that sends ExternalTemperature telemetry and on the Device Details panel, click Add Rule.
4. Select ExternalTemperature in Data Field.
Set Threshold to 56. Then click Save and view rules.
Return to the dashboard to view the alarm history.
In the console window you left open, start the Node.js console app to begin sending ExternalTemperature telemetry data.
8. Notice that the Alarm History table shows new alarms when the new rule is triggered.
Additional information
Changing the operator > is more complex and goes beyond the steps outlined in this tutorial. While you can change the Stream Analytics job to use whatever operator you like, reflecting that operator in the solution portal is a more complex task.
Next steps
Now that you've seen how to create custom rules, you can learn more about the preconfigured solutions: