Explore Azure Dashboards
Visualizations such as charts and graphs can help you analyze your monitoring data to drill down on issues and identify patterns.
Depending on the tool you use, you may also share visualizations with other users inside and outside of your organization.
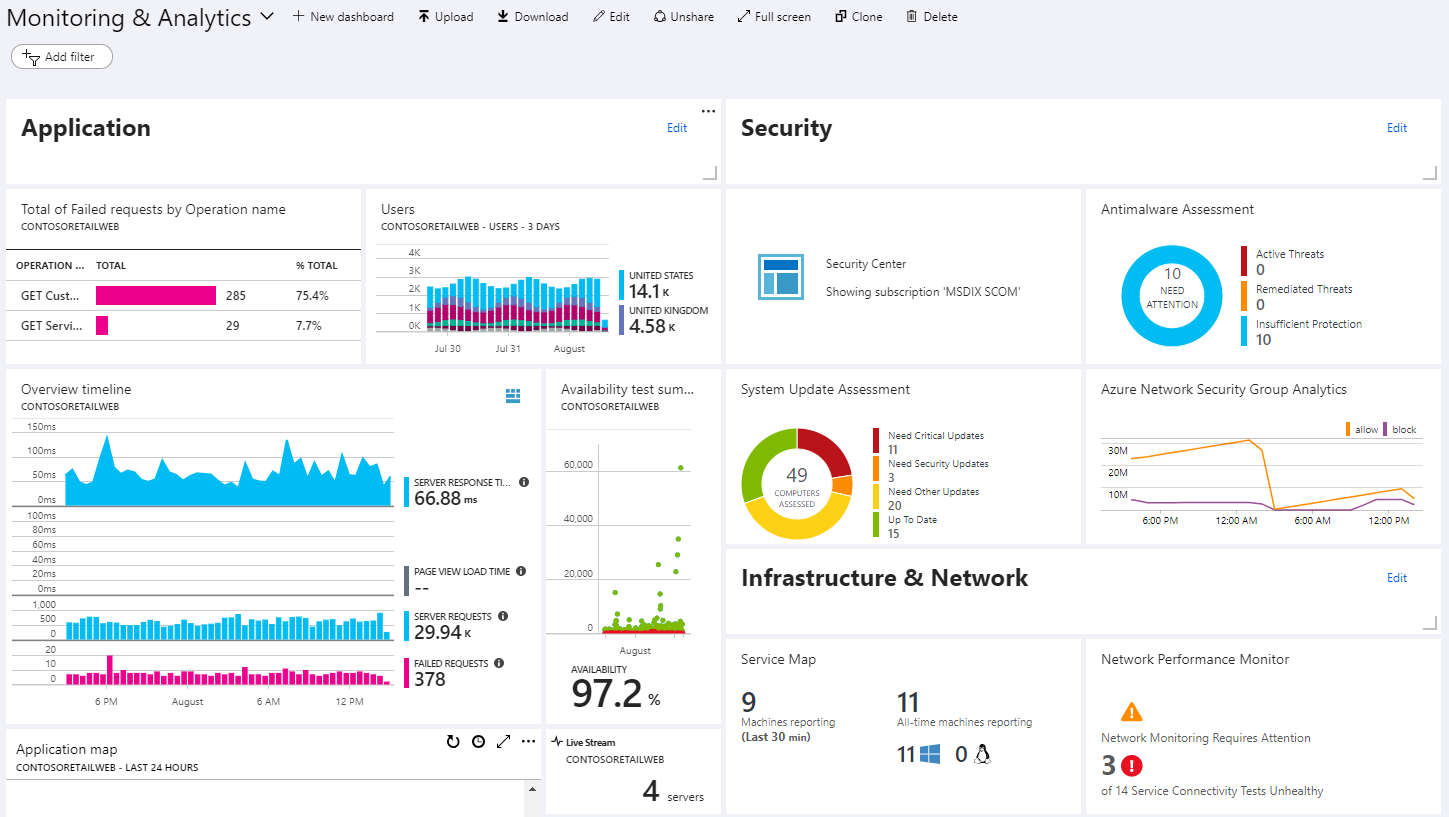
Azure dashboards are the primary dashboarding technology for Azure.
They're handy in providing a single pane of glass over your Azure infrastructure and services allowing you to identify critical issues quickly.
Advantages
- Deep integration into Azure. Visualizations can be pinned to dashboards from multiple Azure pages, including metrics analytics, log analytics, and Application Insights.
- Supports both metrics and logs.
- Combine data from multiple sources, including output from Metrics explorer, Log Analytics queries, and maps and availability in Application Insights.
- Option for personal or shared dashboards. It's integrated with Azure role-based authentication (RBAC).
- Automatic refresh. Metrics refresh depends on the time range with a minimum of five minutes. Logs refresh at one minute.
- Parametrized metrics dashboards with timestamp and custom parameters.
- Flexible layout options.
- Full-screen mode.
Limitations
- Limited control over log visualizations with no support for data tables. The total number of data series is limited to 10, with different data series grouped under another bucket.
- No custom parameters support for log charts.
- Log charts are limited to the last 30 days.
- Log charts can only be pinned to shared dashboards.
- No interactivity with dashboard data.
- Limited contextual drill-down.