Examine Azure Monitor support for Azure IoT Hub
You can configure, monitor, troubleshoot, respond to, and analyze Azure IoT Hub communications and other data using Azure Monitor. This unit provides an overview of the elements of Azure Monitor, how data flows through Azure Monitor, and a high-level overview of how Azure IoT Hub connects to Azure Monitor. Subsequent units of this module provide more detail about Azure Monitor metrics, diagnostic settings, alerts, and log analytics.
Overview
Azure Monitor is a comprehensive monitoring solution for collecting, analyzing, and responding to monitoring data from your cloud and on-premises environments. It helps you understand how your applications are performing and allows you to respond to system events manually and programmatically.
Azure Monitor collects and aggregates data from every layer and component of your system across multiple Azure and non-Azure subscriptions and tenants. It stores the data in a common data platform for consumption by a common set of tools that can correlate, analyze, visualize, and/or respond to the data. You can also use Azure Monitor to integrate other Microsoft and non-Microsoft tools.
As soon as you create an Azure resource, Azure Monitor is enabled and starts collecting metrics and activity logs. With some configuration, you can gather more monitoring data and enable other features. While resources from different Azure services have different monitoring requirements, they generate monitoring data in the same formats. You can use the same Azure Monitor tools to analyze all Azure resources.
Overview diagram
The following diagram shows a high-level view of Azure Monitor system components. In this diagram, Azure Monitor follows a data flow pattern of:
- Collect data from data sources.
- Store the collected data in the data platform.
- Authorized users consume the Azure Monitor platform data using insight, visualize, analysis, and response tools.
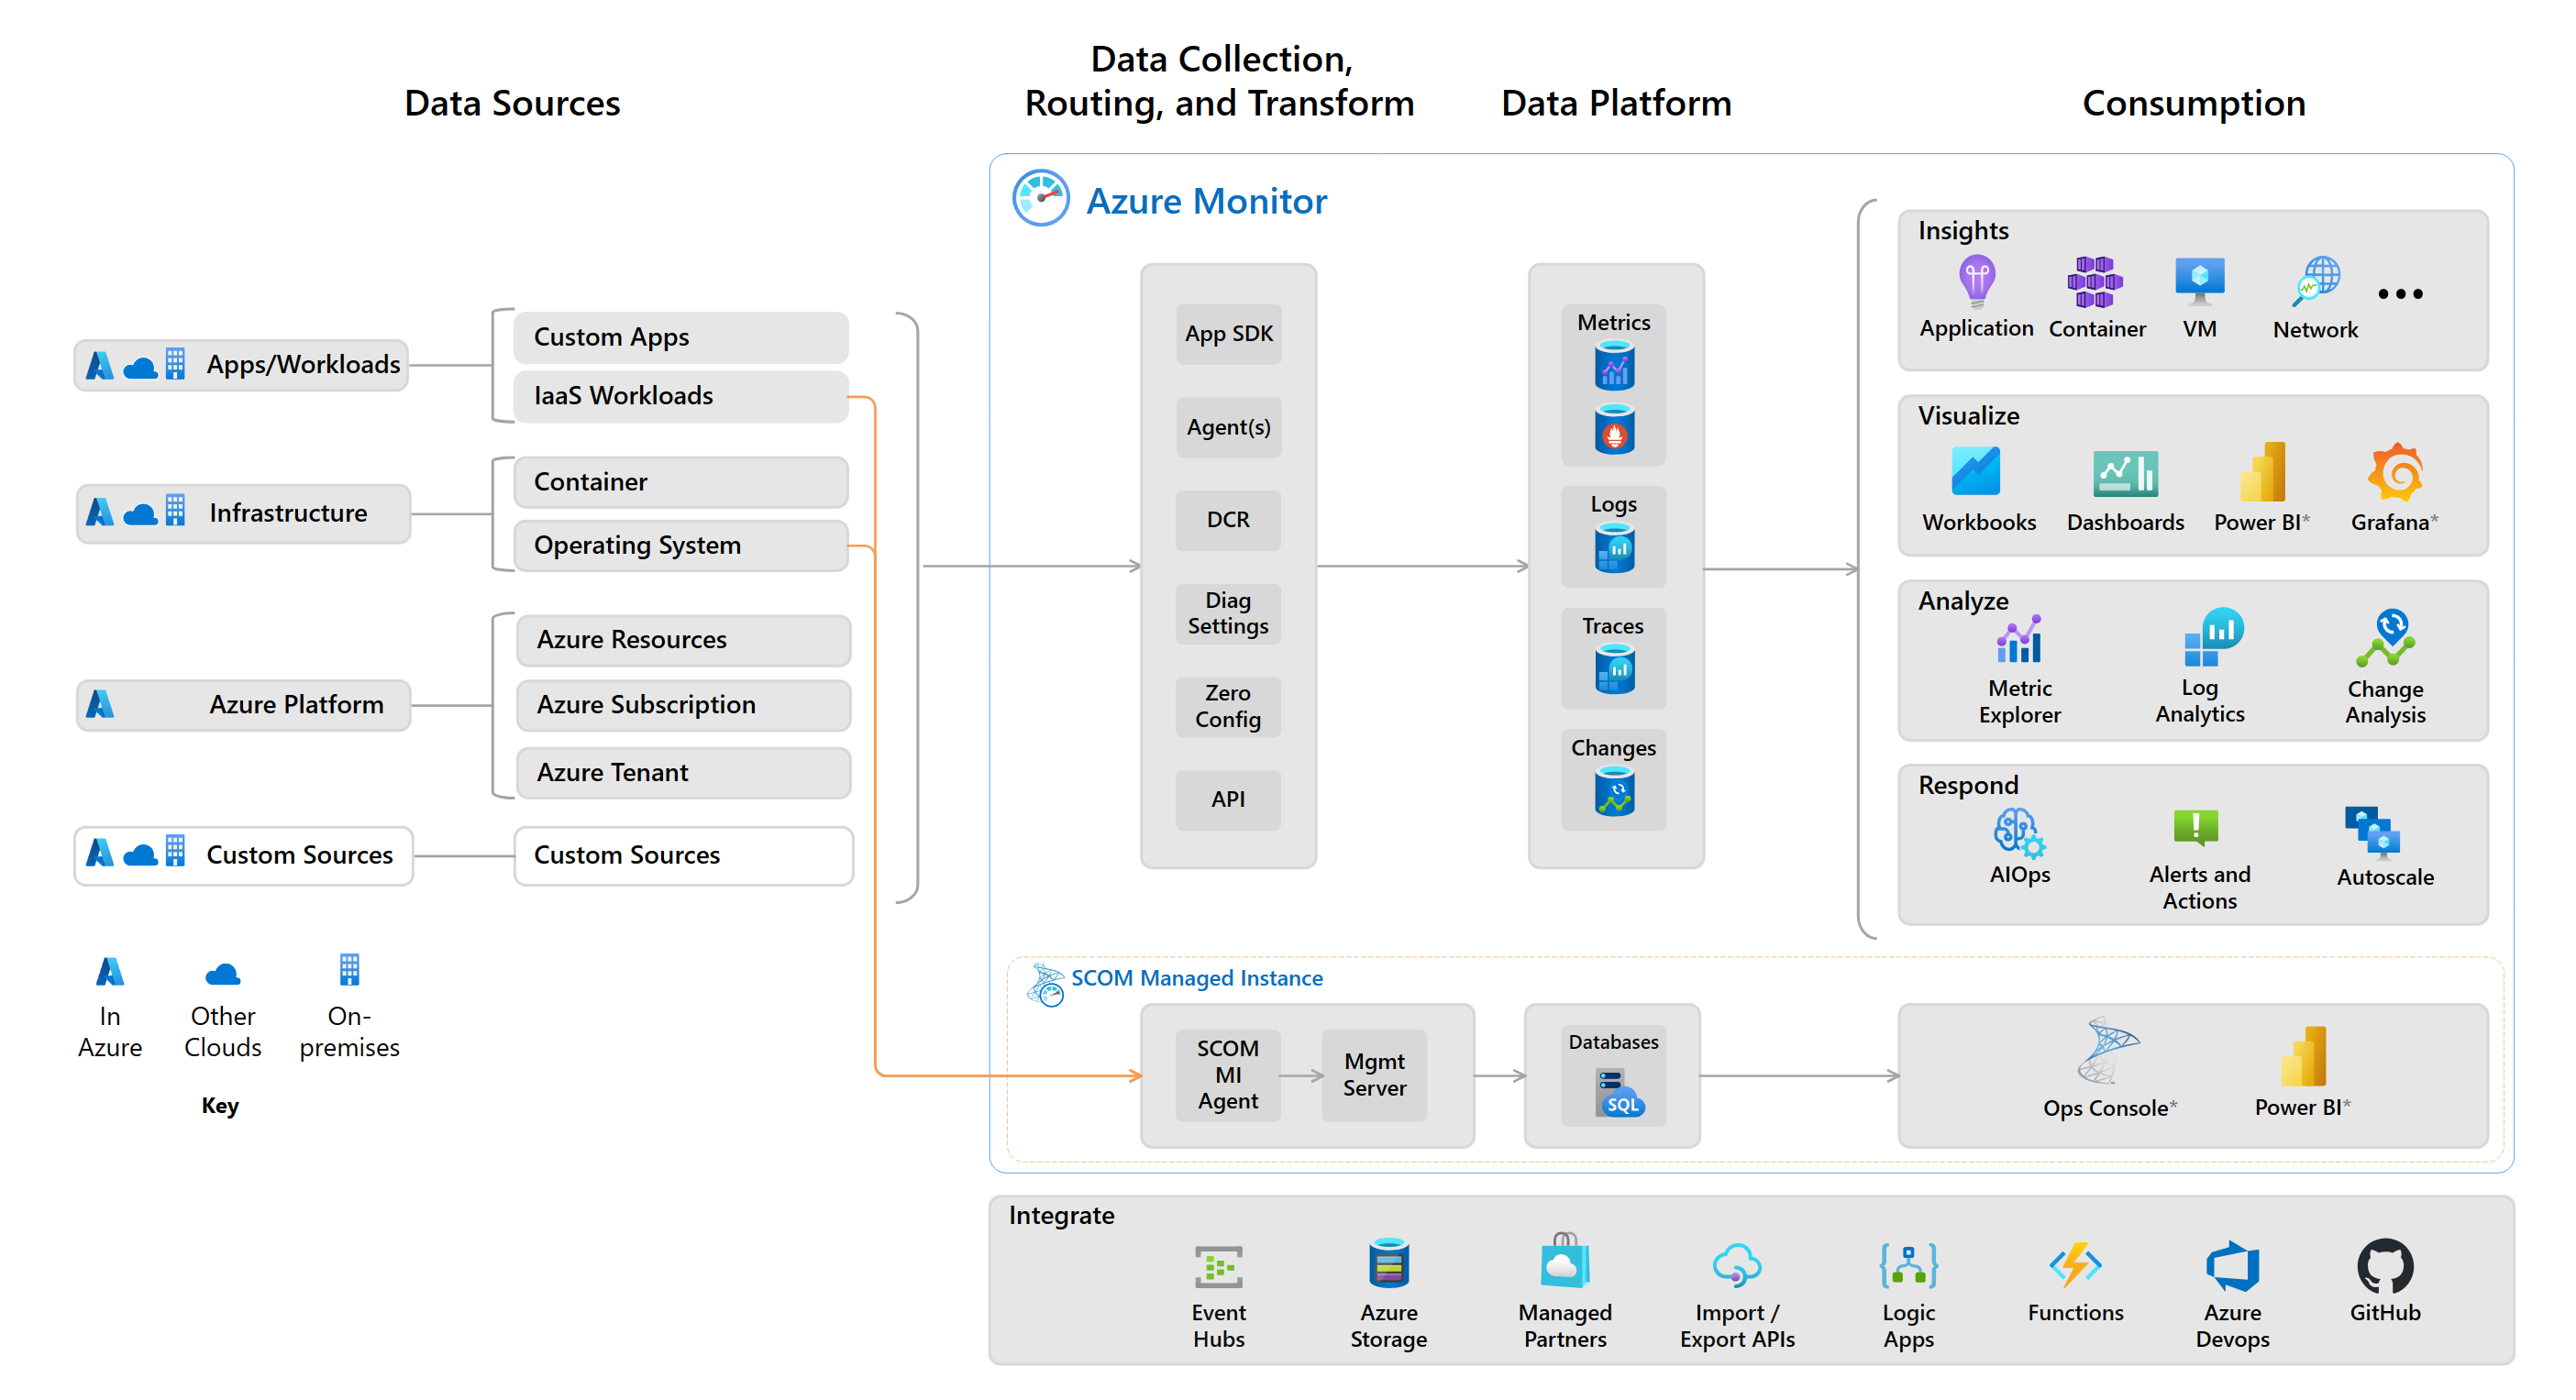
- The Data Sources section of the diagram shows the types of data that can be collected from each monitored resource. Azure Monitor collects data from the data sources and stores the data in the data platform.
- The Data Collection, Routing, and Transform section of the diagram shows the elements of Azure Monitor that collect, route, and transform source data for the data platform. Some data collection methods such as zero config are automatic, others such as diagnostic settings and the Azure Monitor REST API are elective.
- The Data Platform section of the diagram shows the categorized monitoring data. Azure Monitor's core data platform has stores for metrics, logs, traces, and changes.
- The Consumption section of the diagram shows the components that use data from the data platform. Azure Monitor's core consumption elements include tools to provide insights, visualize, analyze, and respond to data. The visualization tools build on the analysis tools and the insights build on top of both the visualization and analysis tools. Azure IoT Hub includes data metric, log, and alert consumption and response support using Metric Explorer, Log Analytics, and Alerts respectively.
The following sections provide more detail regarding data collection, storage, routing, and consumption.
Data sources
Azure Monitor can collect data from multiple sources.
Azure Monitor collects data from each of the following sources:
- Application monitoring data - Data about the performance and functionality of the code you write, regardless of its platform.
- Guest OS monitoring data - Data about the operating system on which your application is running. This OS could be running in Azure, another cloud, or on-premises.
- Azure resource monitoring data - Data about the operation of an Azure resource.
- Azure subscription monitoring data - Data about the operation and management of an Azure subscription, as well as data about the health and operation of Azure itself.
- Azure tenant monitoring data - Data about the operation of tenant-level Azure services, such as Microsoft Entra ID.
Data from platform metrics, the activity log, and resource logs have unique collection, storage, and routing specifications:
- Activity log - Subscription-level events that track operations for each Azure resource, for example, creating a new resource or starting a virtual machine. Activity log events are automatically generated and collected for viewing in the Azure portal. You can create a diagnostic setting to send the activity log to other destinations.
- Platform metrics - Numerical values that are automatically collected at regular intervals and describe some aspect of a resource at a particular time. Platform metrics are automatically generated and collected in Azure Monitor Metrics.
- Resource logs - Operation events that were performed by an Azure resource. Examples of operation might be getting a secret from a key vault or making a request to a database. Resource logs are generated automatically, but you must create a diagnostic setting to send them to Azure Monitor Logs.
- Virtual machine guest metrics and logs - Performance and log data from the guest operating system of Azure virtual machines. You must install an agent on the virtual machine to collect this data and send it to Azure Monitor Metrics and Azure Monitor Logs.
For more information about Azure Monitor data sources, see Sources of monitoring data for Azure Monitor.
Data platform
All data collected by Azure Monitor is stored as Metrics and Logs.
Metrics stores numeric values into a time-sequenced database that describe some aspect of the system at a particular point in time from monitored resources. The metric database is automatically created for each Azure subscription. Metrics can support near real-time scenarios.
Use Metrics Explorer to analyze data from Azure Monitor metrics.
Logs collects logs and performance data where they can be retrieved and analyzed in different ways by using log queries. Telemetry such as events and traces are stored as logs in addition to performance data so that it can all be combined for analysis.
Resource logs aren't collected and stored until you create an Azure Monitor diagnostic setting and route them to one or more locations. You must create a Log Analytics workspace to collect resource log data.
Use Log Analytics to analyze data from Azure Monitor Logs.
Data collection, routing, and transform
You can use diagnostic settings to route metrics and logs to the following locations:
- The Azure Monitor Logs store via an associated Log Analytics workspace. There the data can be analyzed using Log Analytics.
- Azure Storage for archiving and offline analysis.
- An Event Hubs endpoint where they can be read by external applications, for example, third-party security information and event management (SIEM) tools.
Metric and log routing is described in more detail in the Examine diagnostic settings for Azure IoT Hub unit page.
The Azure Monitor REST API lets you send data to a Log Analytics workspace in Azure Monitor Logs. You can also send metrics into the Azure Monitor Metrics store using the custom metrics API.
Event hubs are commonly used to route monitoring data to other non-Microsoft tools.
SCOM MI (like on-premises SCOM) uses an agent to collect data, which it sends to a management server running in a SCOM MI on Azure.
Consumption
Azure IoT Hub analysis features
You can analyze Azure IoT Hub monitor data using the following built-in Azure IoT Hub features:
- IoT Hub Overview page - The Azure IoT Hub overview page includes charts that show recent critical metrics. You can use this page to quickly assess the performance of the resource.
- Metrics Explorer - You can use Metrics Explorer to interactively work with metric data and create metric alerts. You need minimal training to use Metrics Explorer, but you must be familiar with the metrics you want to analyze. Metrics Explorer and Azure IoT Hub metrics are described further in the Examine metrics for Azure IoT Hub unit page.
- Log Analytics - With Log Analytics, you can create log queries to interactively work with log data and create log query alerts. Log Analytics is described further in the Examine Log Analytics for Azure IoT Hub unit page.
Visualization tools
You can visualize Azure Monitor data using the following built-in tools:
- Workbooks - Provide a flexible canvas for data analysis and the creation of rich visual reports. You can use workbooks to tap into multiple data sources from across Azure and combine them into unified interactive experiences. They're especially useful to prepare end-to-end monitoring views across multiple Azure resources. Insights use prebuilt workbooks to present you with critical health and performance information for a particular service.
- Dashboards - Are useful in providing a "single pane of glass" of your Azure infrastructure and services. While a workbook provides richer functionality, a dashboard can combine Azure Monitor data with data from other Azure services.
- Grafana - A useful open platform that excels in operational dashboards. Features include:
- Detecting, isolating, and triaging operational incidents.
- Combining visualizations of Azure and non-Azure data sources. These sources include on-premises, third-party tools, and data stores in other clouds.
- Power BI - Useful for creating business-centric dashboards and reports, along with reports that analyze long-term KPI trends. You can import the results of a log query into a Power BI dataset. Then you can take advantage of its features, such as combining data from different sources and sharing reports on the web and mobile devices.
For more information about built-in visualization tools, see Built-in visualization tools.