Examine diagnostic settings for Azure IoT Hub
An Azure Monitor diagnostic setting specifies a list of categories of platform logs and/or metrics that you want to collect from a resource, and one or more destinations that you would stream them to. Normal usage charges for the destination will occur.
You can access Azure IoT Hub diagnostic settings by selecting Diagnostic Settings in the Monitoring section of your Azure IoT Hub menu.
A diagnostic setting defines the following criteria:
- Sources - The type of metric and log data to send to the destinations defined in the setting.
- Destinations - One or more destinations to send to.
The following image shows an example Azure IoT Hub diagnostic setting configuration that includes multiple categories that feed into a Log Analytics workspace destination.
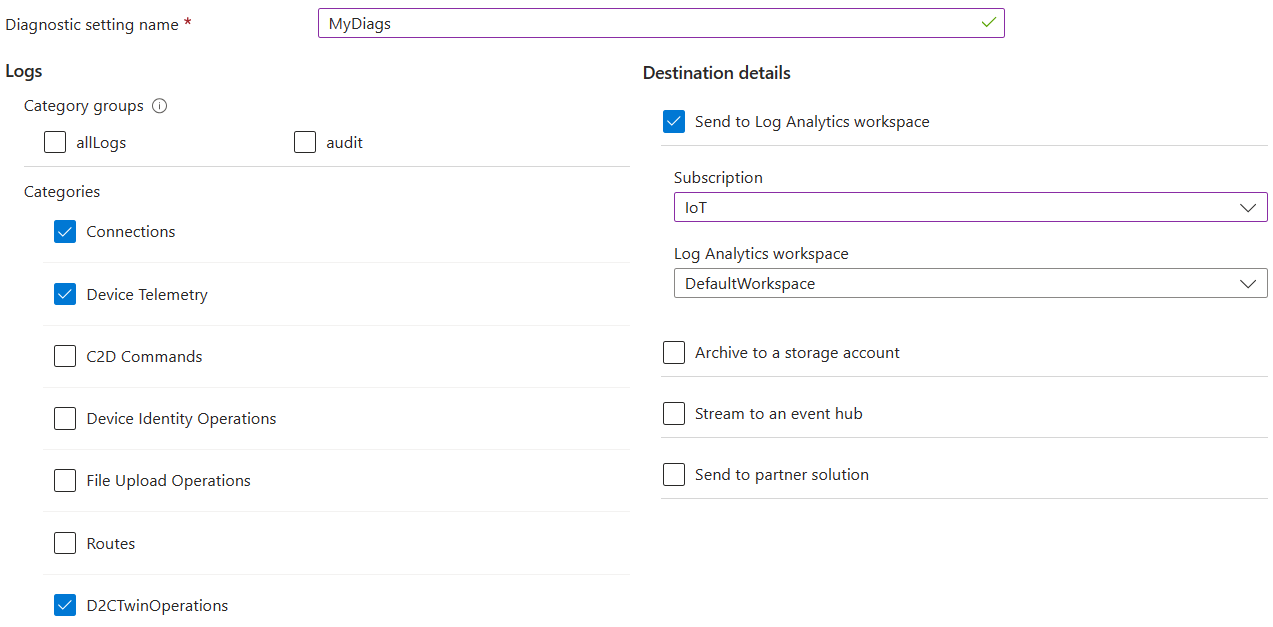
A single diagnostic setting can define no more than one of each of the destinations. If you want to send data to more than one of a particular destination type (for example, two different Log Analytics workspaces), create multiple settings. Each Azure IoT Hub resource can have up to five diagnostic settings.
Sources
There are three sources for diagnostic information:
- Metrics - Metrics route a resource's platform metrics to selected destinations. This option might not be present for all resource providers.
- Resource logs - With resource logs, you can select the log categories you want to route individually or choose a category group.
- Activity logs - The activity log uses a diagnostic setting, but has its own user interface because it applies to the whole subscription rather than individual resources. The destination information listed here still applies. For more information, see Azure Monitor activity log.
Platform metrics are sent automatically to Azure Monitor Metrics by default and without configuration.
Platform logs provide detailed diagnostic and auditing information for Azure resources and the Azure platform they depend on.
- Resource logs aren't collected until they're routed to a destination.
- Activity logs exist on their own but can be routed to other locations.
Resource log category groups
Use Category groups to dynamically collect resource logs based on predefined groupings instead of selecting individual log categories. Microsoft defines the groupings to help monitor specific use cases across all Azure services.
Over time, the categories in the group might be updated as new logs are rolled out or as assessments change. When log categories are added or removed from a category group, your log collection is modified automatically without you having to update your diagnostic settings.
When you use category groups, you:
- No longer can individually select resource logs based on individual category types.
- No longer can apply retention settings to logs sent to Azure Storage.
Currently, there are two log category groups:
- allLogs - Every resource log offered by the resource.
- audit- All resource logs that record customer interactions with data or the settings of the service. Audit logs are an attempt by each resource provider to provide the most relevant audit data, but might not be considered sufficient from an auditing standards perspective.
The audit category is a subset of allLogs, but the Azure portal and REST API consider them separate settings. Selecting allLogs collects all audit logs regardless of if the audit category is also selected.
Resource log categories
Select one or more check boxes in the Categories section to select resource log collection categories. For a description of each resource log category setting, see Resource logs.
Destinations
Platform logs and metrics can be sent to the following destinations. To ensure the security of data in transit, all destination endpoints support TLS 1.2.
- Log Analytics workspace - Metrics are converted to log form. This option might not be available for all resource types. Sending metrics to the Azure Monitor Logs store (which is searchable via Log Analytics) helps you to integrate them into queries, alerts, and visualizations with existing log data.
- Azure Storage account - Archiving logs and metrics to a storage account is useful for audit, static analysis, or back up. Compared to using Azure Monitor Logs or a Log Analytics workspace, storage is less expensive, and logs can be kept there indefinitely.
- Azure Event Hubs - When you send logs and metrics to Event Hubs, you can stream data to external systems such as third-party SIEMs and other Log Analytics solutions.
- Azure Monitor partner integrations - Specialized integrations can be made between Azure Monitor and other non-Microsoft monitoring platforms. Integration is useful when you're already using one of the partners.
If you want to store diagnostic logs in a Log Analytics workspace, there are two points to consider to avoid seeing duplicate data in Application Insights:
The destination can't be the same Log Analytics workspace that your Application Insights resource is based on.
The Application Insights user can't have access to both workspaces. Set the Log Analytics access control mode to Requires workspace permissions. Through Azure role-based access control, ensure that the user only has access to the Log Analytics workspace the Application Insights resource is based on.
These steps are necessary because Application Insights accesses telemetry across Application Insight resources, including Log Analytics workspaces, to provide complete end-to-end transaction operations and accurate application maps. Because diagnostic logs use the same table names, duplicate telemetry can be displayed if the user has access to multiple resources that contain the same data.
Time before telemetry gets to destination
After you set up a diagnostic setting, data should start flowing to your selected destination(s) within 90 minutes. If you get no information within 24 hours, then you might be experiencing one of the following issues:
- No logs are being generated.
- Something is wrong in the underlying routing mechanism.
If you're experiencing an issue, you can try disabling the configuration and then reenabling it. Contact Azure support through the Azure portal if you continue to have issues.
Activate diagnostics using PowerShell
If you want to enable all diagnostic metrics and logs for a resource with PowerShell, use the following code:
Connect-AzAccount
Select-AzSubscription -SubscriptionName <subscription that includes your IoT Hub>
Set-AzDiagnosticSetting -ResourceId <your resource Id> -Enabled $true
You can also user PowerShell to enable and disable individual metrics and log categories. For more information, see Set-AzDiagnosticSetting.
Control costs
There's a cost for collecting data in a Log Analytics workspace, so only collect the categories you require for each service. The data volume for resource logs varies significantly between services.
You might not want to collect platform metrics from Azure resources because this data is already being collected automatically in Metrics. Only configure your diagnostic data to collect metrics if you need metric data in the workspace for more complex analysis with log queries. Diagnostic settings don't allow granular filtering of resource logs.
For pricing information, see Azure Monitor pricing.
Read logs from an Azure Event Hub
After you set up event logging through diagnostics settings, you can create applications that read out the logs so that you can take action based on the information in them. This sample code retrieves logs from Event Hubs.
class Program
{
    static string connectionString = "{your AMS eventhub endpoint connection string}";
    static string monitoringEndpointName = "{your AMS Event Hubs endpoint name}";
    static EventHubClient eventHubClient;
    //This is the Diagnostic Settings schema
    class AzureMonitorDiagnosticLog
    {
        string time { get; set; }
        string resourceId { get; set; }
        string operationName { get; set; }
        string category { get; set; }
        string level { get; set; }
        string resultType { get; set; }
        string resultDescription { get; set; }
        string durationMs { get; set; }
        string callerIpAddress { get; set; }
        string correlationId { get; set; }
        string identity { get; set; }
        string location { get; set; }
        Dictionary<string, string> properties { get; set; }
    };

    static void Main(string[] args)
    {
        Console.WriteLine("Monitoring. Press Enter key to exit.\n");
        eventHubClient = EventHubClient.CreateFromConnectionString(connectionString, monitoringEndpointName);
        var d2cPartitions = eventHubClient.GetRuntimeInformationAsync().PartitionIds;
        CancellationTokenSource cts = new CancellationTokenSource();
        var tasks = new List<Task>();
        foreach (string partition in d2cPartitions)
        {
            tasks.Add(ReceiveMessagesFromDeviceAsync(partition, cts.Token));
        }
        Console.ReadLine();
        Console.WriteLine("Exiting...");
        cts.Cancel();
        Task.WaitAll(tasks.ToArray());
    }

    private static async Task ReceiveMessagesFromDeviceAsync(string partition, CancellationToken ct)
    {
        var eventHubReceiver = eventHubClient.GetDefaultConsumerGroup().CreateReceiver(partition, DateTime.UtcNow);
        while (true)
        {
            if (ct.IsCancellationRequested)
            {
                await eventHubReceiver.CloseAsync();
                break;
            }
            EventData eventData = await eventHubReceiver.ReceiveAsync(new TimeSpan(0,0,10));
            if (eventData != null)
            {
                string data = Encoding.UTF8.GetString(eventData.GetBytes());
                Console.WriteLine("Message received. Partition: {0} Data: '{1}'", partition, data);
                var deserializer = new JavaScriptSerializer();
                //deserialize json data to azure monitor object
                AzureMonitorDiagnosticLog message = new JavaScriptSerializer().Deserialize<AzureMonitorDiagnosticLog>(result);
            }
        }
    }
}