Packet core dashboards
If you need to monitor a specific site in a private mobile network locally, you can use the packet core dashboards that Azure Private 5G Core provides. The packet core dashboards are powered by Grafana, an open-source, metric analytics and visualization suite.
The packet core dashboards are available from the Azure Stack Edge (ASE) server on which the packet core instance is deployed. As they run locally on the ASE server, the impact of the network bandwidth and the cloud connectivity is minimized. With the packet core dashboards, you can monitor each site in your private mobile network continuously and in real time.
Dashboard user interface and default dashboards
Each dashboard contains the following user interface components:
Panels: Panels are for displaying statistics. Each statistic is displayed on a panel.
The packet core dashboards provide graph panels and single stat panels. The graph panels display multiple statistics and/or recent changes in a statistic. The single stat panels display a single statistic.
Rows: Rows are for organizing panels. Each dashboard has a minimum of one row.
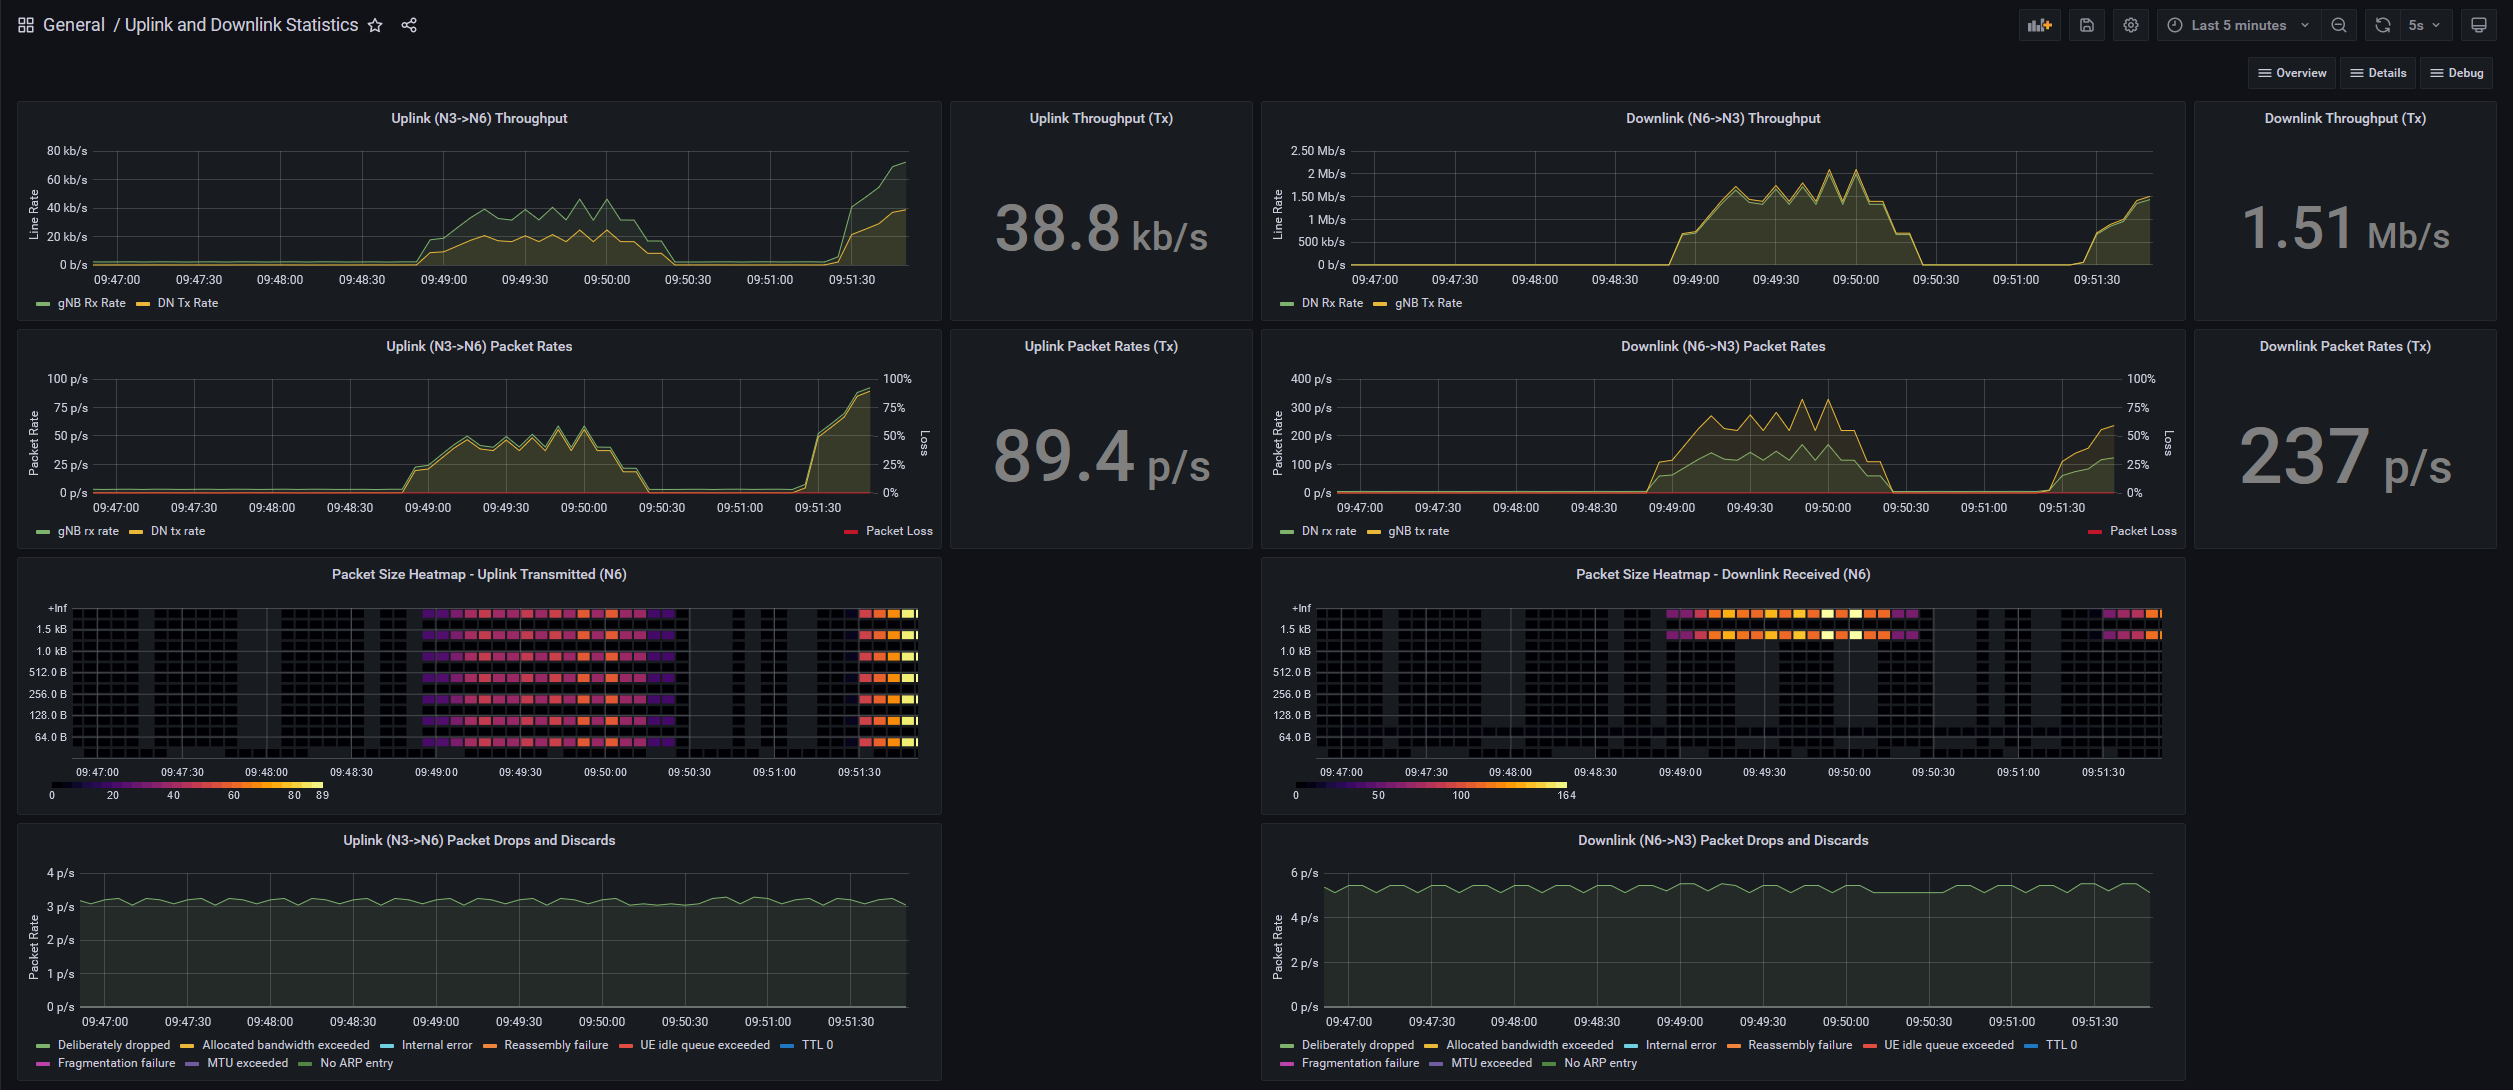
The following example dashboard contains both graph and single stat panels that are arranged into four rows:
By default, Azure Private 5G Core provides the following packet core dashboards:
- The Overview dashboard: Displays important key performance indicators (KPIs), including the number of connected devices, throughput, and any alerts firing in the system.
- The Alert dashboard: Provides information on the severity and effect of each firing alert.
- The Device and Session Statistics dashboard: Provides information about the device and session procedures being processed by the packet core instance.
- The Uplink and Downlink Statistics dashboard: Provides detailed statistics on the user plane traffic being handled by the packet core instance.
- The Debug dashboards: Show detailed breakdowns of the request and response statistics for the packet core instance's interfaces. The Debug dashboards include the System Statistics dashboard, the HTTP stats dashboard, and the 4G Interfaces dashboard.
For more information about the packet core dashboards, see Dashboards. If you want to add new dashboards or customize existing dashboards based on your business needs, refer to the Grafana documentation.
Note
Some packet core dashboards display different panels depending on whether the packet core instance supports 5G or 4G UEs.
Access the dashboards
The URL for accessing the packet core dashboards is as follows:
https://<LocalMonitoringIP>/grafana
Here <LocalMonitoringIP> is the IP address for accessing the local monitoring tools that you set up when you configure the management network during Azure Private 5G Core deployment.
Azure Private 5G Core provides two authentication methods for the packet core dashboards:
- Microsoft Entra ID: The Microsoft Entra method allows users to sign in with their Azure accounts.
- Username and password: The username/password method allows users to sign in with a default account.
Whenever possible, use the Microsoft Entra method, as it's more secure. Only use the username and password method when you don't have a stable connection to Azure. You can choose your preferred authentication method when you deploy or modify a site. For detailed instructions on configuring and using these authentication methods, see Packet core dashboards.
Access to the packet core dashboards is secured by HTTPS. You can use a self-signed certificate or provide your own to authenticate access to the dashboards. The article Modify the local access configuration in a site provides detailed instructions on checking or modifying the access certificate.
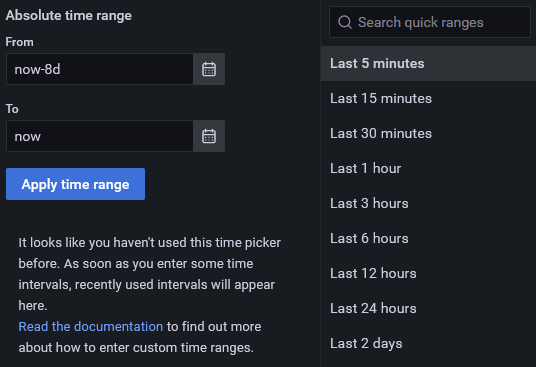
Adjust the time range
To check specific data, you may need to adjust the time range of the data displayed on a dashboard. For example, to retrieve diagnostics for historical problems, you may need to change the time range to a period in the past.
You can use the Time picker, which is in the top right-hand corner of each packet core dashboard, to adjust the time range for which the dashboard will display statistics.
The following screenshot shows the time picker: