Use Microsoft Power Platform Admin Center portal
As mentioned previously, the Power Platform Admin Center provides various tools that administrators can use for managing their Power Platform tenants. One of the key areas provided is the Analytics. It provides you with the ability to view important information related to all your environments, applications, and automations. It includes three options:
Dataverse: Provides analysis on important details related to your different Dataverse instances deployed in your environment such as active users, API calls, mailbox usage and more.
Power Apps: Provides analysis related to Power Apps performance information such as app locations, connectors details, and more.
Power Automate: Provides analysis related to Power Automate flows such as usage, error information, and connector details.
Working with analytics
The analytic reports can only display data related to a single environment at a time. You can change the environment you want to work with by selecting the change filters hyperlink, as shown in the following screenshot.
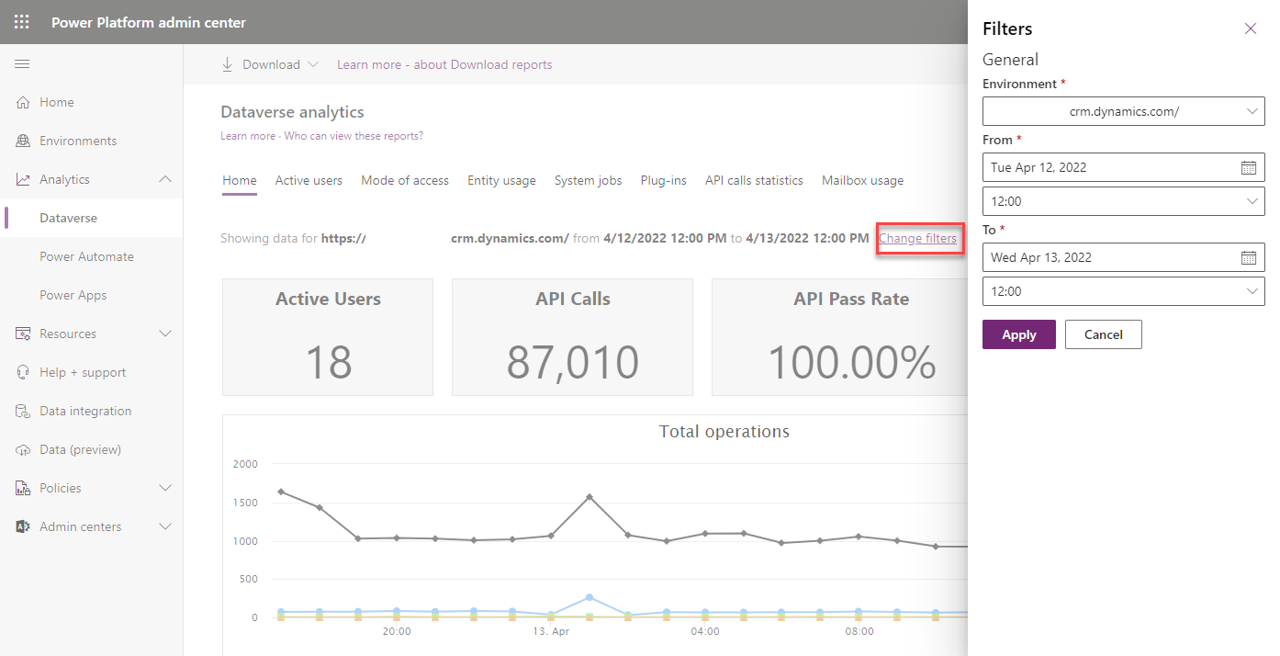
Depending on which option you selected, you'll have different options available in the report. For example, when you select Dataverse you'll have the following tabs:
Home: Default dashboard that provides information on the number of active Dataverse users, storage usage, API usage, plug-in calls, and more.
Active users: Provides information on the number of active Dataverse users, storage usage, the most active workflows, and more.
Mode of access: Provides information related to how users are accessing the environment, such as browser type, operating system type, type of device and more.
Entity usage: Provides information about which Dataverse tables are being used the most in the environment.
System jobs: Provides information that can be used for troubleshooting workflows.
Plug-ins: Provides information that can be used to monitor and troubleshoot plug-ins.
API call statistics: Provides information that can be used to monitor and troubleshoot API calls.
Mailbox usage: Provides information related to the different email mailboxes that are being used in the environment.
You can learn more about working with the different analytic options available here: