Note
Access to this page requires authorization. You can try signing in or changing directories.
Access to this page requires authorization. You can try changing directories.
Applies to: ✔️ Windows VMs
Performance issues occur in different operating systems or applications, and every issue requires a unique approach to troubleshoot. CPU, memory, networking, and input/output (I/O) are often key factors when performance issues occur. Each area generates different symptoms (sometimes simultaneously) and requires a different diagnostic approach and solution.
This article discusses high memory usage (also known as Memory Pressure) issues that occur on Azure virtual machines (VMs) that run the Windows operating system (OS). To get troubleshooting guidance for Azure VMs running Linux distros, see Troubleshoot performance and isolate bottlenecks in Linux.
Memory Pressure issues on Azure Windows VMs
Aside from the I/O and network latency issues, the CPU and/or memory troubleshooting requires mostly the same tools and steps as the on-premises servers do. One of the tools that Azure VM support recommends is PerfInsights (available for both Windows and Linux). PerfInsights can provide an Azure VM best practices diagnosis in a user-friendly report. PerfInsights is also a wrapper tool that can help collect Perfmon, Xperf, and Netmon data, depending on the flags that are selected within the tool. You don't have to contact Microsoft Support to run PerfInsights on your Azure VM. PerfInsights is publicly available. It generates the report locally or in your specified storage account.
Most of the performance troubleshooting tools that are used for on-premises servers, such as Perfmon or Procmon, will work on Azure Windows VMs. However, PerfInsights is explicitly designed for Azure VMs to provide more insights, including Azure best practices, SQL best practices, high-resolution IO latency graphs, memory and memory tabs, and so on. This article covers the part of PerfInsights relevant to memory troubleshooting.
What is Memory Pressure?
When the system is crunched on physical memory (random-access memory (RAM)) or virtual memory (backed by paging file), based on demand from the processes that are running, the OS keeps adjusting the active pages in RAM with a swap file. This case indicates that there's memory pressure, and the OS is working hard to get the working area to demanding apps. Memory leak is another variation. It's mostly a result of coding glitches where the OS continues to seek more allocations, ultimately leading to virtual memory exhaustion.
Many issues are directly related to the workload. The kind of workload that exists on the machine drives resource consumption, which includes memory.
Common factors
Here are common factors in a low memory situation. If any of these factors exist, you're close to the root of this issue:
A recent code change or deployment that's mostly applicable to apps such as Internet Information Services (IIS), Microsoft SharePoint, SQL Server, or third-party applications.
A recent update that might be related to an OS-level update or application-level cumulative updates and fixes.
A query change or outdated indexes. SQL Server and Oracle data-tier applications also have query plan optimization as another factor. Data changes or a lack of appropriate indexes can cause several queries to get more data pages in memory than what's optimal, which causes stress on swap space.
Azure VM-specific - Certain processes such as RDAgent, and extension-specific processes such as Monitoring Agent, MMA agent, or security client, might cause high memory consumption. These processes must be viewed from a configuration, known issues perspective, or sometimes a regression build.
Troubleshoot Memory Pressure issues
The intent of troubleshooting the issue is to zero down on the culprit process as much as possible. Further analysis is specific to the process that's found to be driving high memory consumption.
For example, if the process is SQL Server (sqlservr.exe), the next steps will be to analyze settings like MaxServerMemory and analyze which query is using the most memory cycles in a specific time period. For more information about SQL Server best practices in Azure, see VM size: Performance best practices for SQL Server on Azure VMs.
Scope Memory Pressure issue
Here are a few questions to ask when you troubleshoot the issue:
Is there a pattern to this issue? For example, does the low memory issue occur at a certain time every day, week, or month? If so, can you correlate it to a job, process, report, or user login?
App tier - Did the low memory issue start after a recent code change? Did you apply an update in Windows or deploy a new application build? Was there a sudden surge in the user base, or did load balancing mess up, leading to a different load pattern?
Data tier - Did the low memory issue start after a change in workload, such as an increase in the number of users, a higher data influx, or a larger number of reports being pulled? Was this workload recently migrated to Azure? Did it ever work fine?
For Azure, did the low memory issue start in any of the following conditions?
- After a recent redeployment or restart?
- When a VM type or tier was changed?
- After a new extension was added to the VM?
- After load balancer changes were made?
- Was there a scale in/out for your VMSS setup, which led to an invariable load?
Azure caveats
Most importantly, understand your workload. When you select a VM SKU (offering/type), you might underestimate the memory specs, as the tendency is to look at the overall monthly hosting cost. If your workload is memory-intensive, selecting a smaller VM SKU may lead to low memory issues. Test different configurations for your workload to determine the best computing capability required.
Are you planning to have a Multi-User setup like Azure Virtual Desktop (AVD)? The resources, including memory, need to be factored based on resource sharing while the sessions are active.
Is your app designed to bring its working context in memory? For example, MongoDB can be configured to work In-Memory, which means it will use the memory and swap spaces heavily. Therefore, the VM type (offering) you selected should meet this requirement.
For other known applications/configurations such as SQL Server, Oracle, RDS (Remote Desktop Services), Azure Virtual Desktop, IIS, or SharePoint, there are Azure best practices articles that include recommendations for which minimal configuration is best for these workloads.
Ongoing low memory issues
If the issue is occurring right now, this is the best opportunity to capture the process trace to determine what is causing the issue. To locate the process, you can use existing tools that you've been using for on-premises Windows servers, for example, Procmon, Perfmon, RAMMAP, xPerf Windows Toolkit, ResourceExplorer, and so on.
The following tools are recommended by Azure Support for Azure VMs:
PerfInsights
PerfInsights is the recommended tool from Azure support for VM performance issues. It covers best practices and has dedicated analysis tabs for memory, CPU, and high-resolution I/O graphs. You can run it OnDemand through the Azure portal or within the VM. It's deeply integrated with the Azure portal and also covers best practices recommendations for common windows guest tier applications.
If you have an active ticket with the Azure support team, you can share the PerfInsights data with them or use it independently as needed.
Get PerfInsights
PerfInsights is available for both the Windows and Linux OS.
Here are some options for Windows.
Run and analyze reports through Azure portal
When PerfInsights is installed through the Azure portal, it installs an extension on the VM. You can also install PerfInsights directly as an extension, by going to Extensions in VM blade, and then selecting a performance diagnostics option.
Azure portal - Option 1
Select the Performance diagnostics option. You'll be asked to install the option (uses extensions) on the VM that you selected. See the following screenshot for an example:
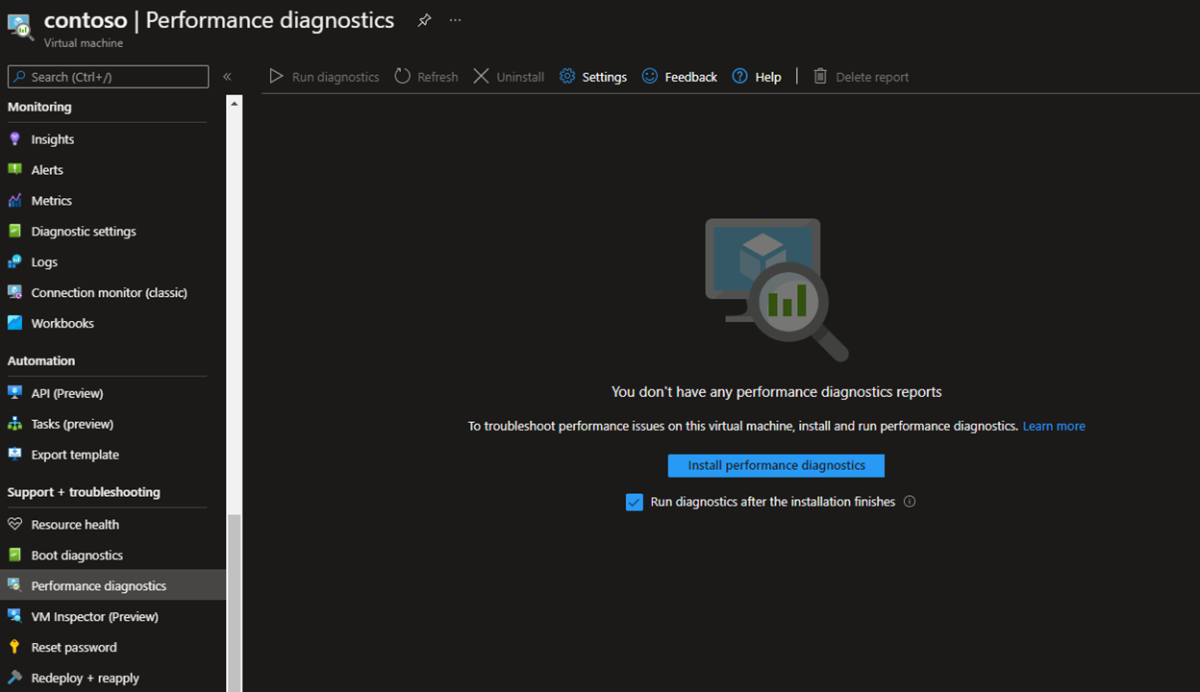
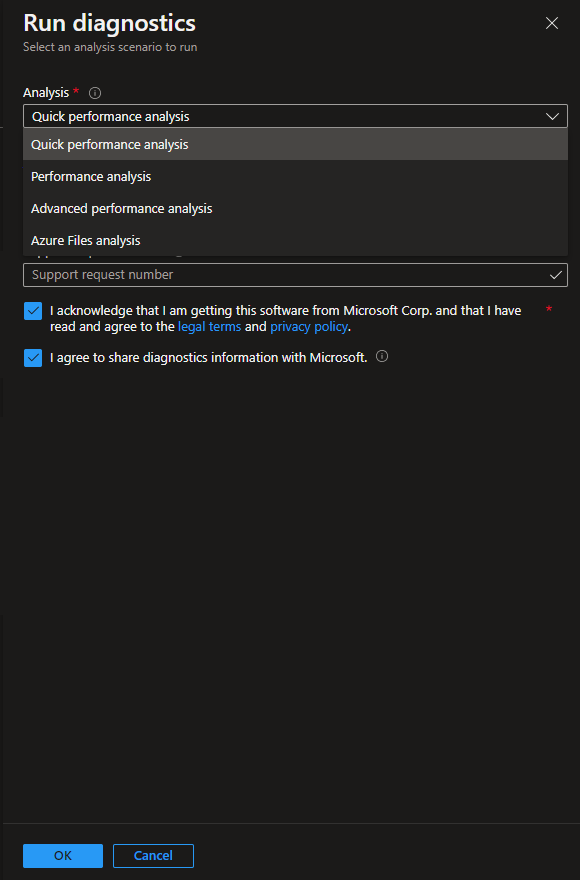
Select Install performance diagnostics. You'll see a Run diagnostics panel. In the Run diagnostics panel, you can select different analysis types to run. The preferred choices for memory analysis are Performance Analysis and Advanced Performance Analysis.
Based on your selection, you'll see further options. See the following screenshot for an example:
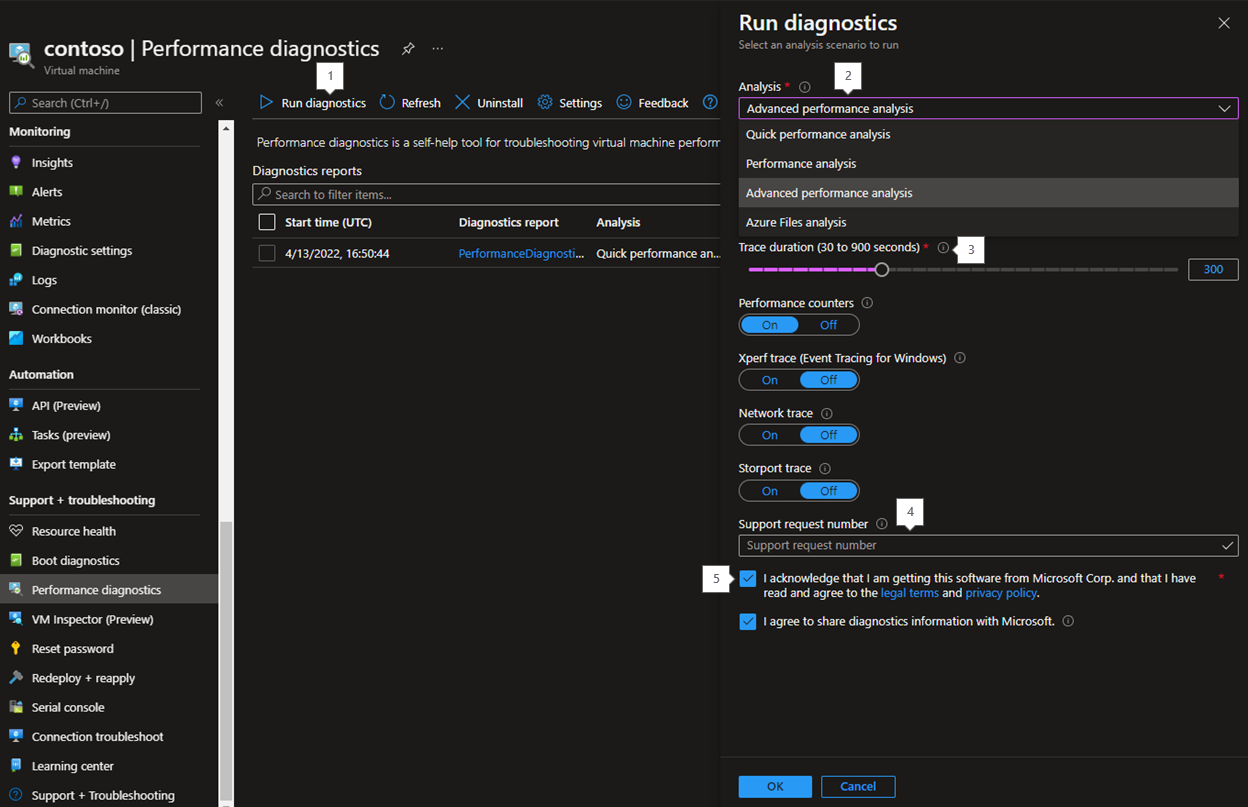
The numbered options in the screenshot relate to the following comments:
Select Run diagnostics.
For the Analysis option, select Performance analysis or Advanced performance analysis. Basic collection mainly gathers VM config and best practices suggestions. However, you'll need more detailed data for troubleshooting purposes, which only Performance analysis or Advanced performance analysis collection flags can capture.
Select the trace duration of data collection. For memory troubleshooting, select 15 minutes or more. In Azure portal mode, you can collect up to 15 minutes of data. For longer collection periods, you must run the program as an executable from within the VM.
If you're asked by Azure Support to collect this data, you can add the ticket number in the Support request number field. This field is optional.
Select the I acknowledge that I am getting this software from Microsoft Corp. and that I have read and agree to the legal terms and privacy policy checkbox to accept the End User License Agreement (EULA). Select the I agree to share diagnostics information with Microsoft checkbox if you intend to make this report available to the Azure Support team helping on this case.
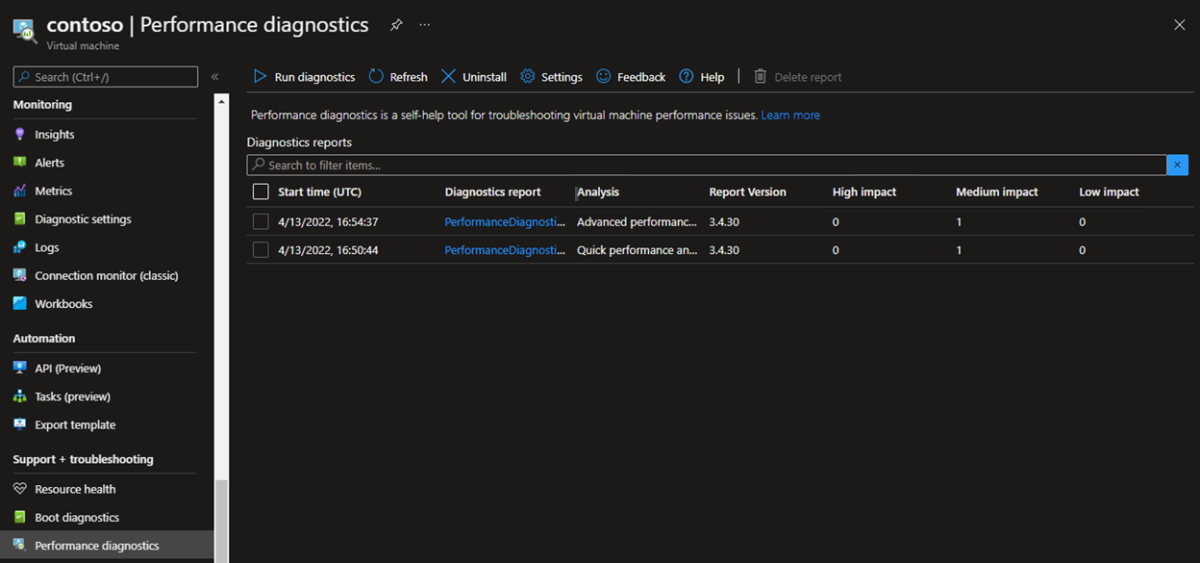
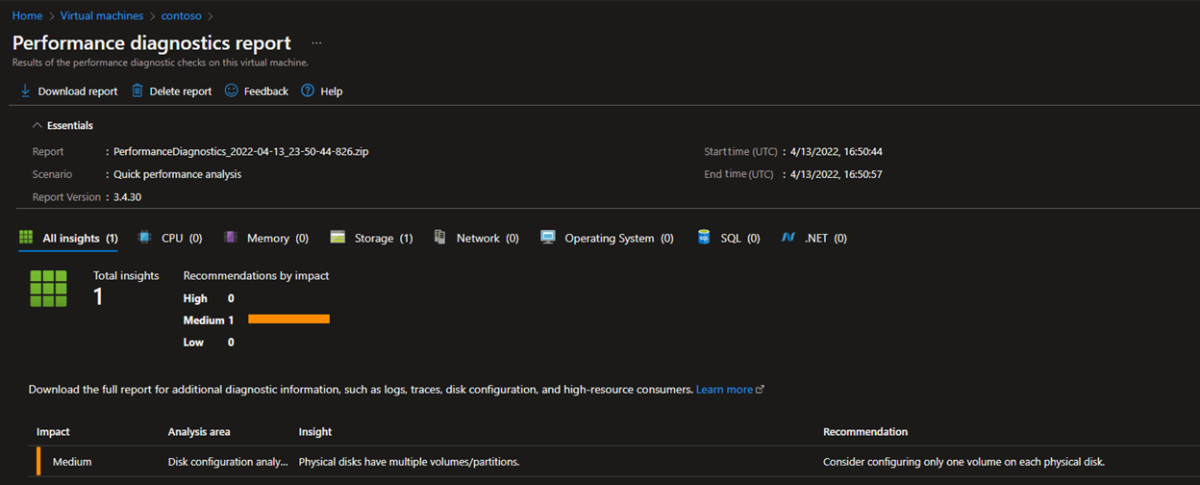
The Performance diagnostics report is stored in one of the storage accounts under your subscription. It's available to view and download later. Once you submit a diagnostic, this same Performance diagnostics view will also display past report collections and a summary of findings under High/Medium/Low categories. See the following screenshot for an example:
You can select any of the reports to see the next level of details. You can also download the report for detailed analysis by selecting Download report. See the following screenshot for an example:
Azure portal - Option 2
Select Diagnose and Solve Problems in the VM blade and look for VM Performance Issues in the right panel. See the following screenshot for an example:
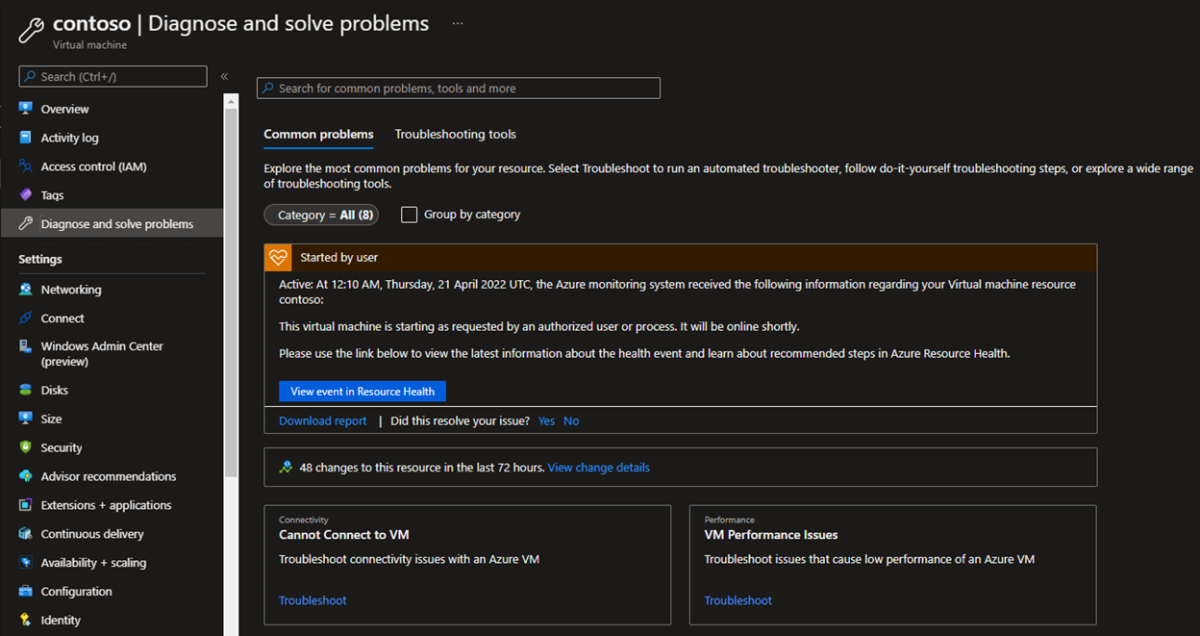
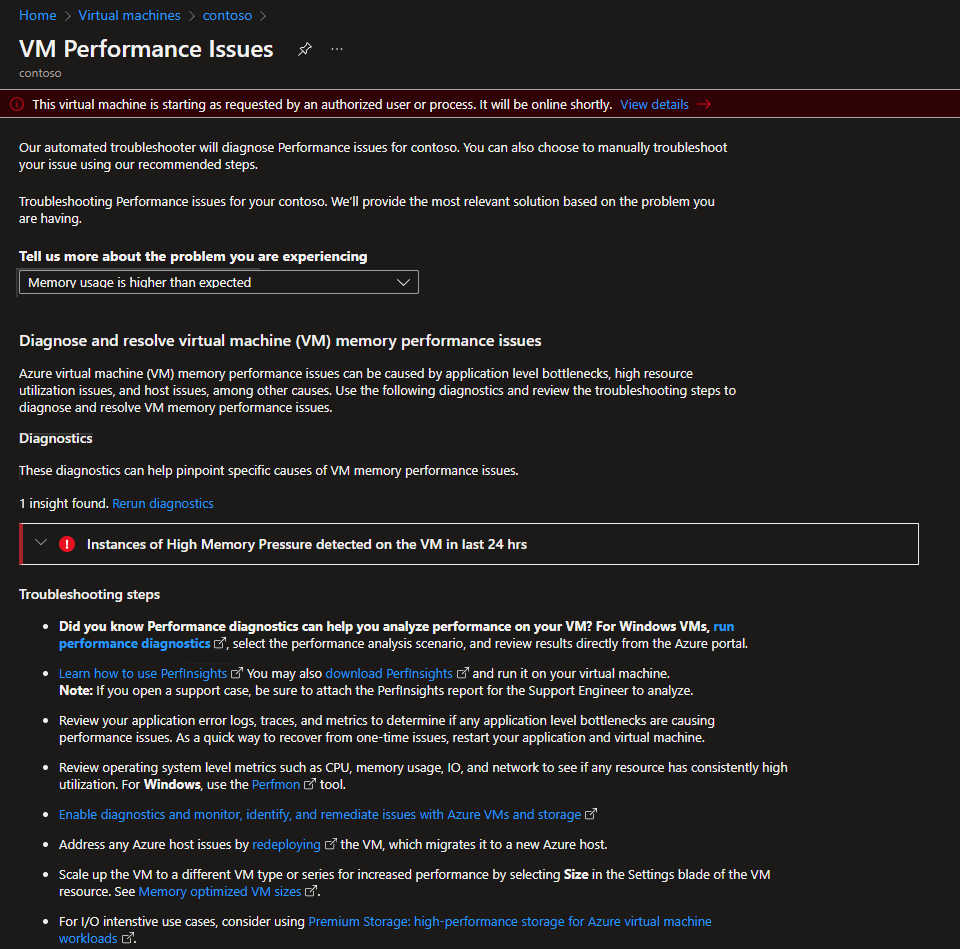
If you select Troubleshoot, the PerfInsights installation page loads. This page also shows automated diagnostics, which will run internal checks and show any instance of Memory Pressure on this VM for the last 24 hours. A run performance diagnostics link to switch back to PerfInsights view in Azure portal will also be displayed under Troubleshooting steps on this page.
Run PerfInsights from VM
This method can be used if you intend to run PerfInsights for longer durations. The PerfInsights article gives a detailed walk-through of the different commands and flags that are required to run PerfInsights as an executable. To analyze high memory usage, use either of the following modes and commands:
Advanced scenario
PerfInsights /run advanced xp /d 900 /AcceptDisclaimerAndShareDiagnosticsVM Slow (Performance) scenario
PerfInsights /run vmslow /d 900 /AcceptDisclaimerAndShareDiagnostics
The command will run for 15 minutes. The command output will be in the same folder where you save the PerfInsights executable. For more commands options, see How do I run PerfInsights?.
What to look for in the report
After you run the report, the location of the contents depends on whether it's run through the Azure portal or as an executable. For either option, access the generated log folder or download (if in Azure portal) locally for analysis.
Get into collected data
Your folder structure should resemble the following:
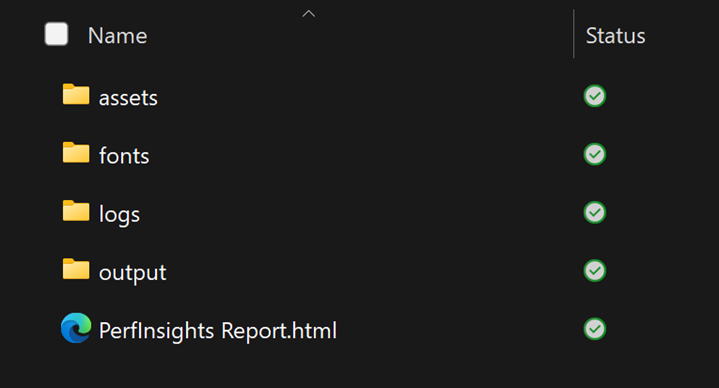
Any additional collections such as Perfmon, Xperf, Netmon, SMB logs, Event logs, and so on can be found in the output folder.
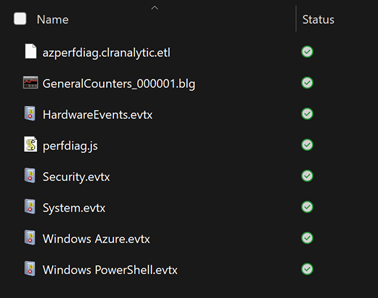
The actual report together with analysis and recommendations is Perfinsights Report.html.
For both Performance (VMslow) and Advanced scenarios, the report collects perfmon information during the PerfInsights run.
The event logs show a quick view of helpful system-level or process crash details.
Where to start
Open the PerfInsights report. The Findings tab logs any outliers in terms of resource consumption. If there are instances of high memory usage or any other resource constraints, the Findings tab will categorize it as either High impact or Medium impact.

If you expand the Findings event, you'll see several key details. The tab lists the processes in descending order per Average Memory consumption. It shows whether the process is related to the system or an app (SQL Server, IIS, or a third-party app).

More details
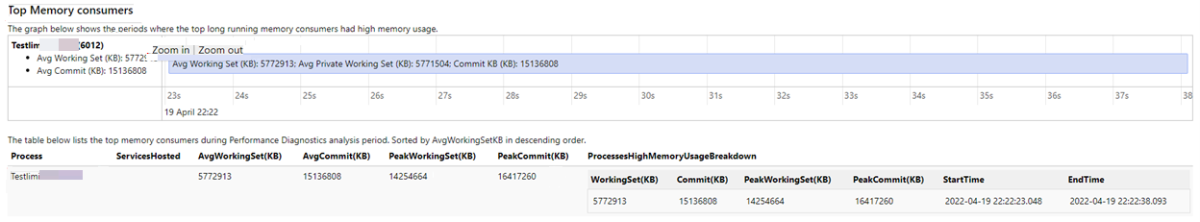
There's a dedicated subtab Top Memory Consumers under Memory. This tab can be used for detailed pattern analysis and shows process details during the data capture duration.
The Top Memory Consumers tab has two separate sections: High Memory Usage Periods and Top Memory Consumers.

High Memory Usage Periods: This section shows a time bar when the memory consumption is high. It also shows overall Committed Memory %, which is one of the key indicators of memory exhaustion. The AvailablePhysicalMemory% indicates how thin the system is running on memory or what is left available for it.
Top Memory Consumers: This section is equally important, as it shows process level details on high memory consumers during the data capture interval. This shows both the process details and their memory usage pattern. The list is sorted by having high average memory consumers at the top. Take a note of EndTime - StartTime (EndTime minus StartTime), which is the actual duration for the process consuming high memory during the overall data collection timeframe.

These two tabs are all you need to set the path for the next troubleshooting steps. Depending on the process that's driving the high memory condition, you'll have to address the questions that were asked earlier. Processes such as SQL (sqlservr) or IIS (w3wp) require a specific drill-down on query or code changes that are causing this condition.
For system processes such as WmiPrvSE or SvcHost, you have to follow a different path. A pre-requisite to those processes is that you should be on the latest OS cumulative patch.
For Azure VM-related processes such as RDAgent, Operations Management Suite (OMS), and security extension executables, you need to ensure these processes are on the latest versions. If the issue persists even after the process is upgraded to the latest build, seek help from the Azure Support team.
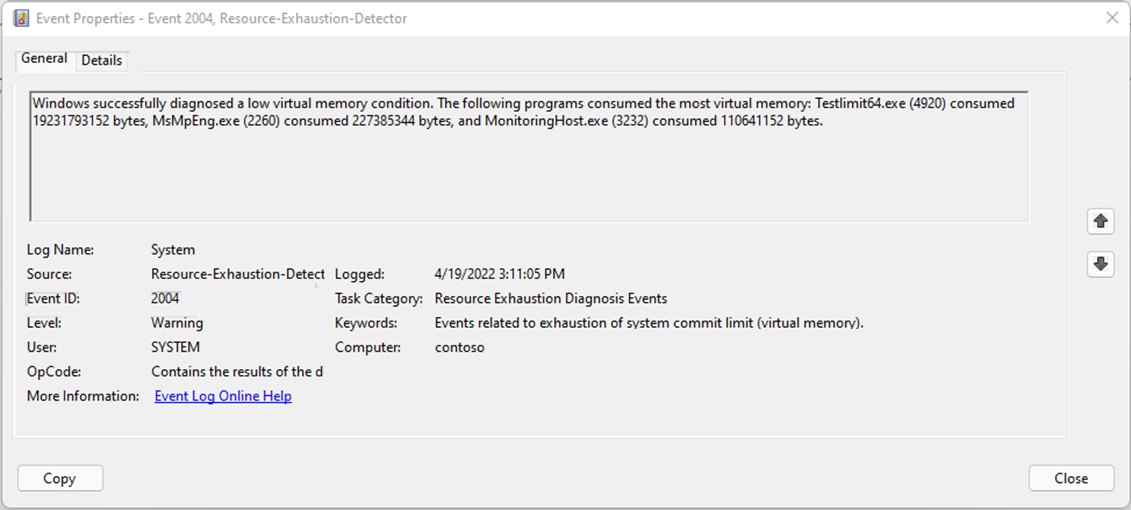
The system event logs also can log Event ID 2004 as a warning. It also shows the top three processes based on consumption.
Perfmon
Perfmon is one of the earliest tools for troubleshooting a resource issue on Windows OS. Note that it doesn't give a clear report with recommendations or findings. Instead, it requires users to explore the collected data and use a specific filter under the different counter categories.
PerfInsights collects Perfmon as an extra log for VMSlow and Advanced scenarios. However, Perfmon can be collected independently and has these additional benefits:
- It can be collected remotely.
- It can be scheduled through Tasks.
- It can be collected for longer durations or in continuous mode by using the roll-over feature.
Consider the same example shown in PerfInsights to see how Perfmon shows this data. A quick indicator for memory health is through the Available MBytes counter, which indicates the physical memory available for allocation to a system or process in need. Though the OS will start flagging processes to cut their WorkingSets when it senses contention, a generic ballpark number as a red flag for Available Mbytes is to be greater than 200 Mb (> 200 Mb).
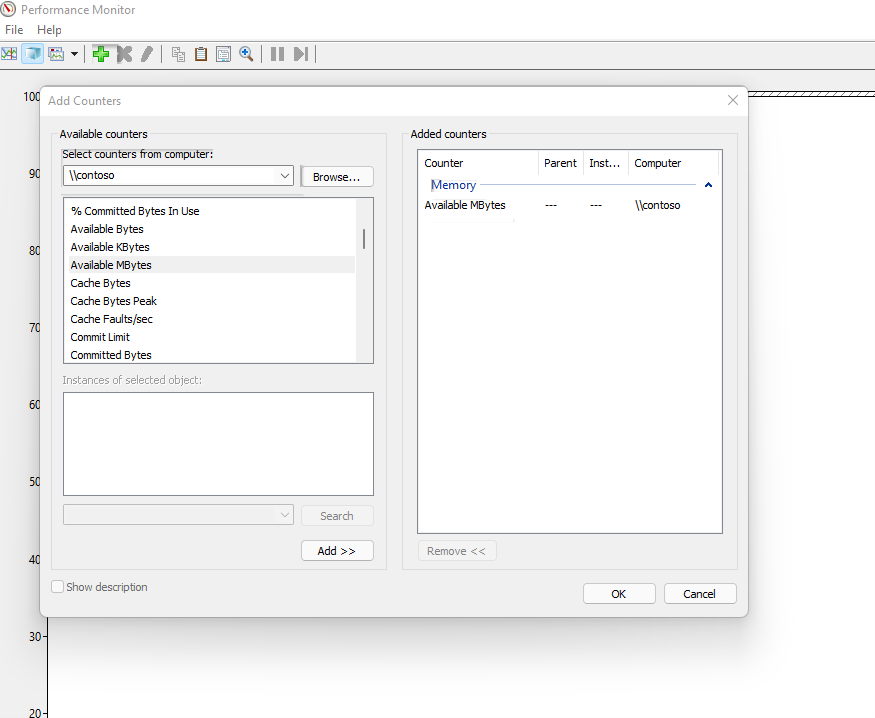
Perfmon is available by default in Windows (Server or client) and can be invoked through UI or a command line tool. To load Perfmon in Windows, select Start > Run, type Perfmon, and select OK. Any data collection done for Perfmon will have a *.blg extension.
You can add counters under various resource categories. For memory troubleshooting, opt for Memory > Available MBytes. See the following screenshot for an example:
Once you add this counter, it will show the pattern for AvailableMBytes during the data capture interval or at run time. Open the Perfmon (*.blg) file from the PerfInsights output folder and add the counter under Memory > Available MBytes. Check how it shows a dip in the memory available for the machine. See the following screenshot for an example:

But the question (which app is excessively consuming the memory?) remains. Tools like PerfInsights, Resource Monitor, Performance Analysis of Logs (PAL), and so on help to pinpoint these apps through friendly UI or reports.
It's a bit tedious to zero down on the process because it has to be done through manual data analysis.
Perfmon has the Process counter category. Under this category, there are some counters like Working Set, Private Bytes, and Virtual Bytes. They indicate the memory usage pattern of each process running during the data collection duration.
The pattern needs to be observed for those processes that have a gradual or steep rise indicating continuous demand for memory. Here's how to zero down on processes based on pattern matching close to the _Total/PrivateBytes counter.

Simplify Perfmon analysis
There are no default user-ready reports available in Perfmon. Different views change the graph type, but the process filtration (or the work required to identify culprit processes) is manual. Some useful tools are available that consume *.blg files and provide a more user-friendly output to analyze. One of them is the PAL tool. The PAL Tool can consume *.blg files and generate detailed reports.
The list of available tools doesn't end at PerfInsights for Perfmon. You can use any existing tools (Procmon, RAMMAP, xPerf Windows Toolkit, ResourceExplorer, and so on). There are many third-party tools available to use when necessary.
Azure monitoring tools
Any production system needs consistent monitoring, so Microsoft proactively gets alerts and uses them for historical patterns to understand the resource requirements for the app environment better. Luckily, Azure VMs (both Windows and Linux) are deeply integrated with Azure Monitoring capability, which provides robust automated metrics collection and several avenues to build reports or use third-party tools to build reports your team needs.
If a critical production VM is hitting a certain resource threshold (for example, memory), you can create custom alerts. In this case, you can alert a team through email or text.
Azure VMs have reliable metrics that include basic information such as memory, network I/O, and I/O bytes. For advanced metrics, such as Azure Monitor, you'll have to make only a few selections to configure and use a storage account that you specify.
Basic (default) counters
When Azure VMs are created, they come with basic default metrics pre-enabled. These metrics don't need any additional configuration to enable Azure Monitoring (which installs an extension in the VMs). The capability of these basic metrics isn't as exhaustive as what Azure Monitoring provides, but they can still show basic VM resource health.
The following screenshot shows how the pattern is displayed in the Azure portal under a VM's Memory metrics. This screenshot is from the same timeframe that's used earlier to share PerfInsights and Perfmon analysis.

Enable Azure Monitor
After you enable Azure Monitor metrics, the software installs an extension on the VM and then starts collecting granular metrics.
You can explore the exhaustive customization that Azure Monitoring provides in Azure virtual machines (Windows and Linux):
- Monitor Azure virtual machines
- Monitor virtual machines with Azure Monitor
- How to chart performance with VM Insights
Reactive troubleshooting
If the issue has already occurred, you must discover what caused the high-memory issue in the first place. The reactive stance can be tricky because the data collection mode won't be as useful as the issue has already occurred. As shared in the prior section, Azure Monitor configured metrics can play a big role here, as it maintains historical data based on the retention time configured.
If this issue was a one-time occurrence, it may be difficult to determine which app caused it.
If you're dealing with a repeating pattern, you have the opportunity to collect data during the period when the issue is likely to occur next. PerfInsights and Perfmon are handy tools, but you can use your preferred tools too.
PerfInsights doesn't have a scheduled run capability yet. However, Perfmon can be run and scheduled through the command line, as shared in the next section.
Logman command
The Logman create counter command is used to run Perfmon collection through the command line. You can schedule it through Task Manager or run it remotely.
Here's a command sample (includes remote collection mode):
Logman create counter LOGNAME -u DOMAIN\USERNAME * -f bincirc -v mmddhhmm -max 300 -c "\\SERVERNAME\LogicalDisk(*)\*" "\\SERVERNAME\Memory\*" "\\SERVERNAME\Network Interface(*)\*" "\\SERVERNAME\Paging File(*)\*" "\\SERVERNAME\PhysicalDisk(*)\*" "\\SERVERNAME\Process(*)\*" "\\SERVERNAME\Redirector\*" "\\SERVERNAME\Server\*" "\\SERVERNAME\System\*" "\\SERVERNAME\Terminal Services\*" "\\SERVERNAME\Processor(*)\*" "\\SERVERNAME\Cache\*" -si 00:01:00
Logman.exe can be started from a peer Azure VM computer in the same VNET.
To learn more about these parameters, see logman create counter.
After the Perfmon data is collected while the issue is occurring, the remaining steps to analyze the data are the same as discussed earlier.
Conclusion
For any performance issue, understanding your workload is the key to solving the problem. The options for different VM SKUs and different disk storage options have to be evaluated by focusing on the production workload (use Azure Virtual Machine selector). The process of testing solutions on different VMs can help you make the best decision.
Because the user operations and amount of data varies, always keep a buffer in the memory, computing, networking, and I/O capabilities of the VM. This way, any sudden change in workload can be absorbed by this additional resource buffer.
If you expect the workload to increase soon, move to a higher VM offering or type with more compute/memory/IO capability. If the workload is memory-intensive, carefully choose VM SKUs with higher memory-to-CPU ratios.
Contact us for help
If you have questions or need help, create a support request, or ask Azure community support. You can also submit product feedback to Azure feedback community.