Note
Access to this page requires authorization. You can try signing in or changing directories.
Access to this page requires authorization. You can try changing directories.
Applies to: .NET Core 2.1, .NET Core 3.1, .NET 5
This article discusses how to use the createdump tool to capture .NET Core crash dump files in Linux, and then use lldb to diagnose the crash problem.
Prerequisites
The minimum requirement to follow these troubleshooting labs is to have an ASP.NET Core application to demonstrates low-CPU and high-CPU performance problems.
You can find several sample applications to achieve this goal on the internet. For example, you can download and set up Microsoft's simple webapi sample to demonstrate undesirable behavior. Or, you can use BuggyAmb ASP.NET Core application as the sample project.
If you have followed the previous parts of this series, you should have the following setup ready to go:
- Nginx is configured to host two websites:
- The first listens for requests by using the myfirstwebsite host header (
http://myfirstwebsite) and routing requests to the demo ASP.NET Core application that listens on port 5000. - The second listens for requests by using buggyamb host header (
http://buggyamb) and routing requests to the second ASP.NET Core sample buggy application that listens on port 5001.
- The first listens for requests by using the myfirstwebsite host header (
- Both ASP.NET Core applications should be running as services that restart automatically when the server is restarted or the application stops responding.
- The Linux local firewall is enabled and configured to allow SSH and HTTP traffic.
Note
If your setup isn't ready, go to "Part 2 Create and run ASP.NET Core apps."
To continue this lab, you must have at least one problematic ASP.NET Core web application that's running behind Nginx.
Goal of this lab
Automatically generated core dump files aren't useful because they don't contain all the managed state information. The recommended tool to capture .NET Core core crash dump files is createdump.
In this part, you'll learn how to capture a crash dump file by using createdump, and open the file in lldb to diagnose the crash problem.
Configure createdump to run at process termination
Createdump is installed automatically together with every .NET Core runtime.
As explained in the createdump configuration policy documentation, you can set configuration options that have environment variables. These are passed to the createdump command as parameters. Here are the environment variables that are supported:
COMPlus_DbgEnableMiniDump: If set to 1, enables automatic core dump generation upon termination. Default is 0.COMPlus_DbgMiniDumpType: This is the type of the mini dump file that will be created. The default value for this is 2 (or, an enum type ofMiniDumpWithPrivateReadWriteMemory). This means that the dump file that's generated will include the GC heaps and the necessary information to capture stack traces for all existing threads in a process.COMPlus_DbgMiniDumpName: If set, use as the template to create the dump file path and file name. The PID can be put into the name by using the%dparameter. The default template is /tmp/coredump.%d. By using this environment variable, you can configure the output directory.COMPlus_CreateDumpDiagnostics: If set to 1, enables the createdump tool diagnostic messages (TRACE macro). This setting might be useful if createdump doesn't work as expected and doesn't generate a memory dump file.
You can find details about these variables in createdump configuration policy.
The important variable here's COMPlus_DbgEnableMiniDump. You have to set this environment variable to 1. There are several methods to set this environment:
- Set it in your application's configuration file.
- Use the
export COMPlus_DbgEnableMiniDump=1command to set it. This setting won't persist after an operating system restart. Therefore, you have to set it as persistent if you want to keep the setting enabled after a restart. - Set it in the ASP.NET Core service unit file.
Setting this variable in ASP.NET Core service unit file is the easiest method. The drawback is that the service should be restarted. In this troubleshooting section, this will be the option that is demonstrated.
Open the buggy application's service file, and add the COMPlus_DbgEnableMiniDump=1 environment variable. That's the same as you have done several times in previous chapters of this training.
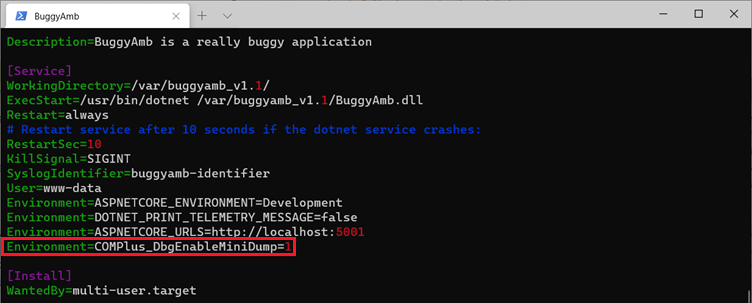
You have to reload the service configuration because the configuration was changed. Then, restart the BuggyAmb service.

After you make these changes, reproduce the crash problem. If createdump works, the dump file should be written under /tmp/ directory as coredump.<PID>. Follow the same steps to reproduce the problem:
- Select Crash 3. The page loads correctly but returns a misguiding message that suggests that the process should have crashed.
- Select Slow. This will generate an "HTTP 502" response code (bad gateway error) instead of the product table.
- After the problem occurs, none of the pages will render, and you'll receive the same error message for 10-15 seconds.
- After 10-15 seconds, the application starts working correctly.
You should now have a core dump file in the /tmp directory.

If you don't have a core dump file, make sure that you configured the buggyamb.service file correctly. You also have to reload the service configuration and restart the service.
Open the core dump file in lldb
We recommend that you move the dump file to your ~/dumps/ folder to follow along with the sample analysis. To open the dump file, run lldb --core ~/dumps/coredump.<10354>. In this command, replace the 10354 placeholder with the PID of your process.
Note
If you have previously opened a dump file and worked with lldb, you have already set up symbols and installed SOS. You can open the same .NET Core version dump file without having to download the symbols again. However, if you open a different .NET Core version dump file for which the symbols aren't yet downloaded, you'll have to download the symbols for that version before you can start the analysis.
Run the SOS clrstack command to display the managed call stack. Remember that you were seeing an error when you ran the same command by using a core dump file that was generated by system. This time, you should see the correct managed call stack.
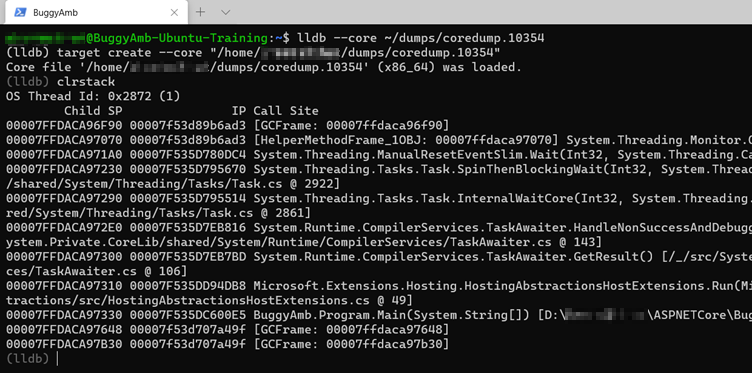
This is a good start. However, the call stack that's displayed belongs to the main thread of our debugged process. It's not the thread where the exception is thrown.
Note
If we open a crash dump file in WinDbg on Windows, WinDbg would directly select the thread that caused the crash. However, this isn't the case in lldb. In lldb, WinDbg doesn't automatically select the thread that triggered the debugger to generate the memory dump.
Although this WinDbg behavior is useful when you're debugging, the lack of this feature in lldb isn't the end of the world. Instead, you can examine all the threads to try to determine where the exception could be thrown. Start by examining the native threads by using the thread list command.
It's always a good idea to start by running a quick inspection of all the thread calls stacks so that you can understand what was running at the time that the dump file was generated. Look first at the native thread list that has the thread list command.
Note
The asterisk (*) near the first thread in the list (thread #1) indicates that it's the active thread.
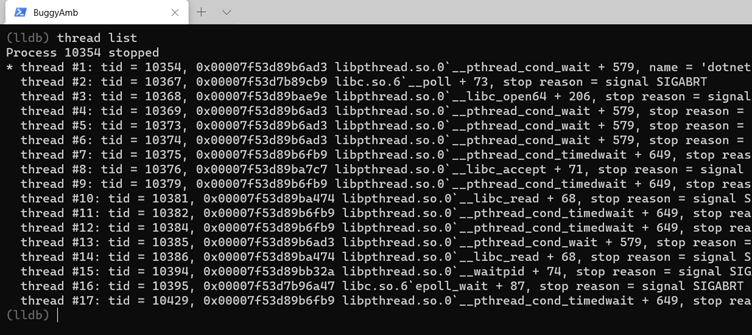
The native thread inspection doesn't reveal much. Because this is a .NET Core application, examine the list of CLR threads by running the SOS clrthreads command. This command lists the managed threads that are running in the application.
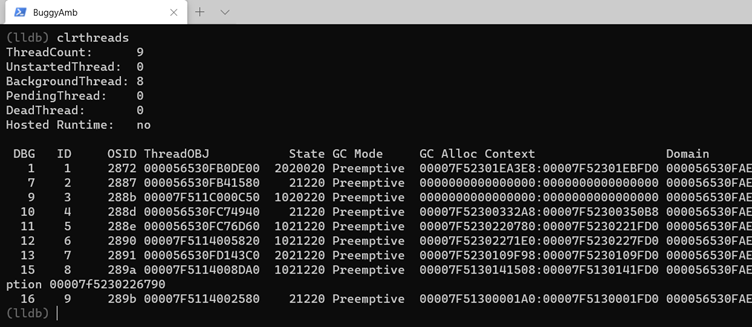
This screenshot isn't showing all the managed threads. However, the detail you should focus on is listed in the screenshot. Thread #15 has an exception that we have seen in our system logs.
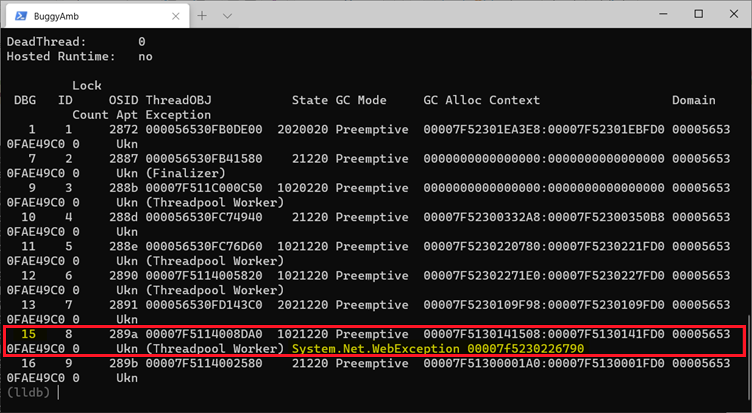
Examine that thread's call stack. To do this, you must first select the thread in question. In the memory dump analysis that you'll be running, the thread number most likely will be different. To select another thread as the active thread, use the thread select command, and pass the lldb dbg thread ID. For example, run thread select 15 to switch to thread 15. Then, every successive command that you run will be in that thread's context. To see the native call stack, run the bt (back trace) command.
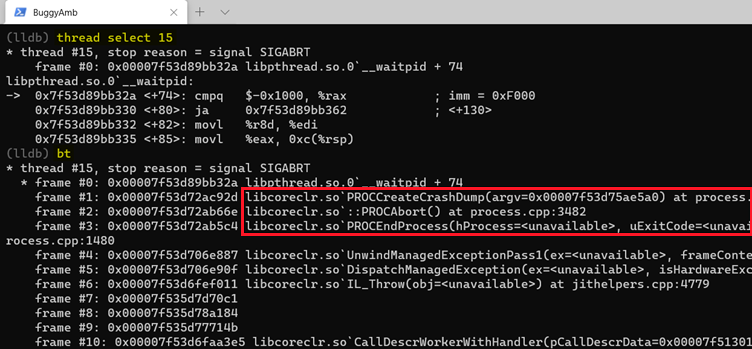
As you can see in this screenshot, this thread is certainly the thread that triggered the crash.
PROCEndProcessandPROCAbort()are called after an unhandled exception.POCCreateCrashDumptells us that a crash dump is written by .NET Core.
You can examine the managed call stack by running the clrstack command. However, this won't reveal much. Run the pe command to get the exception details.
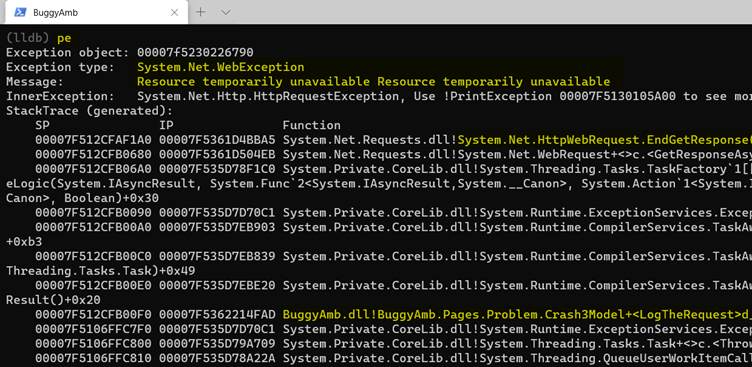
This information indicates: A System.Net.HttpWebRequest is triggered in your Crash3 page in the LogTheRequest() method. This is an important piece of information to help locate the problem. But what if you want to find the URL of the HTTP request? To proceed, try to inspect the objects that are referenced on the stack to see whether you can gather more information from this list. To display all managed objects that are found within the bounds of the current stack, run dso.

This isn't helpful. You should not see any System.Net.HttpWebRequest instances. There are instances of the exception, and you've already inspected it. Therefore, this command didn't yield new information that's related to the cause.
All the managed objects are stored in a managed heap, and we can look at the managed heap by running dumpheap. Don't run dumpheap without any parameter because then the command will list all the objects inside the managed heap (a large list). Instead, you can get the statistics of the heap by using the dumpheap -stat command.
You can use one more tactic to narrow down the statistics by running the command in the following format:
dumpheap -stat -type System.Net.HttpWebRequest
The following screenshot displays the statistics for the managed objects, which contain the string System.Net.HttpWebRequest in their name.

In the sample application, there is only one System.Net.HttpWebRequest object on the managed heap. In the previous list, the address that's seen next to the HttpWebRequest entry isn't that object's address in memory. Rather, it's the address that corresponds to the "method table" of objects of type System.Net.HttpWebRequest. To get the actual list of the objects, you can pass that method table (MT) address to the dumpheap command in the following manner:
dumpheap -mt <address>
For example, run dumpheap -mt 00007f53623cb640 to find the object's address.

Now, you're able to identify the address of the problematic object. In this example, it's 00007f51300c0868. You can investigate the object's properties by passing that address to the dumpobj command. This will list the properties of that object. In this example, run dumpobj 00007f51300c0868 to examine the object's properties.

Note
You're investigating a System.Net.HttpWebRequest object, and that one of its properties is _requestUri. This is an object of the System.Uri type. You want to determine the URI. Therefore, pass the address of the _requestUri property to the dumpobj command
Copy the address of the System.Uri object, and investigate it by using dumpobj again. Run dumpobj 00007f51300bfbb8. The address of the object in the memory dump file that you generated will most certainly be different. The list will display the _string property of System.Uri.

Copy the address of _string, and then again run the dumpobj command against it. Run dumpobj 00007f51300bfb40. The result is listed in the following screenshot.

Finally you're able to find the URL of the HttpWebRequest: http://buggyamb/Problem/Api/NotExistingLoggingApi. As the name suggests, this is probably not an existing page within the application.
To conclude, the theory about how the crash occurred is as follows:
- An HttpWebRequest is made to a non-existing URL in the
LogTheRequest()method in the Crash3 webpage. - In a real-world application, the solution to fix this issue would be to handle the errors when
HttpWebRequestis made. However, in this case, the solution is much simpler: Don't make anHttpWebRequestrequest to a non-existing page.
At this point, you should probably have more questions about what caused the crash. For example, why was the crash triggered after you selected the Slow link?
Feel free to continue investigation by yourself. The next suggested step you could take would be to run the gcroot command by using the HttpWebRequest object address to find out where it is rooted. This might help you develop a picture of how the crash occurred.
This concludes the lab. Press Ctrl+C or use the q command to quit the lldb debugger.
Next steps
Lab 2.1 Troubleshooting performance problems by using createdump in Linux