Note
Access to this page requires authorization. You can try signing in or changing directories.
Access to this page requires authorization. You can try changing directories.
Applies to: .NET Core 2.1, .NET Core 3.1, .NET 5
This article helps you analyze performance problems, and describes how to use createdump and ProcDump to capture .NET Core memory dump files manually in Linux.
Prerequisites
The minimum requirements to follow these troubleshooting labs are as follows:
- An ASP.NET Core application to demonstrate low-CPU and high-CPU performance problems and crash issues.
- The lldb debugger, installed and configured to load SOS extension when a core dump is opened.
If you have followed the previous parts of this series, you should have the following setup ready to go:
- Nginx is configured to host two websites:
- The first listens for requests by using the myfirstwebsite host header (
http://myfirstwebsite) and routing requests to the demo ASP.NET Core application that listens on port 5000. - The second listens for requests by using buggyamb host header (
http://buggyamb) and routing requests to the second ASP.NET Core sample buggy application that listens on port 5001.
- The first listens for requests by using the myfirstwebsite host header (
- Both ASP.NET Core applications should be running as services that restart automatically when the server is restarted or the application stops responding.
- The Linux local firewall is enabled and configured to allow SSH and HTTP traffic.
Note
If your setup isn't ready, go to "Part 2 Create and run ASP.NET Core apps."
Goal of this lab
So far in this troubleshooting series, you've analyzed a crash problem. In this lab, you'll be given the chance to analyze a performance problem, and learn how to use createdump and ProcDump to capture memory dump files manually.
Reproduce the problem
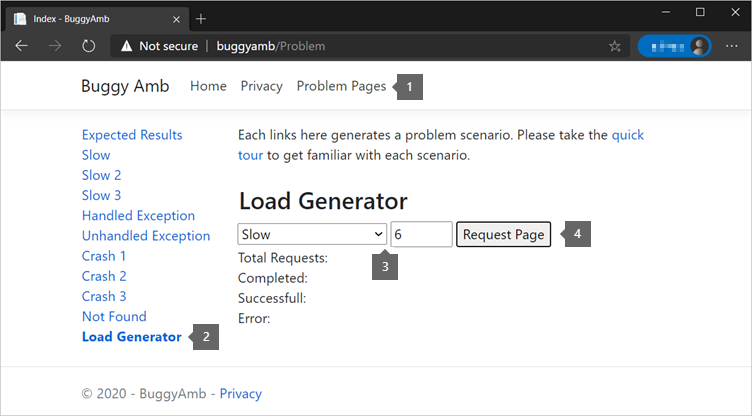
In a previous part, you tested the first "slow" scenario by selecting the Slow link. When you do this, the page loads correctly, but much more slowly than expected. In this part, You'll use the BuggyAmb Load Generator feature to troubleshoot this performance problem. This is an "experimental" feature that sends up to six simultaneous requests to any problematic resource. It's limited to six because it uses jQuery and Ajax calls to issue the requests. Web browsers set a limit on most Ajax requests to six concurrent requests to a given URL. If you want to learn how to use Load Generator to reproduce different scenarios, see Experimental "Load Generator".
To reproduce the problem, open Problem Pages, select Load Generator, and then send six requests in the Slow scenario.
The following list shows what you should, eventually, see in your browser. The displayed response times are high. The expected response time is less than one second. That's what you can expect to see when you select the Expected Results link from the application landing page.
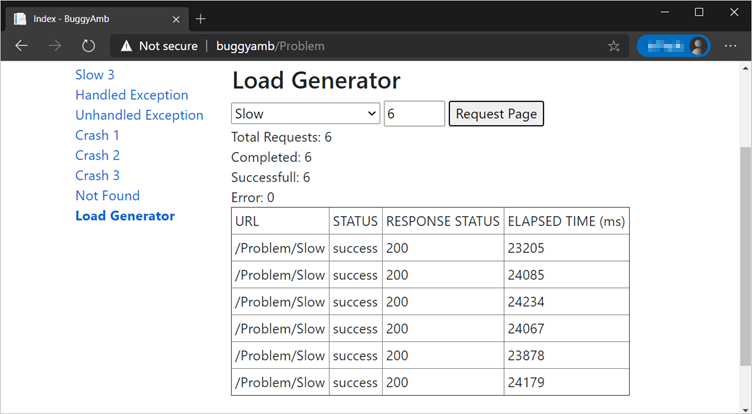
This is the problem that you'll troubleshoot.
Monitor the symptoms
Remember that a good troubleshooting session starts by defining the problem and understanding the symptoms. You'll use htop to monitor the process memory and CPU usage for the process that hosts the ASP.NET Core application when you try to reproduce the issue by generating load. If you don't remember what htop is, check the previous series parts.
Before you try to reproduce the problem, start by setting a baseline for how the application should perform. Select Expected Results or send multiple requests to the Expected Results scenario by using the Load Generator feature. Then, check what the CPU and memory usage look like when the problem isn't manifesting. You'll use htop to check the CPU and memory usage.
Run htop, and filter it to show only the processes that belong to the user under whom the buggy application is run. The user of the target ASP.NET Core application in this case is www-data. Press the U key to select that www-data user from list. Also press the Shift+H to hide the threads. As you can see, there are four processes running in the context of www-data, and two of them are the Nginx processes. The others are for the buggy application and the demo application that you created when you set up the environment.
Because you haven't reproduced the performance problem yet, notice that all the CPU and memory usage statistics are currently low.

Now, return to your client browser, and send six requests to the Slow scenario by using Load Generator. After that, quickly return to your Linux device, and observe the process resource consumption in htop. You should see that the CPU usage of the buggy application increased dramatically, and the memory usage fluctuates up and down.
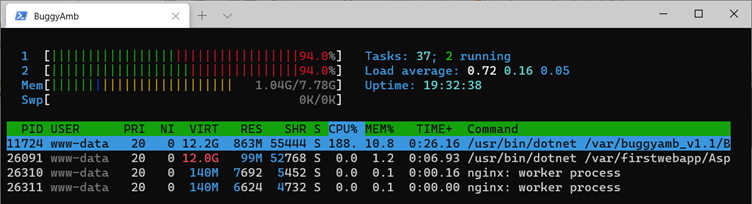
Note
Because this output is taken from a virtual machine that's equipped with two logical CPUs, htop shows more than 100 percent CPU usage.
After all the requests are eventually processed, the CPU and memory usage decrease. Both CPU and memory usage trends should make you suspect that there might be heavy GC (Garbage Collector) usage in the application during the processing of the requests.
Collect core dump files
When you troubleshoot a performance problem, consecutive memory dump files are captured and analyzed. The idea behind capturing multiple dump files is simple: A process dump is a snapshot of the process memory. It contains no past information. To troubleshoot performance problems, you should capture multiple manual memory dump files or core dump files so that you can compare the threads and heaps, and so on.
Use the following recommended options to capture manual memory dump files on demand:
- Createdump
- Procdump
- Dotnet-dump
Createdump
Createdump is included together with the .NET Core runtime. It's located in the runtime directory. You can find your runtime directory paths by using the dotnet --list-runtimes command.
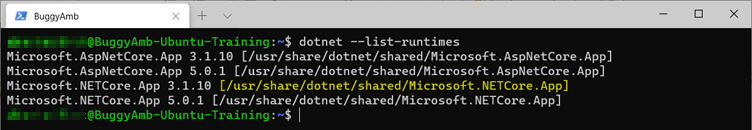
Because the buggy application is a .NET Core 3.1 application, the full path of createdump is /usr/share/dotnet/shared/Microsoft.NETCore.App/3.1.10/createdump.
The simplest form of this command is createdump <PID>. This will write one core dump for the target process. You can indicate the tool where to create the dump files by adding the -f switch: createdump <PID> -f <filepath>. For this exercise, create the dump files in the ~/dumps/ directory.
You'll capture two consecutive memory dump files of the BuggyAmb process 10 seconds apart. You have to capture the dump files while you reproduce the "slowly responding requests" problem. To get started, you first have to find the PID of the process. Use either the htop or systemctl status buggyamb.service command. In the following lists, the process PID is 11724.
To create the dump files, follow these steps:
- Create the first file:
sudo /usr/share/dotnet/shared/Microsoft.NETCore.App/3.1.10/createdump 11724 -f ~/dumps/coredump.manual.1.%d. - Wait 10 seconds after the first dump file is written.
- Create the second file:
sudo /usr/share/dotnet/shared/Microsoft.NETCore.App/3.1.10/createdump 11724 -f ~/dumps/coredump.manual.2.%d
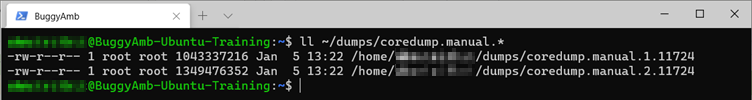
In the end, you should have two memory dump files. Note the size of each dump file.
Analyze dump files in lldb
You should already know how to open dump files in lldb. Open both files in lldb in two different SSH sessions.
Your objective is to develop a theory about what could be causing the performance problem. You already know that the CPU and memory usage are high when the problem occurs. To check the managed memory, you can use the dumpheap -stat command. Before you start, take a quick look at the first dump file.
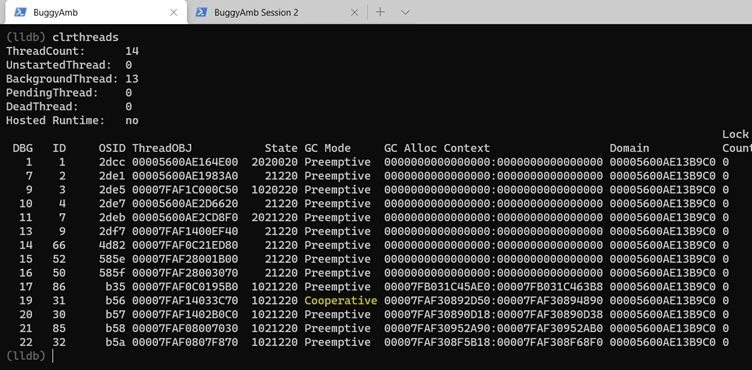
Run the clrthreads command to get a list of managed threads.
Note
One of the threads has the GC mode set to Cooperative, and the others are set to Preemptive.
If a thread's GC mode is set to Preemptive, this means that the GC can suspend this thread at any time. In contrast, the Cooperative mode means that the GC has to wait for the thread to switch to the Preemptive mode before you suspend it. When the thread is running managed code, it's in Cooperative mode.
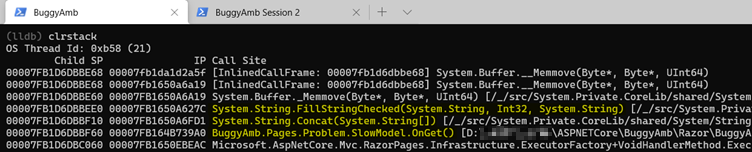
Start by examining the thread in Cooperative mode. The debugger's thread ID for the cooperative thread is 19 in the example list. The ID will differ when you repeat the exercise. Switch to the thread by running thread select 19, and then run clrstack to list the managed call stack. The "slow" page of the buggy application is doing a string concat operation.
This ought to make you suspicious because you should know that string concat operations are costly. This is because string objects in .NET are immutable, meaning that their values can't be changed after they're assigned. Consider this pseudo code snippet:
string myText = "Debugging";
myText = myText + " .NET Core";
myText = myText + " is awesome";
This code creates multiple strings in memory: Debugging, Debugging .NET Core, and Debugging .NET Core is awesome. Three different string objects have to be created to generate (concatenate) one final string. If this occurs frequently enough, it might create memory pressure so that the GC could be triggered.
This theory sounds promising. However, you should try to verify that it's correct. Before you look at the managed heap, and while you're already positioned on the thread context, inspect the objects that are referenced from this thread to try to determine what the string and string[] objects values are. Run dso, and focus on string and string arrays.
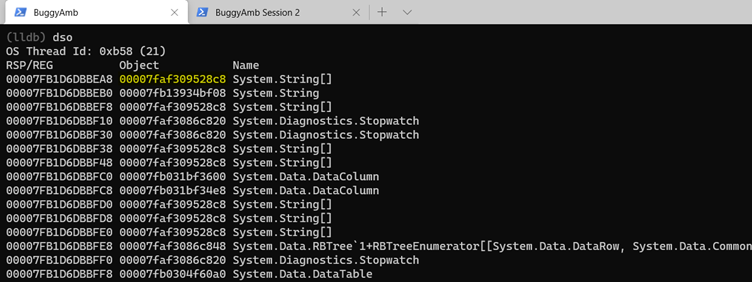
Try inspecting the string array. Run dumpobj by using the address of the object. However, be aware that this demonstrates only that the object in question is an array. SOS provides a dumparray command to investigate the arrays. Run dumparray 00007faf309528c8 to get the list of the items in the array. (Remember that the address of the array object will be different in the dump file that you're examining.)
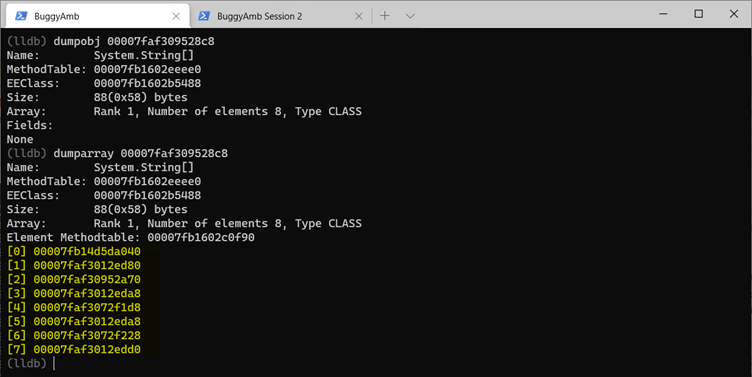
Run the dumpobj command again by using the resulting string addresses that are contained inside the array. Choose some of the addresses, and investigate them.
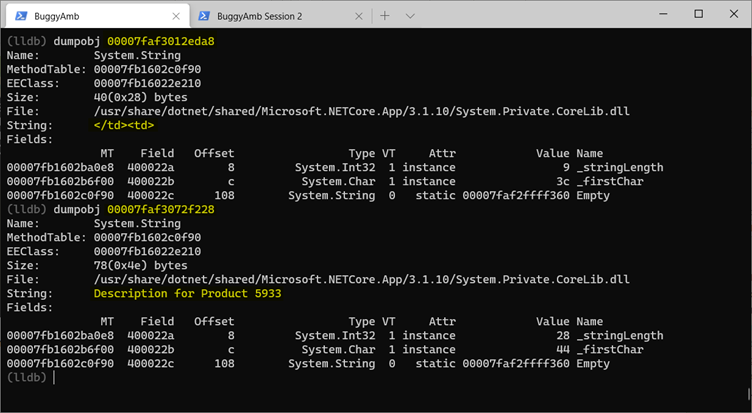
These strings resemble the strings that are in the product table that the page displays.
Notice that lldb (or SOS) might not show the string value if the strings are large. In such cases, one of your options is to use lldb's native commands to examine the native memory address. This is similar to using the d* commands (for example, dc) in WinDbg.
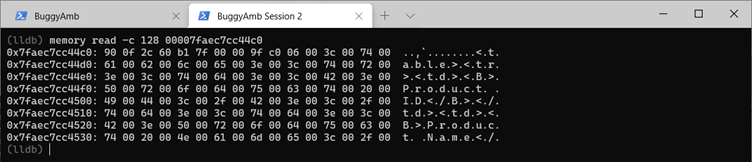
The following command reads the native memory at the given memory location, and shows the first 384 bytes. The list uses one of the string addresses to demonstrate it. The command that is being run is memory read -c 384 00007fb14d5da040.
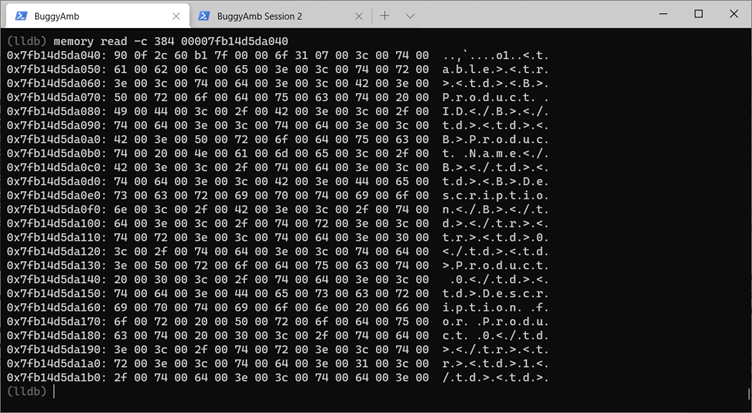
The number of strings that are referenced by the stack of the thread seems to confirm the theory that the string concat problem is causing the performance problem.
However, the investigation isn't yet finished. You have two memory dump files. Therefore, you'll compare the managed memory heap, and check how the heap changed in time.
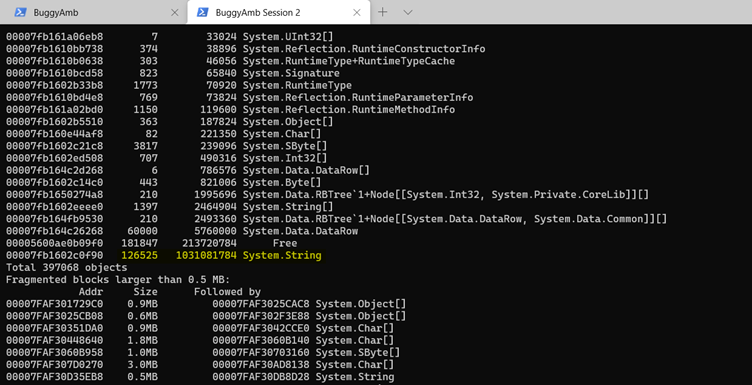
Run the dumpheap -stat command in each dump file. The following is from the first file. In the list below, there are 105,401 string objects, and the total size of the string objects is around 480 MB. Also notice that the memory is possibly fragmented, and the reason for the fragmentation seems to be related to the string array objects and System.Data.DataRow objects.

Continue by running the same dumpheap -stat command in the second dump file. You should see a change in the fragmentation stats, but that's not important within the context of this investigation. The important part is the number of string objects and the significant increase in size of these objects.
At the same time, the number of System.Data.DataRow objects also increases.
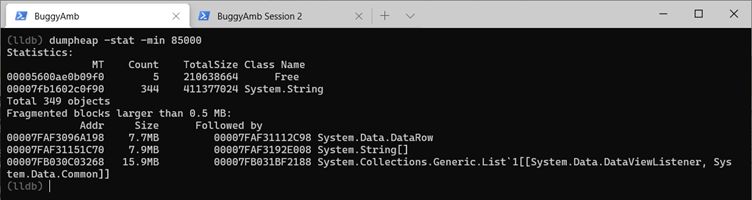
You might suspect that there's an issue that involves a Large Object Heap (LOH). You might, therefore, want to examine the LOH objects. In this case, you should run the dumpheap -stat -min 85000 commands. The following list contains the statistics of LOH for the first memory dump.
And here are the statistics of LOH for the second memory dump.
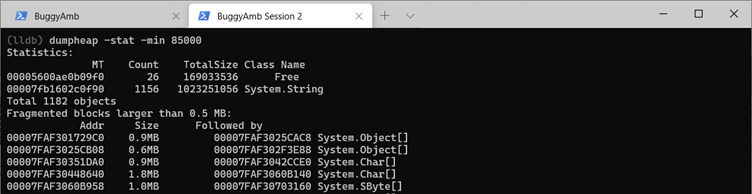
This also clearly shows the increase in the heap. All this seems to be related to the string objects.
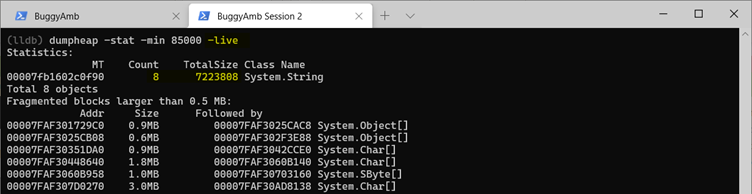
Finally, what if you were to pick one "live" object from LOH to find its root? "Live," in this case, means that the object is rooted somewhere and, therefore, is being actively used by the application so that the GC process won't delete it.
Handling this situation is easy. Run dumpheap -stat -min 85000 -live. This command displays only objects that are rooted somewhere. In this example, there are only right instances of string objects that are live in the LOH.
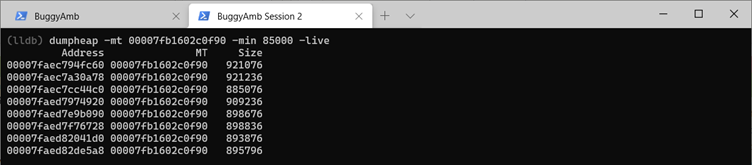
Use the MT address of the string object to get the list of the addresses of those live objects. Run dumpheap -mt 00007fb1602c0f90 -min 85000 -live.
Now, pick one address randomly from the resulting list. In the following screenshot, the third address in the list is displayed. You can try to examine the chosen address by running dumpobj. However, because this is a large object, the debugger won't display the value. So, instead, inspect the native memory address one more time, and you'll see that this is a string object that resembles what you can find in the list of the products table on the page that responds slowly.
Examine the root of the object that you listed. To do this, use the SOS gcroot command. This command simply takes the address of the object as a parameter in its simplest form. As you can see, this string is rooted to thread where the "slow" page is run. You should even see the source file name and line number information.
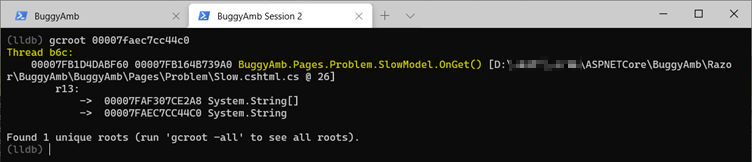
Note
Seeing the source file name and line number information depends on where you're troubleshooting and whether your symbols are correctly set. In the worst-case scenario, you can at least recover the thread ID. In the following list, b6c is a managed thread ID. If you run clrthreads, you can find the corresponding thread ID.
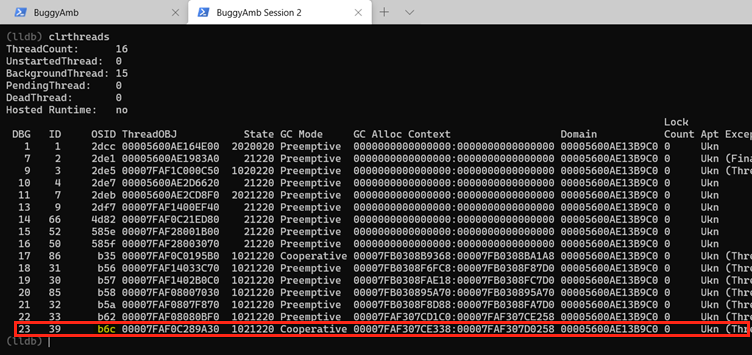
As shown in above screenshot, the debugger thread ID for the managed thread ID b6c is 23. Switch to thread 23, and check the managed call stack. As you saw previously, this thread should also be doing string concat operations.
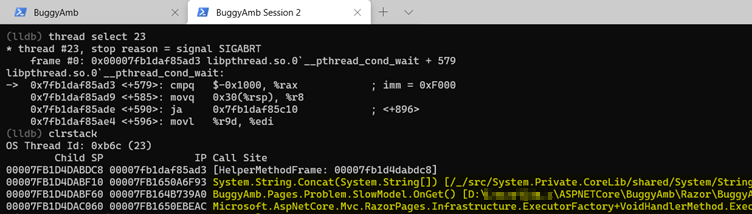
And if you examine at the native call stack by using the bt command, you might notice that the GC is allocating memory for this thread.
This evidence confirms the theory that the problem is related to a large number of string concatenation operations that create ever-larger strings that are triggered during the processing of a "slow" page.
The solution for such a problem isn't within the scope of this series. However, be aware that the solution is easy to implement by using a StringBuilder class instance instead of string concat operations.