Note
Access to this page requires authorization. You can try signing in or changing directories.
Access to this page requires authorization. You can try changing directories.
Summary
This article describes how to troubleshoot SQL Server memory problems, including out-of-memory and failure to allocate memory errors, low memory conditions, and related performance problems. It explains the symptoms, the three main categories of memory pressure (external, internal from non-engine modules, and internal from SQL Server engine components), the diagnostic tools you can use to collect data, and the steps you can take to fix or relieve memory pressure on a SQL Server instance.
Symptoms of low memory errors
SQL Server uses a complex memory architecture that corresponds to the complex and rich feature set. Because of the variety of memory needs, many sources can cause memory consumption and memory pressure, which can lead to out of memory conditions.
Common errors indicate low memory in SQL Server. Examples of these errors include:
- 701: Failure to allocate sufficient memory to run a query.
- 802: Failure to get memory to allocate pages in the buffer pool (data or index pages).
- 1204: Failure to allocate memory for locks.
- 6322: Failure to allocate memory for XML parser.
- 6513: Failure to initialize CLR due to memory pressure.
- 6533: AppDomain unloaded due to out of memory.
- 8318: Failure to load SQL performance counters due to insufficient memory.
- 8356 or 8359: ETW or SQL trace fails to run due to low memory.
- 8556: Failure to load MSDTC due to insufficient memory.
- 8645: Failure to run a query due to no memory for memory grants (sorting and hashing).
- 8902: Failure to allocate memory during DBCC execution.
- 9695 or 9696: Failure to allocate memory for Service Broker operations.
- 17131 or 17132: Server startup failure due to insufficient memory.
- 17890: Failure to allocate memory due to SQL memory being paged out by the OS.
- 18053: The error is printed in terse mode because there was an error during formatting. Tracing, ETW, and notifications are skipped.
- 22986 or 22987: Change data capture failures due to insufficient memory.
- 25601: Xevent engine is out of memory.
- 26053: SQL network interfaces fail to initialize due to insufficient memory.
- 30085, 30086, 30094: SQL full-text operations fail due to insufficient memory.
Cause of low memory issues
Many factors can cause insufficient memory. Such factors include operating system settings, physical memory availability, components that use memory inside SQL Server, and memory limits on the current workload. In most cases, the query that fails with an out-of-memory error isn't the cause of the error. You can group the causes into three categories.
External or OS memory pressure
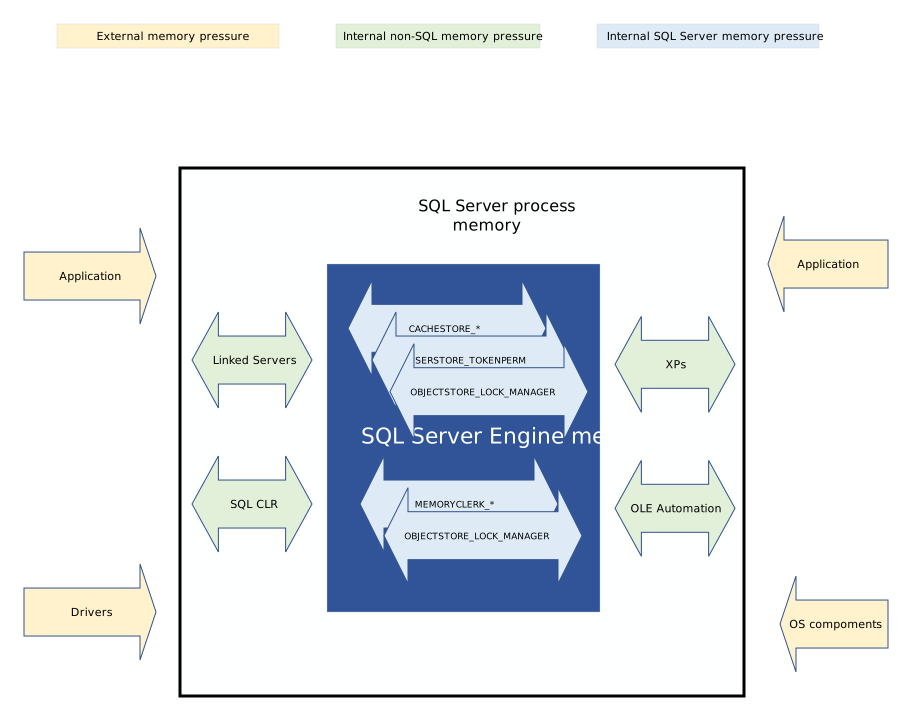
External pressure refers to high memory utilization from a component outside the SQL Server process that leads to insufficient memory for SQL Server. Check whether other applications on the system are consuming memory and contributing to low memory availability. SQL Server is one of the few applications designed to respond to OS memory pressure by reducing its memory use. If an application or driver requests memory, the OS sends a signal to all applications to free up memory, and SQL Server responds by reducing its own memory usage. Few other applications respond because they're not designed to listen for that notification. When SQL Server reduces its memory usage, its memory pool shrinks, and components that need memory might not get it. As a result, you start getting 701 or other memory-related errors. For more information on how SQL Server dynamically allocates and frees memory, see SQL Server memory architecture. For detailed diagnostics and solutions, see External memory pressure in this article.
Three broad categories of problems can cause OS memory pressure:
- Application-related issues: One or more applications together exhaust the available physical memory. The OS responds to new application requests for resources by trying to free some memory. Find which applications are exhausting memory and take steps to balance memory among them without exhausting RAM.
- Device driver issues: Device drivers can cause working set paging of all processes if a driver incorrectly calls a memory allocation function.
- Operating system product issues.
For a detailed explanation and troubleshooting steps, see MSSQLSERVER_17890.
Internal memory pressure from non-engine modules
Internal memory pressure refers to low memory availability caused by factors inside the SQL Server process. Some components that run inside the SQL Server process are external to the SQL Server engine. Examples include OLE DB providers (DLLs) like linked servers, SQLCLR procedures or functions, extended procedures (XPs), and OLE Automation (sp_OA*). Others include antivirus or security programs that inject DLLs into the process for monitoring purposes. An issue or poor design in any of these components can lead to large memory consumption. For example, consider a linked server caching 20 million rows of data from an external source into SQL Server memory. From the engine's perspective, no memory clerk reports high memory usage, but memory consumed inside the SQL Server process is high. This memory growth from a linked server DLL causes SQL Server to start reducing its memory usage and creates low memory conditions for engine components, which leads to out-of-memory errors. For detailed diagnostics and solutions, see Internal memory pressure from non-engine modules.
Note
A few Microsoft DLLs used in the SQL Server process space (for example, MSOLEDBSQL and SQL Server Native Client) can interface with the SQL Server memory infrastructure for reporting and allocation. Run SELECT * FROM sys.dm_os_memory_clerks WHERE type='MEMORYCLERK_HOST' to get a list of them and track memory consumption for some of their allocations. SQL Server Native Client (SNAC) is deprecated; new development should use MSOLEDBSQL or the Microsoft ODBC Driver for SQL Server.
Internal memory pressure from SQL Server engine components
Internal memory pressure from components inside the SQL Server engine can also lead to out-of-memory errors. Hundreds of components tracked via memory clerks allocate memory in SQL Server. Identify which memory clerks are responsible for the largest allocations to fix the issue. For example, if the OBJECTSTORE_LOCK_MANAGER memory clerk shows a large allocation, find out why the Lock Manager is consuming so much memory. You might find queries that acquire many locks. Optimize these queries by using indexes, by shortening transactions that hold locks for a long time, or by checking whether lock escalation is disabled. Each memory clerk or component has a unique way of using memory. For more information, see sys.dm_os_memory_clerks and the memory clerk type descriptions. For detailed diagnostics and solutions, see Internal memory usage by the SQL Server engine.
Memory pressure types
The following graph illustrates the types of pressure that can lead to out of memory conditions in SQL Server:
Diagnostic tools to troubleshoot memory issues
Use the following diagnostic tools to collect troubleshooting data.
Performance Monitor
Set up and collect the following counters by using Performance Monitor:
- Memory:Available MBytes
- Process:Working Set
- Process:Private Bytes
- SQL Server:Memory Manager: (all counters)
- SQL Server:Buffer Manager: (all counters)
DMVs and DBCC MEMORYSTATUS
Use sys.dm_os_memory_clerks or DBCC MEMORYSTATUS to observe overall memory usage inside SQL Server. sys.dm_os_memory_clerks returns one row per memory clerk and is the best starting point to find which components consume the most memory. DBCC MEMORYSTATUS returns a more detailed snapshot that groups information by memory manager, buffer pool, and clerks.
Memory Consumption report in SSMS
To view memory usage in SQL Server Management Studio (SSMS):
- Open SSMS and connect to a server.
- In Object Explorer, select and hold (or right-click) the SQL Server instance name.
- In the context menu, select Reports > Standard Reports > Memory Consumption.
PSSDiag or SQL LogScout
To automatically capture these data points, use a tool like PSSDiag or SQL LogScout.
- If you use PSSDiag, set it up to capture the Perfmon collector and the Custom Diagnostics\SQL Memory Error collector.
- If you use SQL LogScout, set it up to capture the Memory scenario.
Quick relief to free memory
The following actions might free some memory and make it available to SQL Server. Use them as short-term relief while you investigate the root cause.
Change memory configuration
Check the following SQL Server memory configuration parameters and consider increasing max server memory if possible:
- max server memory
- min server memory
Note
If you notice unusual settings, correct them as needed and account for increased memory requirements. Default settings are listed in Server memory configuration options.
If you didn't set max server memory, especially with Lock Pages in Memory enabled, set it to a specific value to leave memory for the OS. For more information, see the Lock pages in memory (LPIM) server configuration option.
Change or move the workload
Review the query workload, including the number of concurrent sessions and currently running queries. Check whether you can stop less critical applications temporarily or move them to another SQL Server instance.
For read-only workloads, consider moving them to a read-only secondary replica in an Always On environment. For more information, see Offload read-only workload to secondary replica of an Always On availability group and Configure read-only access to a secondary replica of an Always On availability group.
Check virtual machine memory configuration
If you're running SQL Server on a virtual machine (VM), make sure the host doesn't overcommit the VM's memory. For guidance on sizing memory for SQL Server on Azure VMs, see Memory best practices for SQL Server on Azure Virtual Machines. For VMware-hosted VMs, see your hypervisor vendor's documentation on detecting and avoiding memory overcommitment.
Release memory inside SQL Server
Run one or more of the following DBCC commands to free SQL Server memory caches. Use these commands with caution on production systems because they clear caches that have to be repopulated:
DBCC FREESYSTEMCACHEDBCC FREESESSIONCACHEDBCC FREEPROCCACHE
Restart the SQL Server service
If memory exhaustion is critical and SQL Server can't process queries, you can restart the service as a last resort. This action drops all active connections and clears caches, so use it only when other options fail.
Review Resource Governor settings
If you use Resource Governor, check the resource pool and workload group settings to make sure they don't limit memory too drastically. For more information, see Resource Governor.
Add more RAM
If the problem continues after the previous steps, investigate further and consider increasing server resources (RAM) on the physical or virtual server.
Diagnose and fix memory pressure
If an out-of-memory error appears only occasionally or for a brief period, the issue might be short-lived and self-resolving, and no action might be needed. If the error occurs multiple times across multiple connections and persists for seconds or longer, follow the diagnostics and solutions in the following sections to identify and address the root cause.
External memory pressure
To diagnose low memory conditions on the system outside of the SQL Server process, use the following methods:
Collect Performance Monitor counters. Check whether applications or services other than SQL Server are consuming memory on this server by looking at these counters:
- Memory:Available MBytes
- Process:Working Set
- Process:Private Bytes
Here's an example of Perfmon log collection using PowerShell:
clear
$serverName = $env:COMPUTERNAME
$Counters = @(
   ("\\$serverName" +"\Memory\Available MBytes"),
   ("\\$serverName" +"\Process(*)\Working Set"),
   ("\\$serverName" +"\Process(*)\Private Bytes")
)

Get-Counter -Counter $Counters -SampleInterval 2 -MaxSamples 1 | ForEach-Object  {
$_.CounterSamples | ForEach-Object   {
   [pscustomobject]@{
      TimeStamp = $_.TimeStamp
      Path = $_.Path
      Value = ([Math]::Round($_.CookedValue, 3)) }
}
}
Review the System event log and look for memory-related errors (for example, low virtual memory).
Review the Application event log for application-related memory issues.
Here's an example PowerShell script that queries the System and Application event logs for the keyword "memory." You can use other strings like "resource" for your search:
Get-EventLog System -ComputerName "$env:COMPUTERNAME" -Message "*memory*"
Get-EventLog Application -ComputerName "$env:COMPUTERNAME" -Message "*memory*"
Fix any code or configuration issues for less critical applications or services to reduce their memory usage.
If applications besides SQL Server are consuming resources, try stopping or rescheduling them, or run them on a separate server. These steps remove external memory pressure.
Internal memory pressure from non-engine modules
To diagnose internal memory pressure caused by modules (DLLs) inside SQL Server, use the following methods:
If SQL Server doesn't use Lock Pages in Memory (AWE API), most of its memory usage appears in the Process:Private Bytes counter (
sqlservrinstance) in Performance Monitor. The SQL Server:Memory Manager: Total Server Memory (KB) counter shows overall memory usage from within the SQL Server engine. If you find a significant difference between Process:Private Bytes and SQL Server:Memory Manager: Total Server Memory (KB), that difference likely comes from a DLL (linked server, XP, SQLCLR, and so on). For example, if Private Bytes is 300 GB and Total Server Memory is 250 GB, approximately 50 GB of the overall memory in the process comes from outside the SQL Server engine.If SQL Server uses Lock Pages in Memory (AWE API), it's harder to identify the issue because Performance Monitor doesn't offer AWE counters that track memory usage for individual processes. The SQL Server:Memory Manager: Total Server Memory (KB) counter shows overall memory usage within the SQL Server engine. Typical Process:Private Bytes values can vary between 300 MB and 1-2 GB overall. If Process:Private Bytes is significantly higher than this typical range, the difference likely comes from a DLL (linked server, XP, SQLCLR, and so on). For example, if Private Bytes is 4-5 GB and SQL Server uses Lock Pages in Memory (AWE), a large part of Private Bytes might come from outside the SQL Server engine. This value is an approximation.
Use the
tasklistutility to identify DLLs loaded inside the SQL Server process.tasklist /M /FI "IMAGENAME eq sqlservr.exe"You can also use the following query to examine loaded modules (DLLs) and check whether anything unexpected is present:
SELECT * FROM sys.dm_os_loaded_modulesIf you suspect a linked server module is causing significant memory consumption, set it up to run out of process by clearing the Allow inprocess option. For more information, see Create linked servers. Not all linked server OLE DB providers can run out of process. For more information, contact the provider manufacturer.
In the rare case where OLE Automation objects (
sp_OA*) are used, you can set up the object to run in a process outside SQL Server by specifying a context value of 4 (Local (.exe) OLE server only). For more information, seesp_OACreate.
Internal memory usage by the SQL Server engine
To diagnose internal memory pressure from components inside the SQL Server engine, use the following methods:
Start collecting Performance Monitor counters for SQL Server: SQL Server:Buffer Manager and SQL Server:Memory Manager.
Query the SQL Server memory clerks DMV multiple times to see where the highest consumption of memory occurs inside the engine.
SELECT pages_kb, type, name, virtual_memory_committed_kb, awe_allocated_kb
FROM sys.dm_os_memory_clerks
ORDER BY pages_kb DESC
Alternatively, observe the more detailed
DBCC MEMORYSTATUSoutput and how it changes when you see these error messages.DBCC MEMORYSTATUSIf you identify a clear offender among the memory clerks, focus on the specifics of memory consumption for that component. Here are several examples:
- If the
MEMORYCLERK_SQLQERESERVATIONSmemory clerk is consuming memory, identify queries that use large memory grants and optimize them by using indexes, by rewriting them (for example, removingORDER BY), or by applying memory grant query hints (MIN_GRANT_PERCENTandMAX_GRANT_PERCENT). For more information, see Query hints. You can also create a resource pool to control memory grant usage. For more information about memory grants, see Troubleshoot slow performance or low memory issues caused by memory grants in SQL Server. - If many ad hoc query plans are cached, the
CACHESTORE_SQLCPmemory clerk uses large amounts of memory. Identify nonparameterized queries whose plans can't be reused and parameterize them by converting them to stored procedures, by usingsp_executesql, or by usingFORCEDparameterization. If trace flag 174 is enabled, you can disable it to see whether that fixes the problem. - If the object plan cache store
CACHESTORE_OBJCPconsumes too much memory, identify which stored procedures, functions, or triggers use large amounts of memory and consider redesigning the application. This commonly happens with many databases or schemas that each contain hundreds of procedures. - If the
OBJECTSTORE_LOCK_MANAGERmemory clerk shows large allocations, identify queries that take many locks and optimize them by using indexes. Shorten transactions that hold locks for long periods in certain isolation levels, or check whether lock escalation is disabled. - If you observe a very large
TokenAndPermUserStore(SELECT type, name, pages_kb FROM sys.dm_os_memory_clerks WHERE name = 'TokenAndPermUserStore'), you can use trace flag 4618 to limit the cache size. - If you observe memory issues with In-Memory OLTP from the
MEMORYCLERK_XTPmemory clerk, see Monitor and troubleshoot memory usage for In-Memory OLTP and Memory-optimized tempdb metadata (HkTempDB) out of memory errors.
- If the
Frequently asked questions
Why does SQL Server use almost all the RAM on the server?
By design, the SQL Server buffer pool grows to cache data pages and reduce physical I/O, so steady-state memory use commonly approaches the max server memory setting. This behavior is expected and isn't a leak. To cap consumption and leave headroom for the OS and other processes, configure max server memory. For details, see Server memory configuration options.
What's the difference between max server memory and the committed memory shown in Task Manager?
The max server memory setting caps the memory that the SQL Server buffer pool and most memory clerks inside the engine can commit. Task Manager shows the committed memory for the entire sqlservr.exe process. This view includes allocations that components make outside the buffer pool, such as CLR, linked server providers, extended stored procedures, and backup buffers. As a result, total process memory can exceed max server memory. For more information, see Memory management architecture guide.
When should I enable Lock Pages in Memory (LPIM)?
Enable Lock Pages in Memory when the OS trims SQL Server's working set. This problem surfaces as error 17890 or sudden drops in Total Server Memory. Pair LPIM with an explicit max server memory value to leave RAM for the OS and other processes. Don't enable LPIM by default on every instance. Use it to address a confirmed paging problem.
What does sys.dm_os_memory_clerks tell me?
sys.dm_os_memory_clerks returns one row for each active memory clerk inside the SQL Server engine, with the amount of memory the clerk commits. Use it to find which component (for example, buffer pool, plan cache, lock manager, or query memory grants) consumes the most memory and to direct your tuning effort.