Note
Access to this page requires authorization. You can try signing in or changing directories.
Access to this page requires authorization. You can try changing directories.
Visual Studio improves debugging Unreal Engine projects by showing information about Unreal Engine Blueprints in the call stack and local variables windows. This feature lets you debug Blueprint code alongside your C++ code in one debugging session. With this functionality, you can easily track interactions between Blueprints and C++ code, making it easier to find and fix bugs.
Blueprints are a visual scripting technology in Unreal Engine used for rapid prototyping and development. Blueprints can call C++ code. In many cases, games are originally designed as Blueprints and later converted to C++ to improve performance. If you spend time converting Blueprints to C++, this new debugging functionality lets you analyze Blueprints and C++ code together. Which reduces the need to switch between Visual Studio and the Unreal Editor and provides a seamless debugging experience with less context-switching.
Visual Studio Blueprint debugger support provides:
- Unified debugging experience: Debug Blueprints and C++ code in the same session.
- Integrated call stack: Blueprint frames appear in the same call stack as C++ frames.
- Variable inspection: View Blueprint node pins and their values in the local variables window.
- Breakpoint support: Set breakpoints in C++ code called by Blueprints. This is useful when you have multiple Blueprints that can call C++ code, but you aren't sure which ones do and why.
Prerequisites
- Unreal Engine installed along with debug symbols.
- Visual Studio 2022 17.14 or later with the Game development with C++ workload installed.
- Visual Studio Tools for Unreal Engine installed into Visual Studio.
- Visual Studio debugger tools for Unreal Engine Blueprints installed into Visual Studio.
- Unreal Engine plugin for Visual Studio installed into Unreal Engine.
Install prerequisites
Run the Visual Studio Installer to install the required components to debug Unreal Engine Blueprints. For more information about installing Visual Studio Tools for Unreal Engine, see Get started with Visual Studio Tools for Unreal Engine.
On the Workloads pane, make sure the Game development with C++ workload is installed, along with Visual Studio debugger tools for Unreal Engine Blueprints and Visual Studio Tools for Unreal Engine:

Install Unreal Engine debug symbols
Install debug symbols for each version of Unreal Engine you debug with Visual Studio:
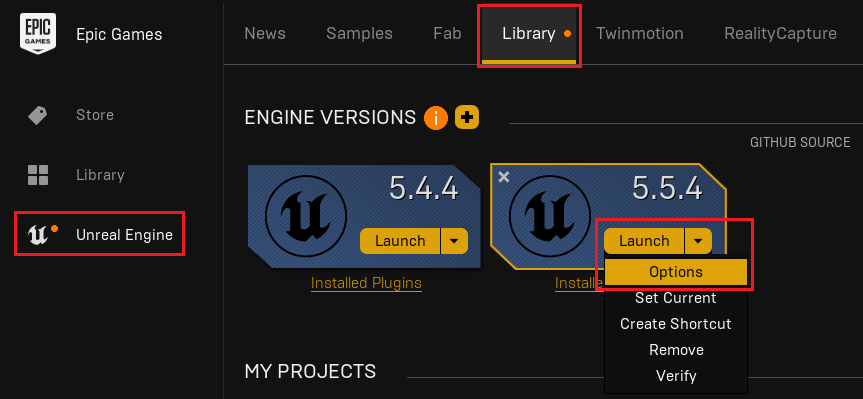
Open the Epic Games Launcher.
Select the Unreal Engine pane and then the Library pane.
Select the dropdown menu for your engine version, then choose Options:
In the options dialog, select Editor symbols for debugging:
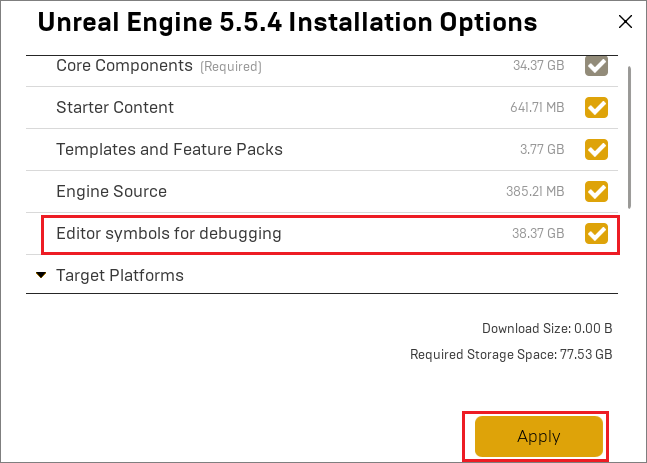
Select Apply, then wait for the download to finish.
Install Unreal Engine plugin for Visual Studio
The Unreal Engine plugin for Visual Studio installs into Unreal Engine. Once installed, it's automatically activated when you open an Unreal Engine project in Visual Studio. This plugin provides integration between Unreal Engine and Visual Studio to support viewing Blueprint node pin values in the Visual Studio debugger local variables window.
For manual installation instructions, see Unreal Engine plugin for Visual Studio.
If you have an Unreal Engine project that you can open in Visual Studio, another way to install the plugin is in Visual Studio via the Unreal Engine Configuration window:
- With an Unreal Engine project opened in Visual Studio, select Project > Configure Tools for Unreal Engine to open the Unreal Engine Integration Configuration window.
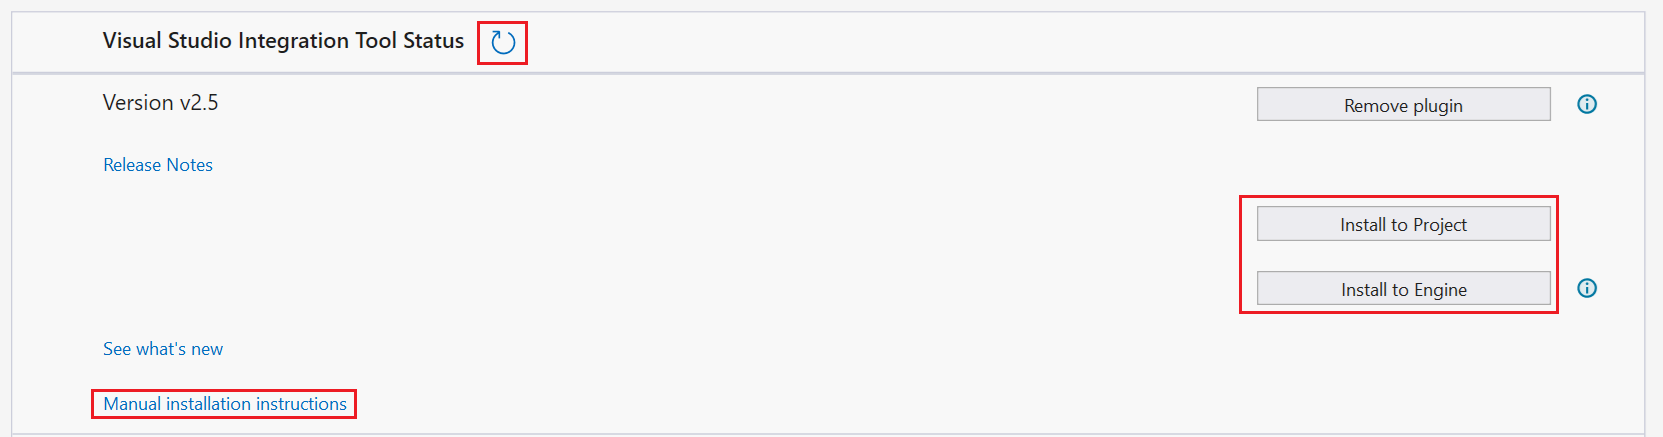
- In the Visual Studio Integration Tool Status section, select Install to Project or Install to Engine as meets your needs.
If you don't see the install buttons, choose the refresh icon to refresh the status. If you need to install the plugin manually, select the Manual installation instructions link to open the Unreal Engine plugin for Visual Studio page, which contains installation instructions.
Set up a test project
To test the Blueprint debugger functionality, create a project that contains Blueprints and C++ code. The Unreal Engine First Person template works well.
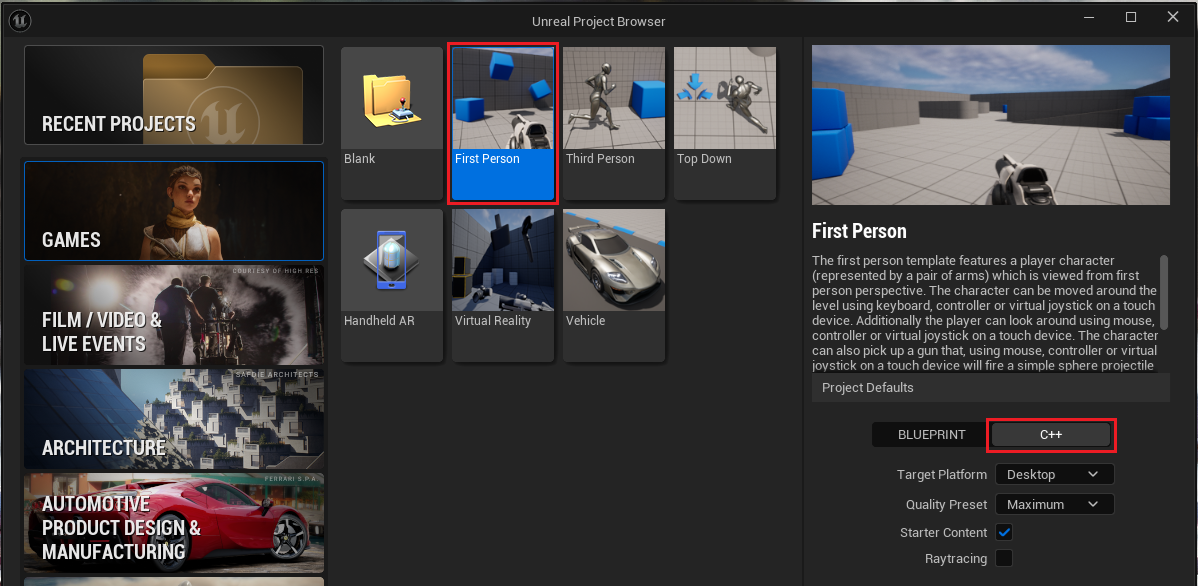
Open the Unreal Engine Editor and create a new First Person project.
Ensure that C++ is selected:
After creating the project, close all Unreal Editor instances.
In Visual Studio, open the generated Visual Studio solution file (.sln).
Debug Blueprints
Follow these steps to set a breakpoint, inspect a Blueprint function, and view its node pin values:
In Visual Studio, locate the
AttachWeaponmethod in the weapon component class. For example, if you named your projectFirstPerson, the function would be in the fileFirstPersonWeaponComponent.cpp.Add a breakpoint at the start of the
AttachWeaponmethod. This method is called when the player picks up a weapon in the game: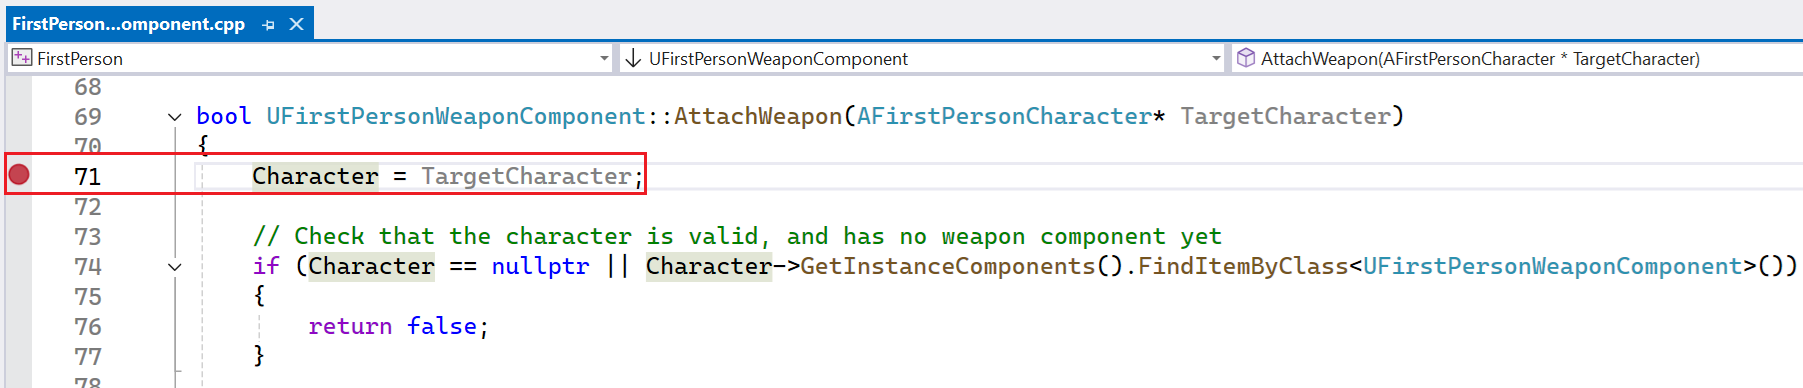
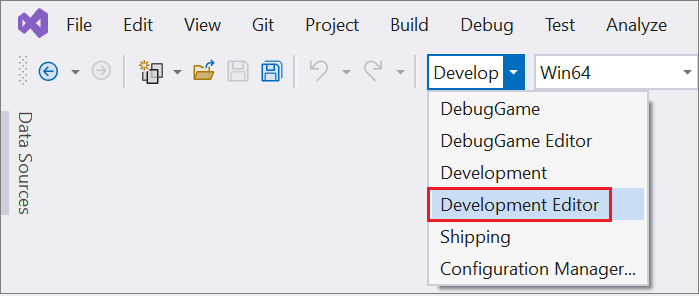
In the Visual Studio Solution Configuration dropdown, select Development Editor:
In Visual Studio, compile and run the project to open the Unreal Editor.
In the Unreal Editor, select the green Play button to start the game.
In the running game, press the W key to move forward until you collide with the weapon and trigger the breakpoint.
When the breakpoint is hit, examine the Call stack window. Blueprint stack frames appear among your C++ stack frames:
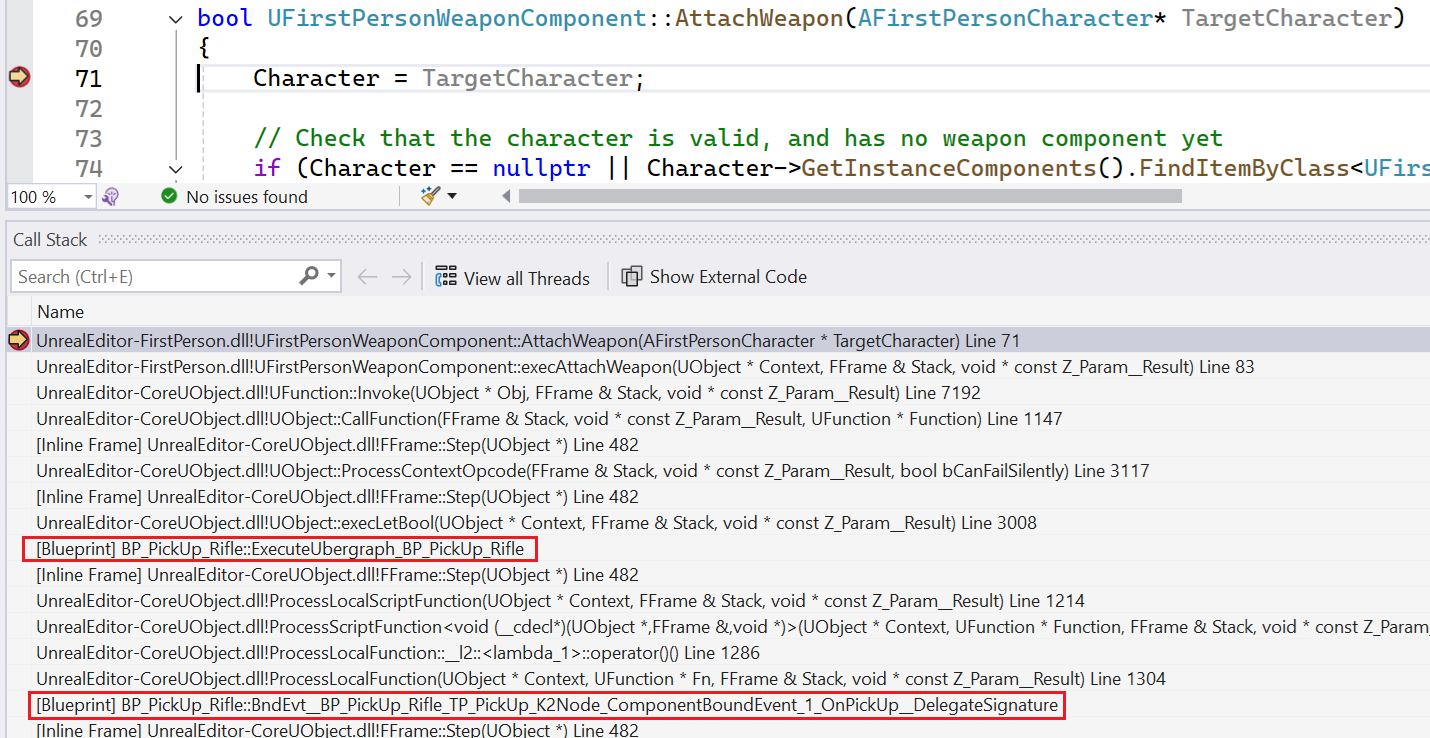
Double-click the first Blueprint frame in the call stack.
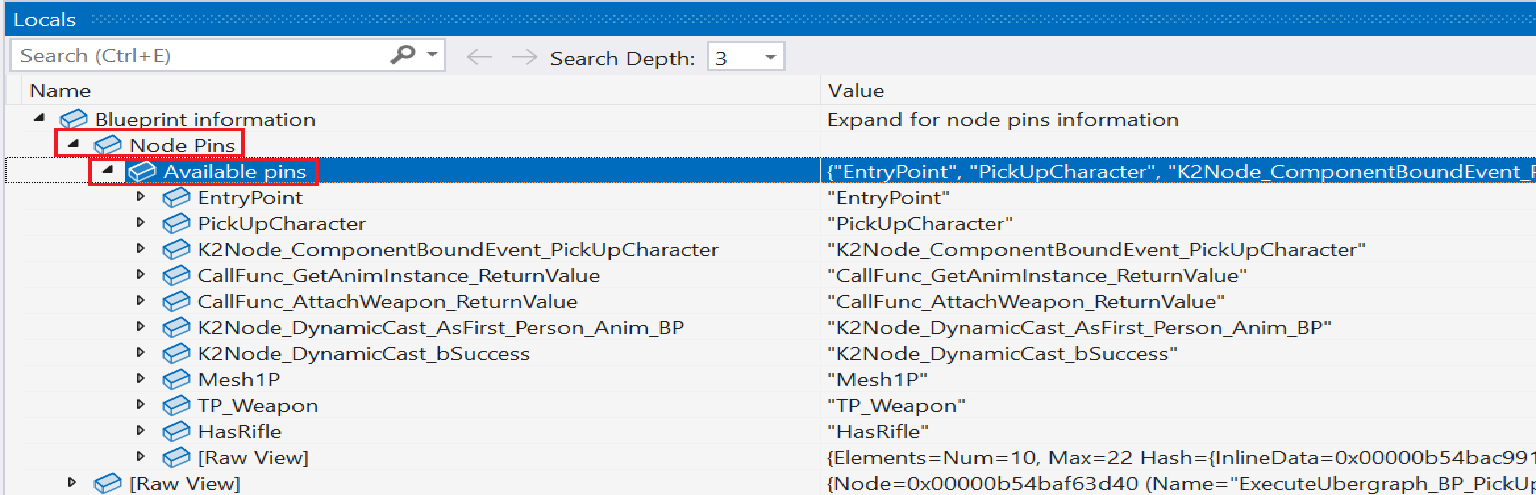
Open the Locals window to view the variables associated with the Blueprint node. You can see the values of the Blueprint node pins:


Summary
The Visual Studio Blueprint debugger provides a seamless debugging experience that bridges the gap between C++ and Blueprint code in Unreal Engine projects. This integrated approach allows you to:
- Track execution flow from C++ to Blueprints and back.
- Inspect Blueprint node pin values and C++ variables.
- Step through Blueprint execution frames in the same debugging session as C++ code.
This unified debugging experience helps resolve issues efficiently across both coding paradigms, eliminating the need to switch between different debugging tools.