Note
Access to this page requires authorization. You can try signing in or changing directories.
Access to this page requires authorization. You can try changing directories.
A good way to start investigating performance issues in your app is to understand its CPU utilization using a CPU profiler. Visual Studio's CPU Usage performance tool shows the CPU active computation time and percentage spent executing code in C++, C#/Visual Basic.
The CPU Usage tool can help you:
Diagnose a slow-down or a process hang in your team’s codebase. The tool can help you diagnose the issue with your team’s production code. It provides automatic insights and various views of your data so that you can analyze and diagnose performance issues.
Identify performance issues in DevOps scenarios For example, the tool can help when a customer reports that some requests or orders are not getting through to the retail website during peak season. Often, the issues are in production, and it is challenging to debug at that moment, but this tool can help you capture enough information and evidence of the issue. After collecting a trace file, the analysis can quickly help you understand potential causes and give suggestions within the context of your code so that you can take the next steps to fix the issue.
Check for high CPU utilization If your latency issue isn’t within an API request, then you can check for high CPU utilization and other related issues with the CPU Usage tool. The CPU Usage tool can help you identify bottlenecks so that you can narrow down where to optimize.
The CPU Usage tool is helpful for both local trace sessions and production. You can run the CPU Usage tool by using the keyboard shortcut, Alt+F2, and then choosing CPU Usage, or by opening an already collected trace using a tool like dotnet-trace or dotnet-monitor. (For .NET production code, this is most likely how you would collect traces.)
You can run the CPU Usage tool on an open Visual Studio project, on an installed Microsoft Store app, or attached to a running app or process. You can run the CPU Usage tool on release or debug builds. For more information, see Run profiling tools on release or debug builds.
The following instructions show how to use the CPU Usage tool without the debugger, using the Visual Studio Performance Profiler. The examples use a Release build on a local machine. Release builds provide the best view of actual app performance. For a tutorial that shows how to improve performance using the CPU Usage tool, see Case study: Beginner's guide to optimizing code.
Usually, the local machine best replicates installed app execution. To collect data from a remote device, run the app directly on the device, not over a Remote Desktop Connection.
Collect CPU utilization data
In the Visual Studio project, set the solution configuration to Release and select the deployment target.
The deployment target typically matches the project name, indicating a local deployment.
The deployment target is typically Local Windows Debugger (or Local Machine).


Select Debug > Performance Profiler.
Under Available tools, select CPU Usage, and then select Start.
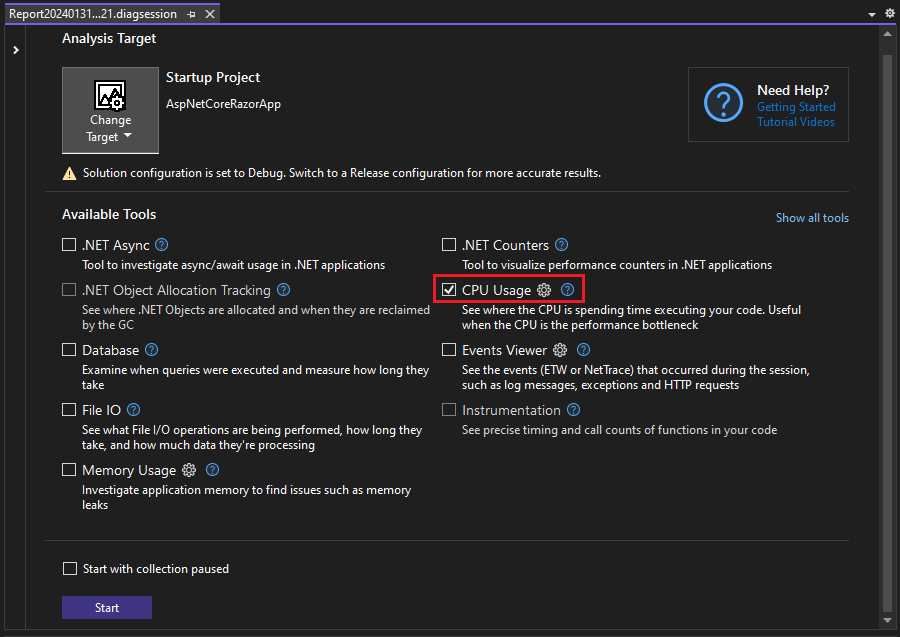

If you enable the Start with collection paused option before starting the profiler, data will not be collected until you select the Record button in the diagnostic session view.
Note
For some project types, such as CMake, you must set the startup target to Executable. For more information, see Which tools are supported for my project?. For more information on how to make the tool more efficient, see Optimizing Profiler settings.
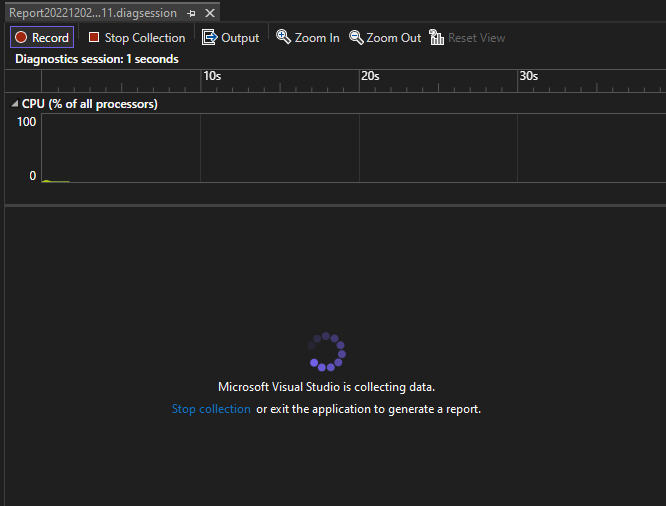
After the app starts, the diagnostic session begins and displays CPU utilization data. When you're finished collecting data, select Stop Collection.

The CPU Usage tool analyzes the data and displays the report. If you have trouble collecting or displaying data, see Troubleshoot profiling errors and fix issues.
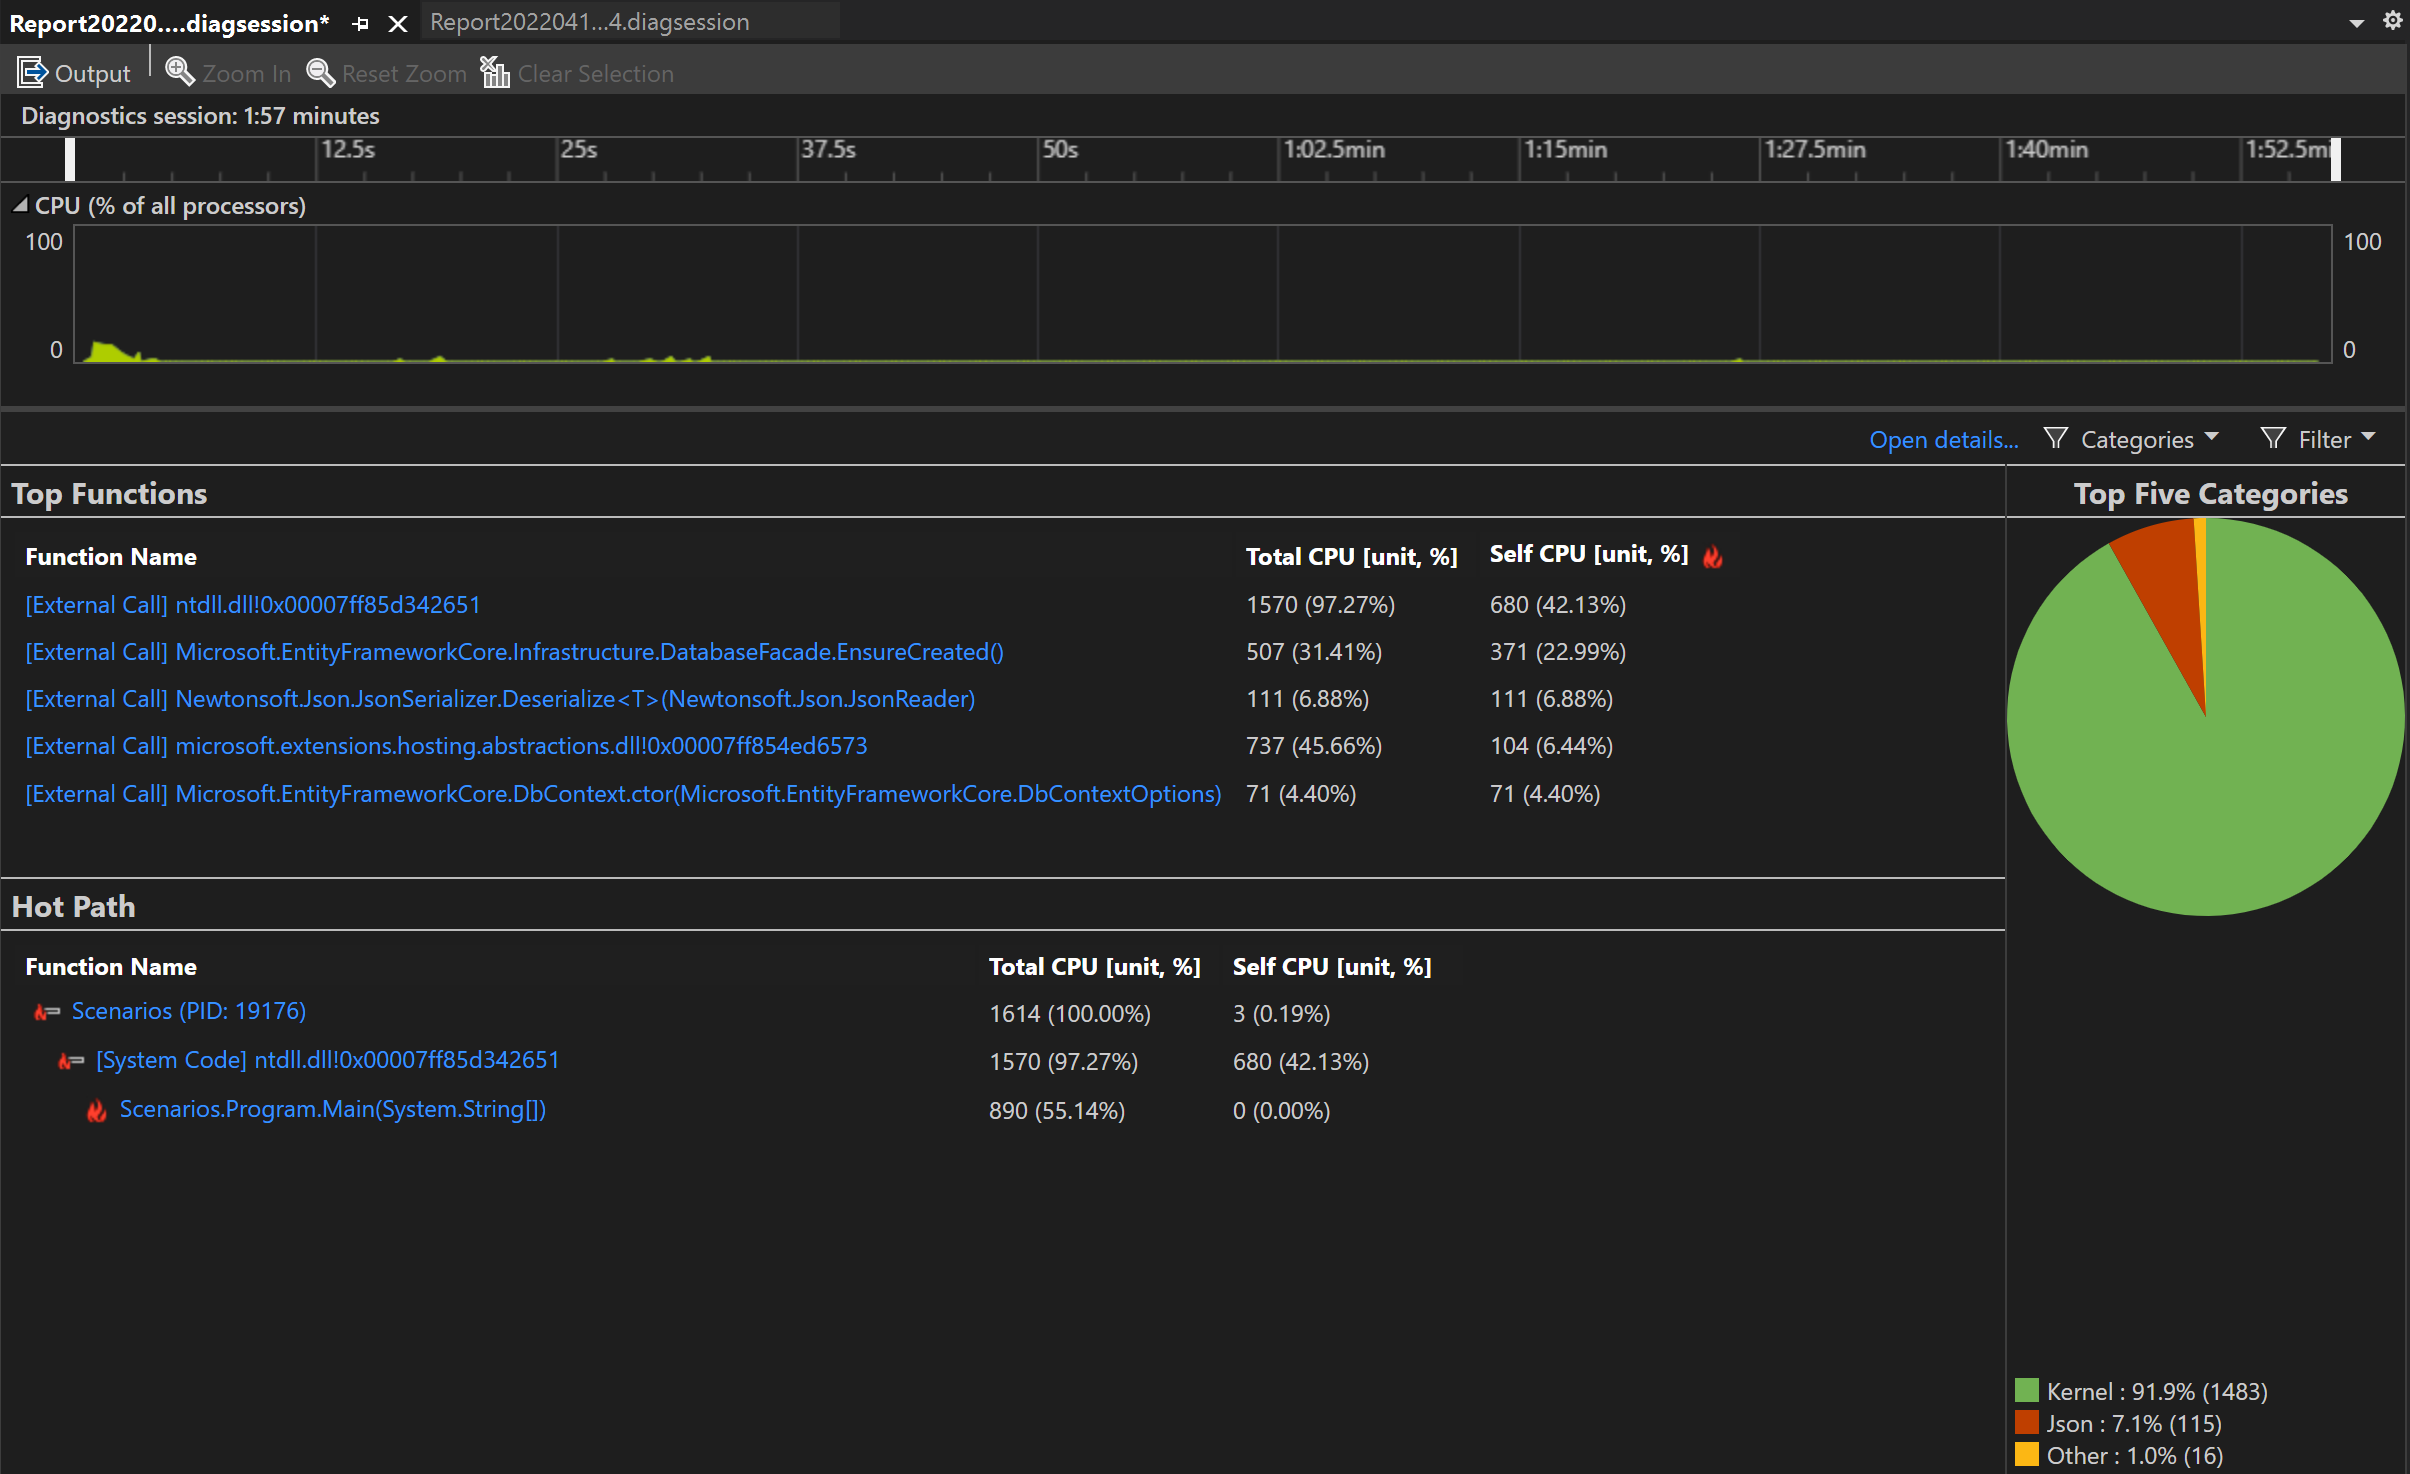

Use the Filter dropdown to select or deselect threads to display, and use the Search box to search for a specific thread or node.
CPU utilization data columns
| Name | Description |
|---|---|
| Total CPU [unit, %] |  The milliseconds of CPU computation time and the CPU percentage used by calls to the function, and functions called by the function, in the selected time range. This is different from the CPU Utilization timeline graph, which compares the total CPU activity in a time range to the total available CPU. |
| Self CPU [unit, %] |  The milliseconds of CPU computation time and the CPU percentage used by calls to the function in the selected time range, excluding functions called by the function. |
| Module | In some views, the Module column is shown, which shows the name of the module containing the function. |
Analyze CPU insights
If any insights show up in the Top Insights section, use the provided link to get more information about the issue identified. In addition, if you are using Copilot, the Ask Copilot button will open the Copilot chat window, and Copilot will provide suggestions based on your code and any identified issues.
For more information, see CPU insights.
Analyze CPU utilization
For in-depth analysis of the CPU Usage report, first open one of the detailed report views:
Click Open details in the summary page of the report, or select one of the top functions to open the Functions view.

From the Current View list, you can select one of the detailed report views.

The following table provides a description of the detailed views.
| View | Description |
|---|---|
| Caller/callee | Detailed view of CPU time for a specific function, the function(s) that called it, and the function(s) that it calls. The performance data is aggregated for the data collection period. You can select calling functions and called functions to traverse the call path. |
| Call tree | Hierarchical view of the function call path. Used to identify call paths that are taking the most CPU time (hot path). |
| Modules | View of the CPU time spent in individual modules, aggregated over the data collection period. Used to identify modules that might be performance bottlenecks due to a combination of high call counts and/or performance issues. |
| Functions | View of the CPU time spent in individual functions, aggregated over the data collection period. Used to identify functions that might be performance bottlenecks due to a combination of high call counts and/or performance issues. |
| Flame graph | Hierarchical view of the function call path in a flame graph visualization. Used to identify call paths that are taking the most CPU time (hot path). |
To analyze the report, click Create detailed report.
The report provides different views of the diagnostic data:
- Caller/callee
- Call tree
In all views except Caller/callee, the diagnostic report is sorted by Total CPU, from highest to lowest. Change the sort order or sort column by selecting the column headers. You can double-click on a function that you are interested in, and you will see the source for the function as well as highlighting that shows where time is spent in that function. The table shows columns with data such as the time spent in the function, including called functions (Total CPU), and a second column that shows the time spent in a function, excluding called functions (Self CPU).
This data can help you assess whether the function itself is a performance bottleneck. Determine how much data the method is displaying to see if third-party code or runtime libraries are the reason for your endpoints being slow or resource-consumption heavy.
For more information on using the Flame graph, see Identify hot paths with Flame Graph.
CPU Usage call tree
To view the call tree, select the parent node in the report. By default, the CPU Usage page opens to the Caller/Callee view. In the Current View dropdown, select Call Tree.
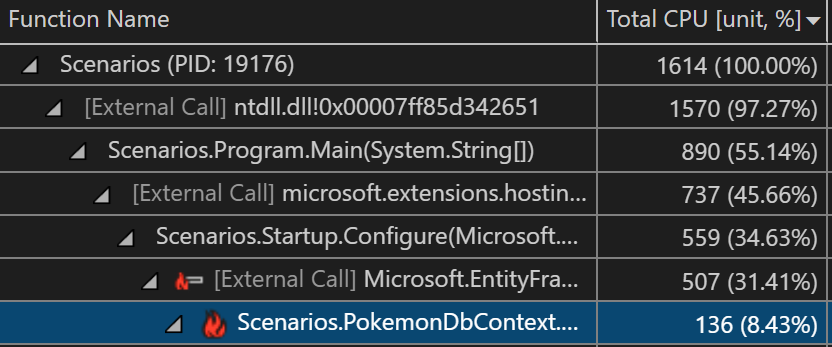
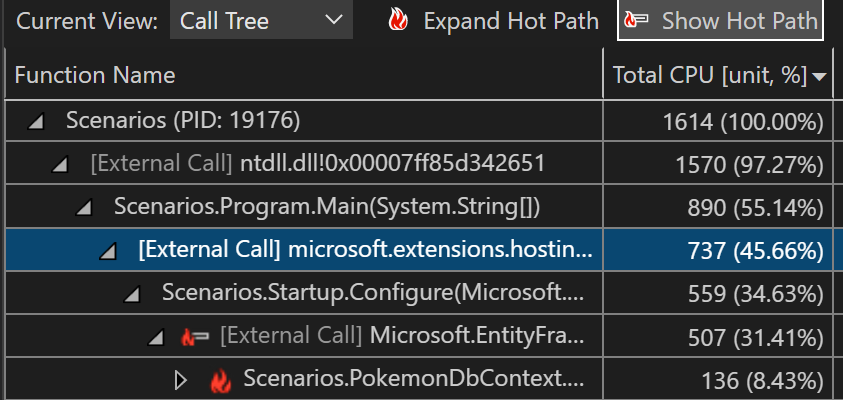
You can click the Expand Hot Path and Show Hot Path buttons to see the function calls that use the highest percentage of the CPU in the call tree view.
Call tree structure
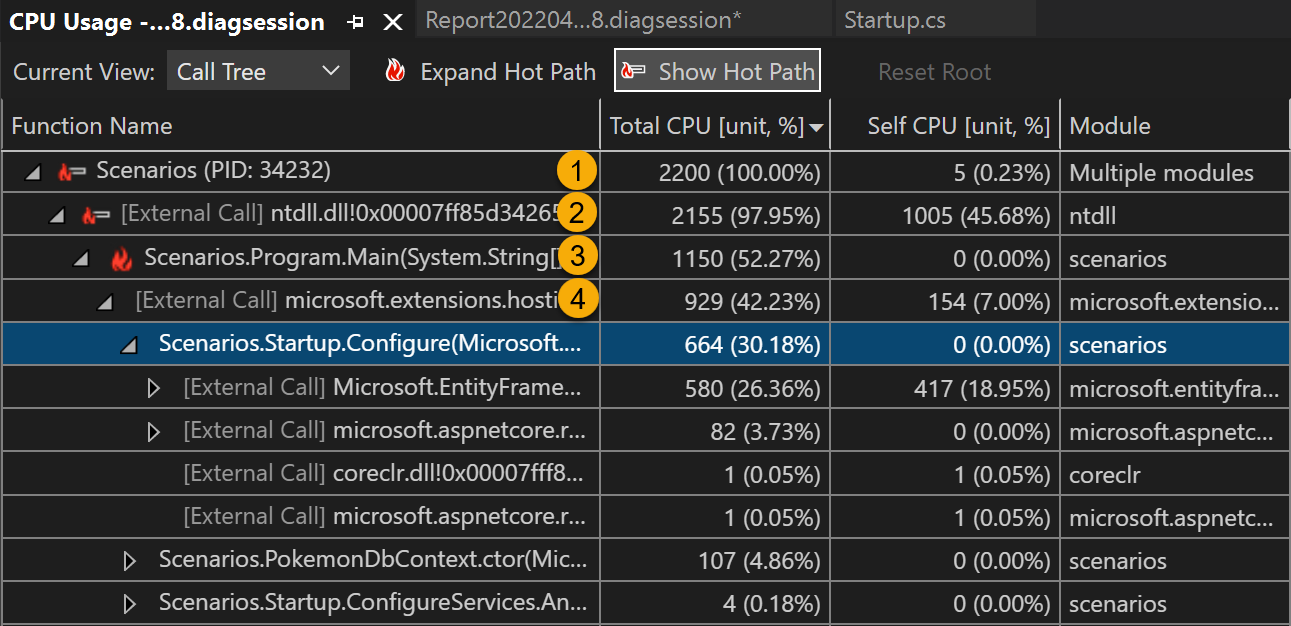
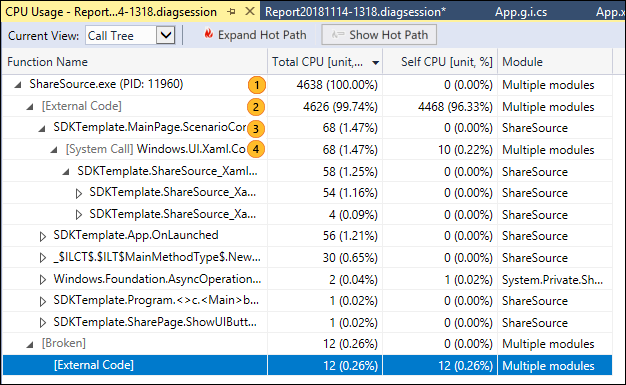
| Image | Description |
|---|---|
 |
The top-level node in CPU Usage call tree, representing the application. |
 |
In most apps, when the Show External Code option is disabled, the second-level node is an [External Code] node. The node contains the system and framework code that starts and stops the app, draws the UI, controls thread scheduling, and provides other low-level services to the app. |
 |
The children of the second-level node are the user-code methods and asynchronous routines that are called or created by the second-level system and framework code. |
 |
Child nodes of a method have data only for the calls of the parent method. When Show External Code is disabled, app methods can also contain an [External Code] node. |
For help understanding unexpected data in the call tree, see Understanding the call tree.
External code
System and framework functions that are executed by your code are called external code. External code functions start and stop the app, draw the UI, control threading, and provide other low-level services to the app. In most cases, you aren't interested in external code, so the CPU Usage call tree gathers the external functions of a user method into one [External Call] node.
To view the call paths of external code, on the main report summary page (right pane), deselect Show Just My Code from the Settings dropdown, and then select Apply. (The Settings dropdown is available on the main report summary page, not the detailed views.)
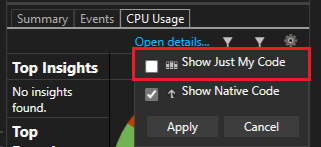
System and framework functions that are executed by your code are called external code. External code functions start and stop the app, draw the UI, control threading, and provide other low-level services to the app. In most cases, you aren't interested in external code, so the CPU Usage call tree gathers the external functions of a user method into one [External Code] node.
To view the call paths of external code, on the main diagnostic report page (right pane), select Show External Code from the Filter dropdown, and then select Apply. The Call Tree view of the CPU Usage page then expands the external code calls. (The Filter dropdown is available on the main diagnostic page, not the detailed views.)
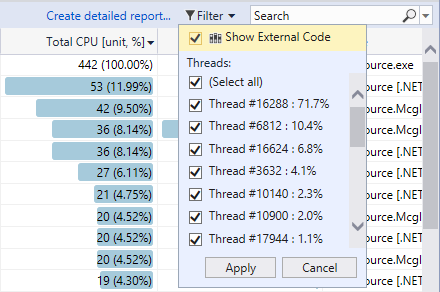
When you disable Show Just My Code, the Call Tree view of the CPU Usage page expands the external code calls.
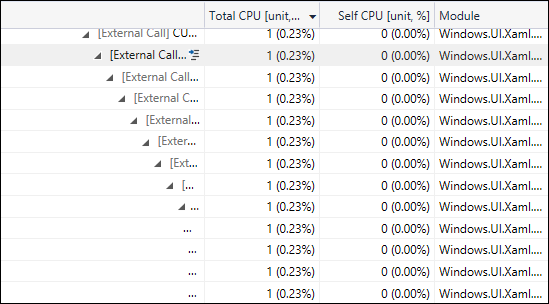
Many external code call chains are deeply nested, so the width of the chain can exceed the display width of the Function Name column. The function names then appear as shown in the following image.
Many external code call chains are deeply nested, so the width of the chain can exceed the display width of the Function Name column. The function names then appear as ....
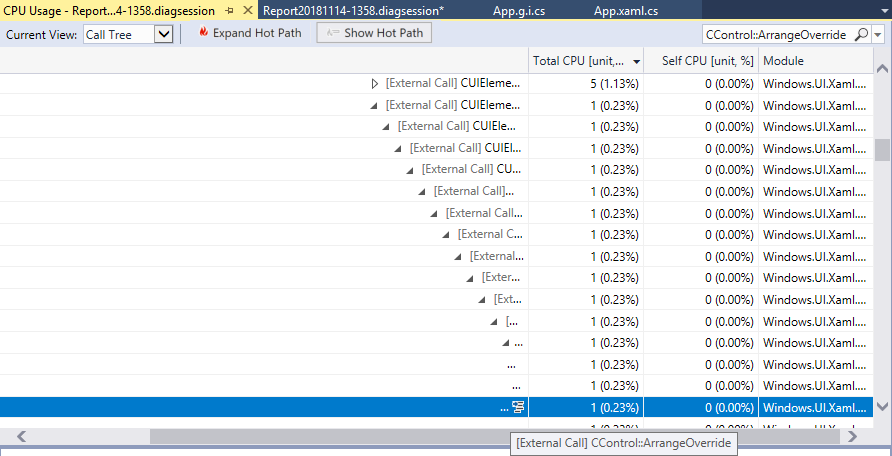
To find a function name you're looking for, use the search box. Hover over the selected line or use the horizontal scroll bar to view the data.

Asynchronous functions in the CPU usage call tree
When the compiler encounters an asynchronous method, it creates a hidden class to control the method's execution. Conceptually, the class is a state machine. The class has compiler-generated functions that asynchronously call the original methods, and the callbacks, scheduler, and iterators needed to run them. When a parent method calls the original method, the compiler removes the method from the execution context of the parent, and runs the hidden class methods in the context of the system and framework code that controls app execution. The asynchronous methods are often, but not always, executed on one or more different threads. This code appears in the CPU Usage call tree as children of the [External Code] node immediately below the top node of the tree.
In the following example, the first two nodes under [External Code] are the compiler-generated methods of the state machine class. The third node is the call to the original method.

Expand the generated methods to show what's going on:

MainPage::GetMaxNumberAsyncButton_Clickjust manages a list of the task values, computes the maximum of the results, and displays the output.MainPage+<GetMaxNumberAsyncButton_Click>d__3::MoveNextshows you the activity required to schedule and launch the 48 tasks that wrap the call toGetNumberAsync.MainPage::<GetNumberAsync>b__bshows the activity of the tasks that callGetNumber.
Analyze multi-process performance
Starting in Visual Studio 2022 version 17.13, you can analyze multi-process data in the CPU Usage tool. This makes it easier to analyzer performance for multi-process apps such as .NET Aspire. This features allows you to distinguish and analyze CPU utilization across processes within a single session, which provides clearer insights into resource consumption.
You need to collect multi-process data before you can analyze it. To collect the data, select Collect data from multiple processes for the CPU Usage tool in the Performance Profiler.

The timeline graph showing your app's CPU use displays performance data with distinct color coding for each process. The graphs are displayed as stacked area charts.

You can filter processes using a dropdown on the top left of the CPU timeline graph. When you select or deselect a process, the profiler summary page and detailed reports are updated based on the new selection(s), enabling more precise analysis.

Collect call counts (.NET)
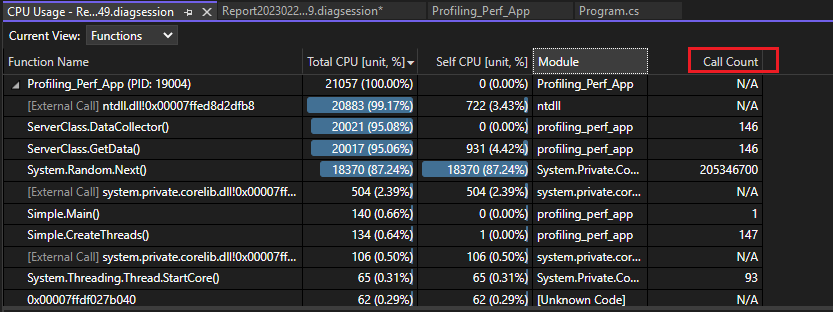
If you want to view call counts in the Functions view, you can enable the setting before you start the profiler. This setting is supported for .NET project types and requires launching the process under the profiler. The attach scenario is not supported.
Select the Settings icon for CPU Usage in the Performance Profiler.

Enable the Collect call counts (.NET only) option.
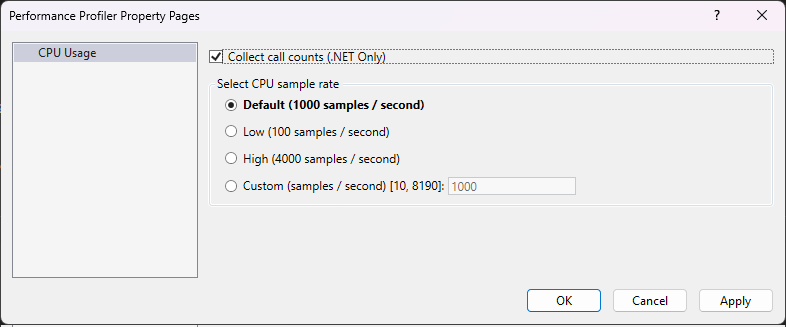
Collect CPU usage data.
Open the Functions view, and then make sure the Call count column is set to visible.
If you don't see the column, right click a column heading to choose visible columns.
