Note
Access to this page requires authorization. You can try signing in or changing directories.
Access to this page requires authorization. You can try changing directories.
This article offers practical guidance for planning capacity and compute for Spark workloads in Microsoft Fabric, covering development, migration, and production scenarios.
Guidelines for Sizing
This section offers practical guidance for sizing and configuring Spark workloads in Microsoft Fabric. It covers scenarios such as new development, migration from Synapse, and capacity tuning for production use.
Scenario: You're new to Fabric and need guidance on capacity planning.
Start with Trial Capacity: If you're new to Fabric, start with the trial capacity. It offers either F4 capacity (4 capacity units) or F64 capacity (64 capacity units) throughput for 60 days. This setup is ideal for developing and testing Spark workloads. To estimate your required capacity, go to Plan your capacity size and the Microsoft Fabric SKU Estimator (preview).
Choosing Starter Pool vs. Custom Pool:
Starter Pools: Typically you want to use starter pools for your Spark workloads. Microsoft Fabric pre-provisions these pools, ensuring fast session startup times. They're ideal for development environments where you don't require custom libraries, Managed Private Endpoint (MPE), or Private Link (PL). Starter pools can significantly improve developer productivity.
Custom Pools: Use custom pools when you enable Managed Private Endpoint (MPE) or Private Link (PL).
To learn more about starter and custom pools, refer to the Apache Spark compute for Data Engineering and Data Science documentation.
Profiling Spark Notebooks:
To monitor Spark applications in Fabric, you can use:
Spark History Server: to drill down single application details and more granular stage level, task level, skews, logical plan, physical plan.
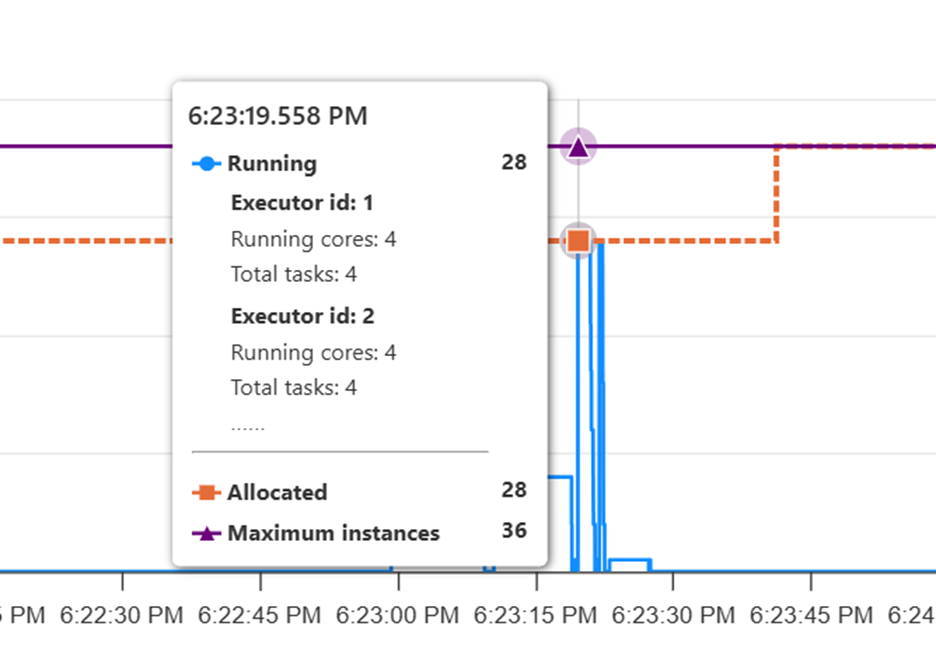
Resource Usage UI: to analyze executor utilization and numbers of executors scaled up or down after each stage.
Monitoring UI: 30 day metrics of high level Notebook/Spark Job Definition (SJD)/Pipeline execution details like execution time, status, submitted by etc. Monitoring UI is good for cross app visibility.
Diagnostic emitter extension: To emit logs to targets like Azure log analytics, Azure storage, and Azure event hubs. This is great for long‑term trend analysis.
Generally, start profiling your application with Starter Pools (medium Spark pools (8 vCores and 64 GB memory)). Begin with a minimum of one node and observe the execution time.
To observe the resource usage, navigate to the Spark resource usage UI. In the resource usage UI, if the allocated instances are fewer than the maximum instances in the stage with the highest number of tasks, reduce the maximum node count in Spark auto scale to match the allocated instances.
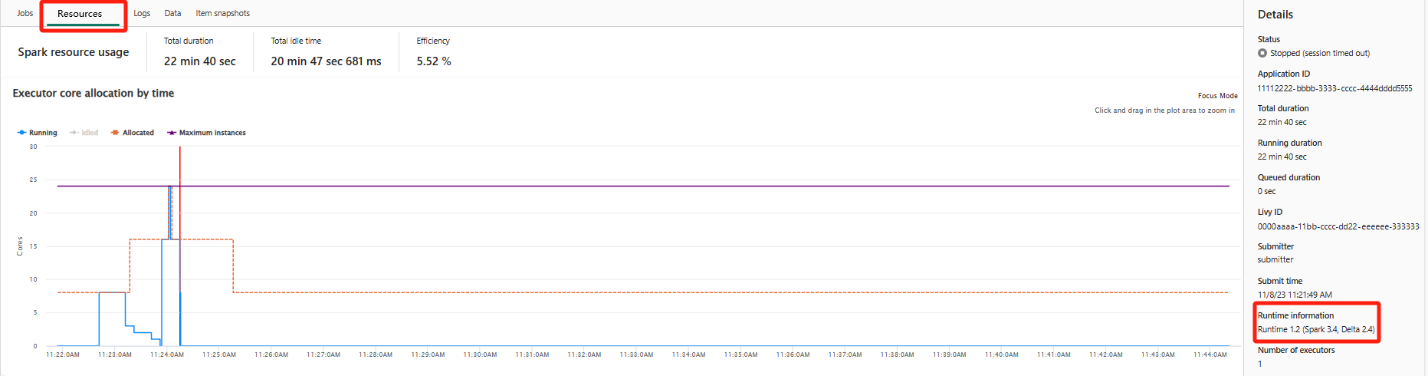
If the maximum and allocated instances overlap, consider increasing the maximum nodes configuration to enhance parallelism and improve performance.


Handling Data Skew:
- If you detect data skew, simply adding more resources might not help. Address skews using techniques like repartitioning when uneven data distribution causes the skew.
- Refer to the development and monitoring article in this series for guidance on identifying and addressing skews.
Evaluating Utilization: Use the Capacity Metrics app to evaluate utilization and estimate the optimal capacity size for your workloads. Refer to the Monitor Apache Spark capacity consumption documentation for more details. After analyzing trial capacity utilization, choose the appropriate pay-as-you-go capacity for your PoCs and then move to capacity backed by a Reservations (RI) or Auto scale Billing. RI is a year long commitment. A pay-as-you-go capacity can be canceled anytime. RI offers about a 40% discount compared to pay-as-you-go capacity.
Scenario: Running Spark workloads on pay-as-you-go capacity. What is the optimal capacity model to choose?
If you're running Spark workloads on a pay-as-you-go capacity, consider transitioning to autoscale. Autoscale provides the same contractual flexibility as pay-as-you-go, but with the advantage of removing the risk of throttling. Jobs will, however, queue if there are insufficient resources and at a lower cost.
You might also want to consider a hybrid model using a reservation for stable workloads and Autoscale for more variable workloads. Reservations provide the best cost performance, as long as the capacities remain well utilized (greater than 75% on average for the term of the contract).
In general, there aren't many reasons why you might prefer pay-as-you-go over the previously discussed options:
You already have a pay-as-you-go capacity running non-spark workloads that have more headrooms to run your Spark jobs- the marginal cost of adding another job to a capacity is 0 (although if you add too many you could throttle). Even here though you should consider reserving for a year at a reduced cost if possible.
You have a short term PoC or dev project, where cost predictability is more important than cost efficiency- with a capacity you pay a set amount each month. If you overuse the capacity you're not charged more, instead you're throttled. With Autoscale, you're charged for what you use, which could cause cost overruns if bad code is run in your dev environment. For a dev project with a tightly managed budget this might be a worthwhile trade-off.
To further optimize resource usage:
You can run multiple Spark Notebooks in a single high-concurrency Spark session to optimize resource usage.
Enable Native Execution Engine (NEE) to significantly boost performance.
Scenario: You're migrating workloads from Synapse to Fabric.
If you're migrating workloads from Synapse to Fabric, you might be wondering what changes, what stays the same, and whether you can reuse your existing Synapse sizing.
Migration and Optimization:
Use the Synapse to Fabric migration utility to move your workloads.
Enable Autoscale Billing for Spark. If the environment and Lakehouse are the same, run the Notebooks or pipelines in high concurrency mode (a feature not available in Synapse) for better performance.
Profile the Notebooks using the Native Execution Engine (NEE) to optimize performance for your workloads.
General Compute Configuration Guidelines:
| Scenario | Guidance |
|---|---|
| Transform-heavy jobs with shuffles & joins | Use larger nodes (16–64 cores) |
| Bursty or unpredictable jobs | Use Spark Autoscale + Dynamic Allocate to let the cluster grow/shrink as needed. Works well when jobs vary in size. |
| Many small parallel jobs (e.g., streaming or batch microjobs) | Use small or medium nodes. Configure a minimum number of nodes to avoid cold-start delays. For smaller jobs, you can orchestrate them using notebookutils.notebook.runMultiple(), which allows running multiple notebooks in parallel. |
| Small serial processed jobs or development work | Use small or medium nodes in single node mode (driver and executor shares 1 VM). |
| Large jobs with known partitioning | Presize the cluster manually: pick the minimum node size and count based on data volume and shuffle stages. |
| ML or distributed training | Use many medium/large nodes to maximize parallelism and distribute compute evenly. |
| To Run Just Python Code | Use Python Kernel |