Snapshot debugging
Note
With Business Central 17.2 - Snapshot Debugging is available in production cloud environments.
Note
Azure Active Directory is now Microsoft Entra ID. Learn more
With snapshot debugging, you can record AL code that runs on the server, and when it has completed, debug the recorded snapshot in Visual Studio Code. Snapshot debugging lets you inspect code execution and variables in the production environment on a cloud service for a specified user session. To create and download a snapshot file that exists on the server on behalf of an end-user, the user must be part of the D365 Snapshot Debug permission set. For more information, see Assign Permissions to Users and Groups.
Snapshot debugging introduces the concept of snappoints. A snappoint is a breakpoint in Visual Studio Code that is set while creating a snapshot but they don't stop execution of code like regular debugging. Snappoints log the state at the breakpoint for later offline inspection. Snapshot debugging will record AL code as it runs on the server, but will only collect variable information on:
- Snappoints
- AL exceptions
Note
With Business Central version 18.1, it's possible to snapshot the debug event subscribers triggered by built-in codeunit triggers if a snappoint is placed in an AL file on the stack trace that leads to the built-in method. For more information, see Snapshot debugging built-in methods.
Important
To enable snapshot debugging, it's very important that the symbols on the tenant match the symbols on the server. This isn't automatically detected, and must be manually checked. In this release, you can ensure this by copying the specific sandbox and download symbols from that copy. Furthermore, any code that snappoints are set in, must have been deployed, otherwise debugging will not work. For more information, see the section Downloading symbols on the snapshot debugger endpoint.
Snapshot debugging keyboard shortcuts
In the following sections, you can read more about how to initialize, view the status, and finalize a snapshot debugging session. It's useful to familiarize yourself with the following keyboard shortcuts. For more keyboard shortcuts, see Keyboard Shortcuts.
| Keyboard Shortcut | Action |
|---|---|
| F7 | Start a snapshot debugging session |
| Shift+F7 | List all available snapshots |
| Alt+F7 | Finish a snapshot debugging session |
Initialize a snapshot debugging session
You can start a snapshot by creating a snapshot configuration file in Visual Studio Code. There are two template configurations for a snapshot, which are accessed by selecting Add Configuration in Visual Studio Code.
- AL: Initialize a snapshot debugging session locally
- AL: Initialize a snapshot debugging session on cloud
Choose whether to run the session on a cloud service or locally. The configuration file contains the following information. For a full overview of configuration settings, see Launch JSON file.
| Setting | Description |
|---|---|
userId |
The GUID of the user who initiated the process to start snapshot debugging. For on-premises, this can also be the user name in user password authentication scenarios. The user must be able to start, or have a session type opened that is specified in the breakOnNext parameter. Note: Specifying userId doesn't work with Windows authentication: "authentication" : "Windows", in which case you can only choose sessionId or attach to the next session. For more information, see Launch JSON file. |
sessionId |
A session ID for the user specified in userId. |
snapshotVerbosity |
Determines how much execution context to be recorded. If SnapPoint is specified, then only methods that hit a snappoint will be recorded. |
tenant |
The Microsoft Entra tenant ID for the tenant to connect to. Specify this if your target is a different tenant from the user's own Microsoft Entra tenant, for example when running as a delegated admin. |
When a configuration is defined, a snapshot debugging session can be initialized by selecting Ctrl+Shift+P, and then selecting AL:Initialize Snapshot Debugging or by selecting F7.
Note
If you're going to use the snapshot for profiling the code, you must enable the configuration parameter called executionContext. For more information, see AL Profiler Overview.
To record the AL execution, the server will now wait for a connection to happen where the following rules apply:
- If a
sessionIdis specified for auserIdin the given tenant, then it'll be the session that's going to be snapshot debugged. If the specifiedsessionIdisn't found or the session, which is found isn't owned by the user specified inuserIdproperty, then the attach request will fail. - If only a
userIdis specified for a given tenant then the next session, which is specified in thebreakOnNextconfiguration parameter is snapshot debugged. - If no
userIdis specified then the next session on a given tenant that validates thebreakOnNextparameter will be snapshot debugged.
Tip
If you're having difficulty getting the snapshot debugger to attach to a new session using WebClient for the breakOnNext configuration parameter, then close the browser window and try again.
Tip
To do snapshot debugging of Service to Service (S2S) web service calls set the breakOnNext configuration parameter to WebServiceClient in the launch.json file and use table explorer to find the userId of the user record mapped to the S2S Microsoft Entra authentication Application. When the snapshot session is initialized, trigger the session either from the integration (service or device) or manually by invoking a web service call using tools like Insomnia, Bruno, or Insomnium. For information about creating S2S refer to Using Service to Service Authentication, Client Credentials Grant Flow, App-only Authentication.
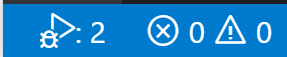
Once a snapshot debugging session is initialized, the snapshot debugging session counter on the status bar will be updated and look like this:
Status of a snapshot debugging session
Clicking on the status bar icon or selecting Shift+F7 will bring up a list of all available snapshots.
The status list will show the state of a snapshot-debugged session.
A snapshot debugging session can be in one of the three states:
- Initialized - A request is issued and the server is waiting for the next session to be snapshot debugged based on the above rules.
- Started - You've attached to an end-user session to snapshot debug.
- Finished - When the snapshot debugging session has finished.
- Downloaded - When the snapshot file is downloaded.
Stop a snapshot debugging session
You can stop a snapshot debugging session by selecting Alt+F7. This brings up all snapshot sessions that have been started. Choosing one will close the session debugging on the server and download the snapshot file.
Important
The snapshot file can contain customer privacy data and must therefore be handled according to the privacy and compliance policies. The file should be deleted when it's not needed anymore.
Snapshot debugging sessions that have produced a snapshot file can be debugged. The location of a snapshot file is controlled by the al.snapshotOutputPath configuration parameter. By default it's local to the current workspace and it's called ./.snapshots. For more information, see AL Language Extension Configuration.
Download symbols on the snapshot debugger endpoint
In order to download symbols on a production server, you need permission related entries. The read-only access to the Published Application table emphasized in the D365 Snapshot Debug permission set should be granted.
Symbols download is using the snapshotInitialize debug configuration settings in Visual Studio Code, which is set up when you choose either AL: Initialize a snapshot debugging session locally or AL: Initialize a snapshot debugging session on cloud.
{
            "name": "snapshotInitialize: MyServer",
            "type": "al",
            "request": "snapshotInitialize",
            "environmentType": "OnPrem",
            "server": "http://localhost",
            "serverInstance": "BC190",
            "authentication": "UserPassword",
            "breakOnNext": "WebClient"
        },
Important
Debugging requires that symbols on the server are matched with the symbols that the user has locally. If this isn't the case, and you set a breakpoint on a given line in Visual Studio Code, the line of the code may differ from what is on the server. For example, if you don't download the symbols from the production servers for snapshot debugging, you can face a scenario where you set a breakpoint in a DAL file on line 12, but line 12 on the server is an empty line or a completely different line because the symbols aren't the same.
Debugging a snapshot file
There are two user actions that will start snapshot debugging:
- Creating a new launch debug configuration and specifying the snapshot file name in the
snapshotFileNameconfiguration setting. This is the only setting that is needed besides the type, request, and name. - Choosing the status icon or by selecting Shift+F7 and selecting a finished snapshot-debugged session.
Once a snapshot debugging session starts in Visual Studio Code, code execution will stop at the first snappoint. AL exceptions will be treated as snappoints, with the only difference that they can't be removed by the user actions. Other snappoints are regular breakpoints that can be removed or readded by the user actions. If no snappoints are specified in the first recorded methods; the first line is the entry breakpoint.
The user can set breakpoints and continue execution to these breakpoints for testing because a snappoint is what carries the real information, so a line can be hit.
Viewing executed code
APPLIES TO: Business Central 2022 release wave 2 and later
During snapshot debugging playback, the left-side code editor gutter contains a vertical visual bar to indicate which code was executed in the snapshot capture. The color of the gutter bar can be controlled using the al.snapshotDebuggerLinesHitDecoration in the settings.json file. For more information, see AL Language Extension Configuration.
Snapshot debugging the built-in codeunit triggers
Built-in codeunit triggers can be snapshot-debugged if they're part of the stack trace, these are System Action Triggers, or Company Triggers. This provides a way to snapshot debug that part of the Base App too. To help locate where built-in codeunit triggers are called, use the Event Recorder in Business Central. From the code, when all symbols on the snapshot endpoint have been downloaded, see Downloading symbols on the snapshot debugger endpoint, you can add AL code that contains a reference to that particular event subscription and then use Go to Definition to locate the place where that particular codeunit trigger is defined in the .dal file. Adding a snappoint to the code in the .dal file and then initiating the snapshot debugger session will ensure that the code is part of the stacktrace. When the generated snapshot file is then opened in the debugger, the execution will break on the snappoint.
Snapshot debugging versus regular debugging
Snapshot debugging is almost the same as a regular debugging with the differences mentioned below:
| Snapshot versus regular debugging |
|---|
| Breakpoints can be added or removed and they'll be hit if the breakpoint is in the execution context of a recorded state. This means that if you walk the execution stack for a breakpoint and the next stepped line is reached, then the code will break on the breakpoint. |
| A snappoint is a breakpoint in Visual Studio Code that is set when creating a snapshot. They don't, however, stop execution of code like when using regular debugging. Snappoints instruct execution to log the state at the breakpoint for later offline inspection. |
| You can always navigate through all the breakpoints with Continue (F5). The order may not be the same as the execution order on the Business Central server. This is because some calls on the server are AL calls with non-walkable stacks. Some are direct server calls on the server like triggers. A snapshot debugging session on the Business Central server can only record AL calls and walk AL stack traces. |
| This is also true when stepping. The rule of thumb is that breakpoints within the reach are hit first, and if there are none; the next line is hit. Breakpoints on triggers may not always qualify as code within reach. |
| Variable data is only shown on snappoints. |
| If there are no frames available, snapshot debugging will stop. |
Stepping out of triggers with no recorded stack information will move execution to the first recorded method's first line. This may be far from the user's execution of interest. For example, stepping out from an OnOpenPage trigger with a snappoint may land on deep inside base code execution where recording has started. Navigating with F5 will start over breakpoint resolution, thus this is an exit strategy from a scenario like this. |
| A snappoint may resolve as a non-reachable breakpoint if there was no execution state on the server hitting the snappoint. |
| A snapshot debugger session with a Business Central server will be closed if not attached to after 30 minutes. |
| If a snapshot debugger session is started, it has to be finished after 10 minutes. |
See Also
Debugging
Attach and Debug Next
Developing Extensions
JSON Files
AL Code Navigation
Comentarios
Próximamente: A lo largo de 2024 iremos eliminando gradualmente GitHub Issues como mecanismo de comentarios sobre el contenido y lo sustituiremos por un nuevo sistema de comentarios. Para más información, vea: https://aka.ms/ContentUserFeedback.
Enviar y ver comentarios de