Azure Monitor managed service for Prometheus
Azure Monitor managed service for Prometheus is a component of Azure Monitor Metrics, providing more flexibility in the types of metric data that you can collect and analyze with Azure Monitor. Prometheus metrics are supported by analysis tool like Azure Monitor Metrics Explorer with PromQL and open source tools such as PromQL and Grafana.
Azure Monitor managed service for Prometheus allows you to collect and analyze metrics at scale using a Prometheus-compatible monitoring solution, based on the Prometheus project from the Cloud Native Computing Foundation. This fully managed service allows you to use the Prometheus query language (PromQL) to analyze and alert on the performance of monitored infrastructure and workloads without having to operate the underlying infrastructure.
Important
Azure Monitor managed service for Prometheus is intended for storing information about service health of customer machines and applications. It is not intended for storing any data classified as Personal Identifiable Information (PII) or End User Identifiable Information (EUII). We strongly recommend that you do not send any sensitive information (usernames, credit card numbers etc.) into Azure Monitor managed service for Prometheus fields like metric names, label names, or label values.
Data sources
Azure Monitor managed service for Prometheus can currently collect data from any of the following data sources:
- Azure Kubernetes service (AKS)
- Azure Arc-enabled Kubernetes
Enable
The only requirement to enable Azure Monitor managed service for Prometheus is to create an Azure Monitor workspace, which is where Prometheus metrics are stored. Once this workspace is created, you can onboard services that collect Prometheus metrics.
- To collect Prometheus metrics from your Kubernetes cluster, see Enable monitoring for Kubernetes clusters.
- To configure remote-write to collect data from your self-managed Prometheus server, see Azure Monitor managed service for Prometheus remote write.
Remote write
In addition to the managed service for Prometheus, you can also use self-managed prometheus and remote-write to collect metrics and store them in an Azure Monitor workspace.
Kubernetes services
Send metrics from self-managed Prometheus on Kubernetes clusters. For more information on remote-write to Azure Monitor workspaces for Kubernetes services, see the following articles:
- Microsoft Entra ID authorization proxy
- Send Prometheus data from AKS to Azure Monitor by using managed identity authentication
- Send Prometheus data from AKS to Azure Monitor by using Microsoft Entra ID authentication
- Send Prometheus data to Azure Monitor by using Microsoft Entra ID pod-managed identity (preview) authentication
- Send Prometheus data to Azure Monitor by using Microsoft Entra ID Workload ID (preview) authentication
Virtual Machines and Virtual Machine Scale sets
Send data from self-managed Prometheus on virtual machines and virtual machine scale sets. Servers can be in an Azure-managed environment or on-premises. Fro more information, see Send Prometheus metrics from Virtual Machines to an Azure Monitor workspace.
Azure Monitor Metrics Explorer with PromQL
Metrics Explorer with PromQL allows you to analyze and visualize platform metrics, and use Prometheus query language (PromQL) to query Prometheus and other metrics stored in an Azure Monitor workspace. Metrics Explorer with PromQL is available from the Metrics menu item of any Azure Monitor workspace in the Azure portal. See Metrics Explorer with PromQL for more information.
Grafana integration
The primary method for visualizing Prometheus metrics is Azure Managed Grafana. Connect your Azure Monitor workspace to a Grafana workspace so that it can be used as a data source in a Grafana dashboard. You then have access to multiple prebuilt dashboards that use Prometheus metrics and the ability to create any number of custom dashboards.
Rules and alerts
Azure Monitor managed service for Prometheus supports recording rules and alert rules using PromQL queries. Metrics recorded by recording rules are stored back in the Azure Monitor workspace and can be queried by dashboard or by other rules. Alert rules and recording rules can be created and managed using Azure Managed Prometheus rule groups. For your AKS cluster, a set of predefined Prometheus alert rules and recording rules is provided to allow easy quick start.
Alerts fired by alert rules can trigger actions or notifications, as defined in the action groups configured for the alert rule. You can also view fired and resolved Prometheus alerts in the Azure portal along with other alert types.
Service limits and quotas
Azure Monitor Managed service for Prometheus has default limits and quotas for ingestion. When you reach the ingestion limits throttling can occur. You can request an increase in these limits. For more information on throttling and requesting increased limits, see Monitoring metrics limits. For information on Prometheus metrics limits, see Azure Monitor service limits.
Limitations/Known issues - Azure Monitor managed Service for Prometheus
- Scraping and storing metrics at frequencies less than 1 second isn't supported.
- Microsoft Azure operated by 21Vianet cloud and Air gapped clouds aren't supported for Azure Monitor managed service for Prometheus.
- To monitor Windows nodes & pods in your clusters, see Enable monitoring for Azure Kubernetes Service (AKS) cluster.
- Azure Managed Grafana isn't currently available in the Azure US Government cloud.
- Usage metrics (metrics under
Metricsmenu for the Azure Monitor workspace) - Ingestion quota limits and current usage for any Azure monitor Workspace aren't available yet in US Government cloud. - During node updates, you might experience gaps lasting 1 to 2 minutes in some metric collections from our cluster level collector. This gap is due to a regular action from Azure Kubernetes Service to update the nodes in your cluster. This behavior is expected and occurs due to the node it runs on being updated. None of our recommended alert rules are affected by this behavior.
Case sensitivity
Azure managed Prometheus is a case insensitive system. It treats strings, such as metric names, label names, or label values, as the same time series if they differ from another time series only by the case of the string.
Note
This behavior is different from native open source Prometheus, which is a case sensitive system.
In Azure managed Prometheus the following time series are considered the same:
diskSize(cluster="eastus", node="node1", filesystem="usr_mnt")
diskSize(cluster="eastus", node="node1", filesystem="usr_MNT")
The above examples are a single time series in a time series database.
- Any samples ingested against them are stored as if they're scraped/ingested against a single time series.
- If the preceding examples are ingested with the same timestamp, one of them is randomly dropped.
- The casing that's stored in the time series database and returned by a query is unpredictable. Different casing may be returned at different times for the same time series.
- Any metric name or label name/value matcher present in the query is retrieved from time series database by making a case-insensitive comparison. If there's a case sensitive matcher in a query, it's automatically treated as a case-insensitive matcher when making string comparisons.
It's best practice to ensure that a time series is produced or scraped using a single consistent case.
In Open Source Prometheus, the above time series are treated as two different time series. Any samples scraped/ingested against them are stored separately.
Prometheus references
Following are links to Prometheus documentation.
Frequently asked questions
This section provides answers to common questions.
How do I retrieve Prometheus metrics?
All data is retrieved from an Azure Monitor workspace by using queries that are written in Prometheus Query Language (PromQL). You can write your own queries, use queries from the open source community, and use Grafana dashboards that include PromQL queries. See the Prometheus project.
Can I view my Prometheus metrics in Azure Monitor metrics explorer?
Metrics explorer with PromQL supports visualizing Prometheus metrics data using PromQL. To use the Metrics Explorer with PromQL support, select the Metrics menu item from any Azure Monitor workspace in the Azure portal. For more information, see Metrics explorer with PromQL (Preview).
When I use managed service for Prometheus, can I store data for more than one cluster in an Azure Monitor workspace?
Yes. Managed service for Prometheus is intended to enable scenarios where you can store data from several Azure Kubernetes Service clusters in a single Azure Monitor workspace. See Azure Monitor workspace overview.
What types of resources can send Prometheus metrics to managed service for Prometheus?
Our agent can be used on Azure Kubernetes Service clusters and Azure Arc-enabled Kubernetes clusters. It's installed as a managed add-on for AKS clusters and an extension for Azure Arc-enabled Kubernetes clusters and you can configure it to collect the data you want. You can also configure remote write on Kubernetes clusters running in Azure, another cloud, or on-premises by following our instructions for enabling remote write.
If you use the Azure portal to enable Prometheus metrics collection and install the AKS add-on or Azure Arc-enabled Kubernetes extension from the Insights page of your cluster, it enables logs collection into Log Analytics and Prometheus metrics collection into managed service for Prometheus. For more information, see Data sources.
How can I monitor the service limits and quota?
Azure Monitor Managed service for Prometheus has default limits and quotas for ingestion. For information on Prometheus metrics limits, see Azure Monitor service limits. When you reach the ingestion limits throttling can occur. In order to avoid throttling, you can monitor and set up an alert on Azure Monitor Workspace ingestion limits.
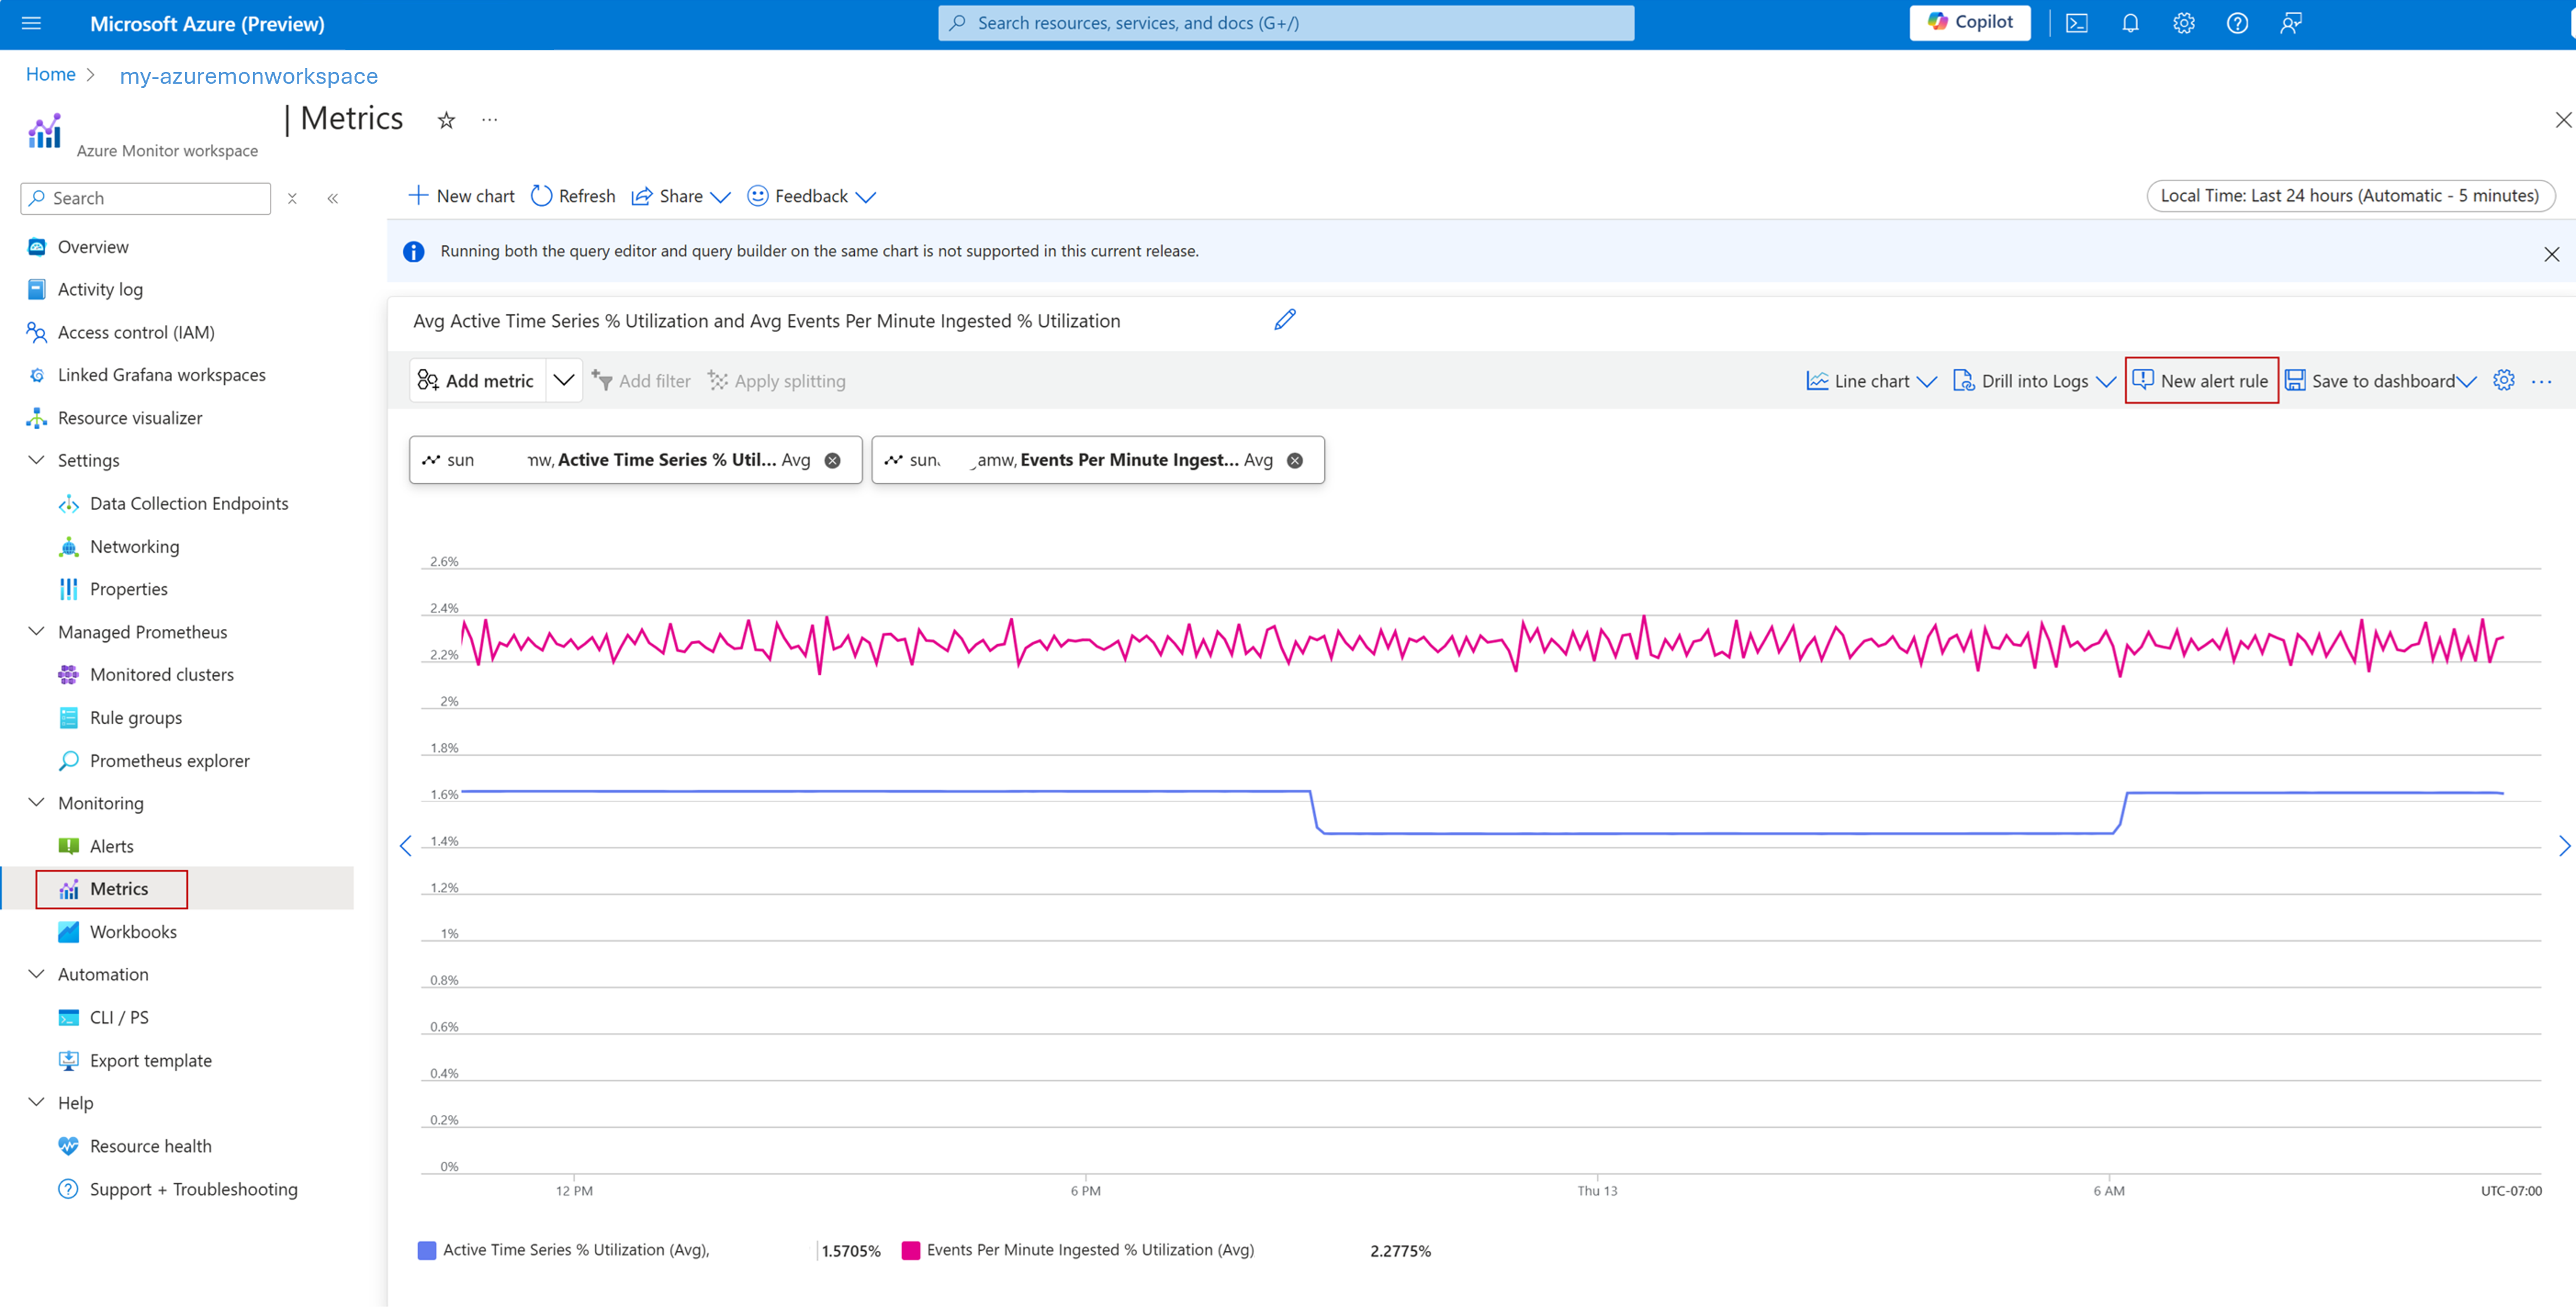
- In the Azure portal, navigate to your Azure Monitor Workspace, click on Metrics under the Monitoring section.
- Select the Azure Monitor Workspace as scope, and in the drop-down for Metric, select "View standard metrics with the builder".
- In the drop-down for Metric, select Active Time Series % Utilization and Events Per Minute Ingested % Utilization and verify that they are below 100%.
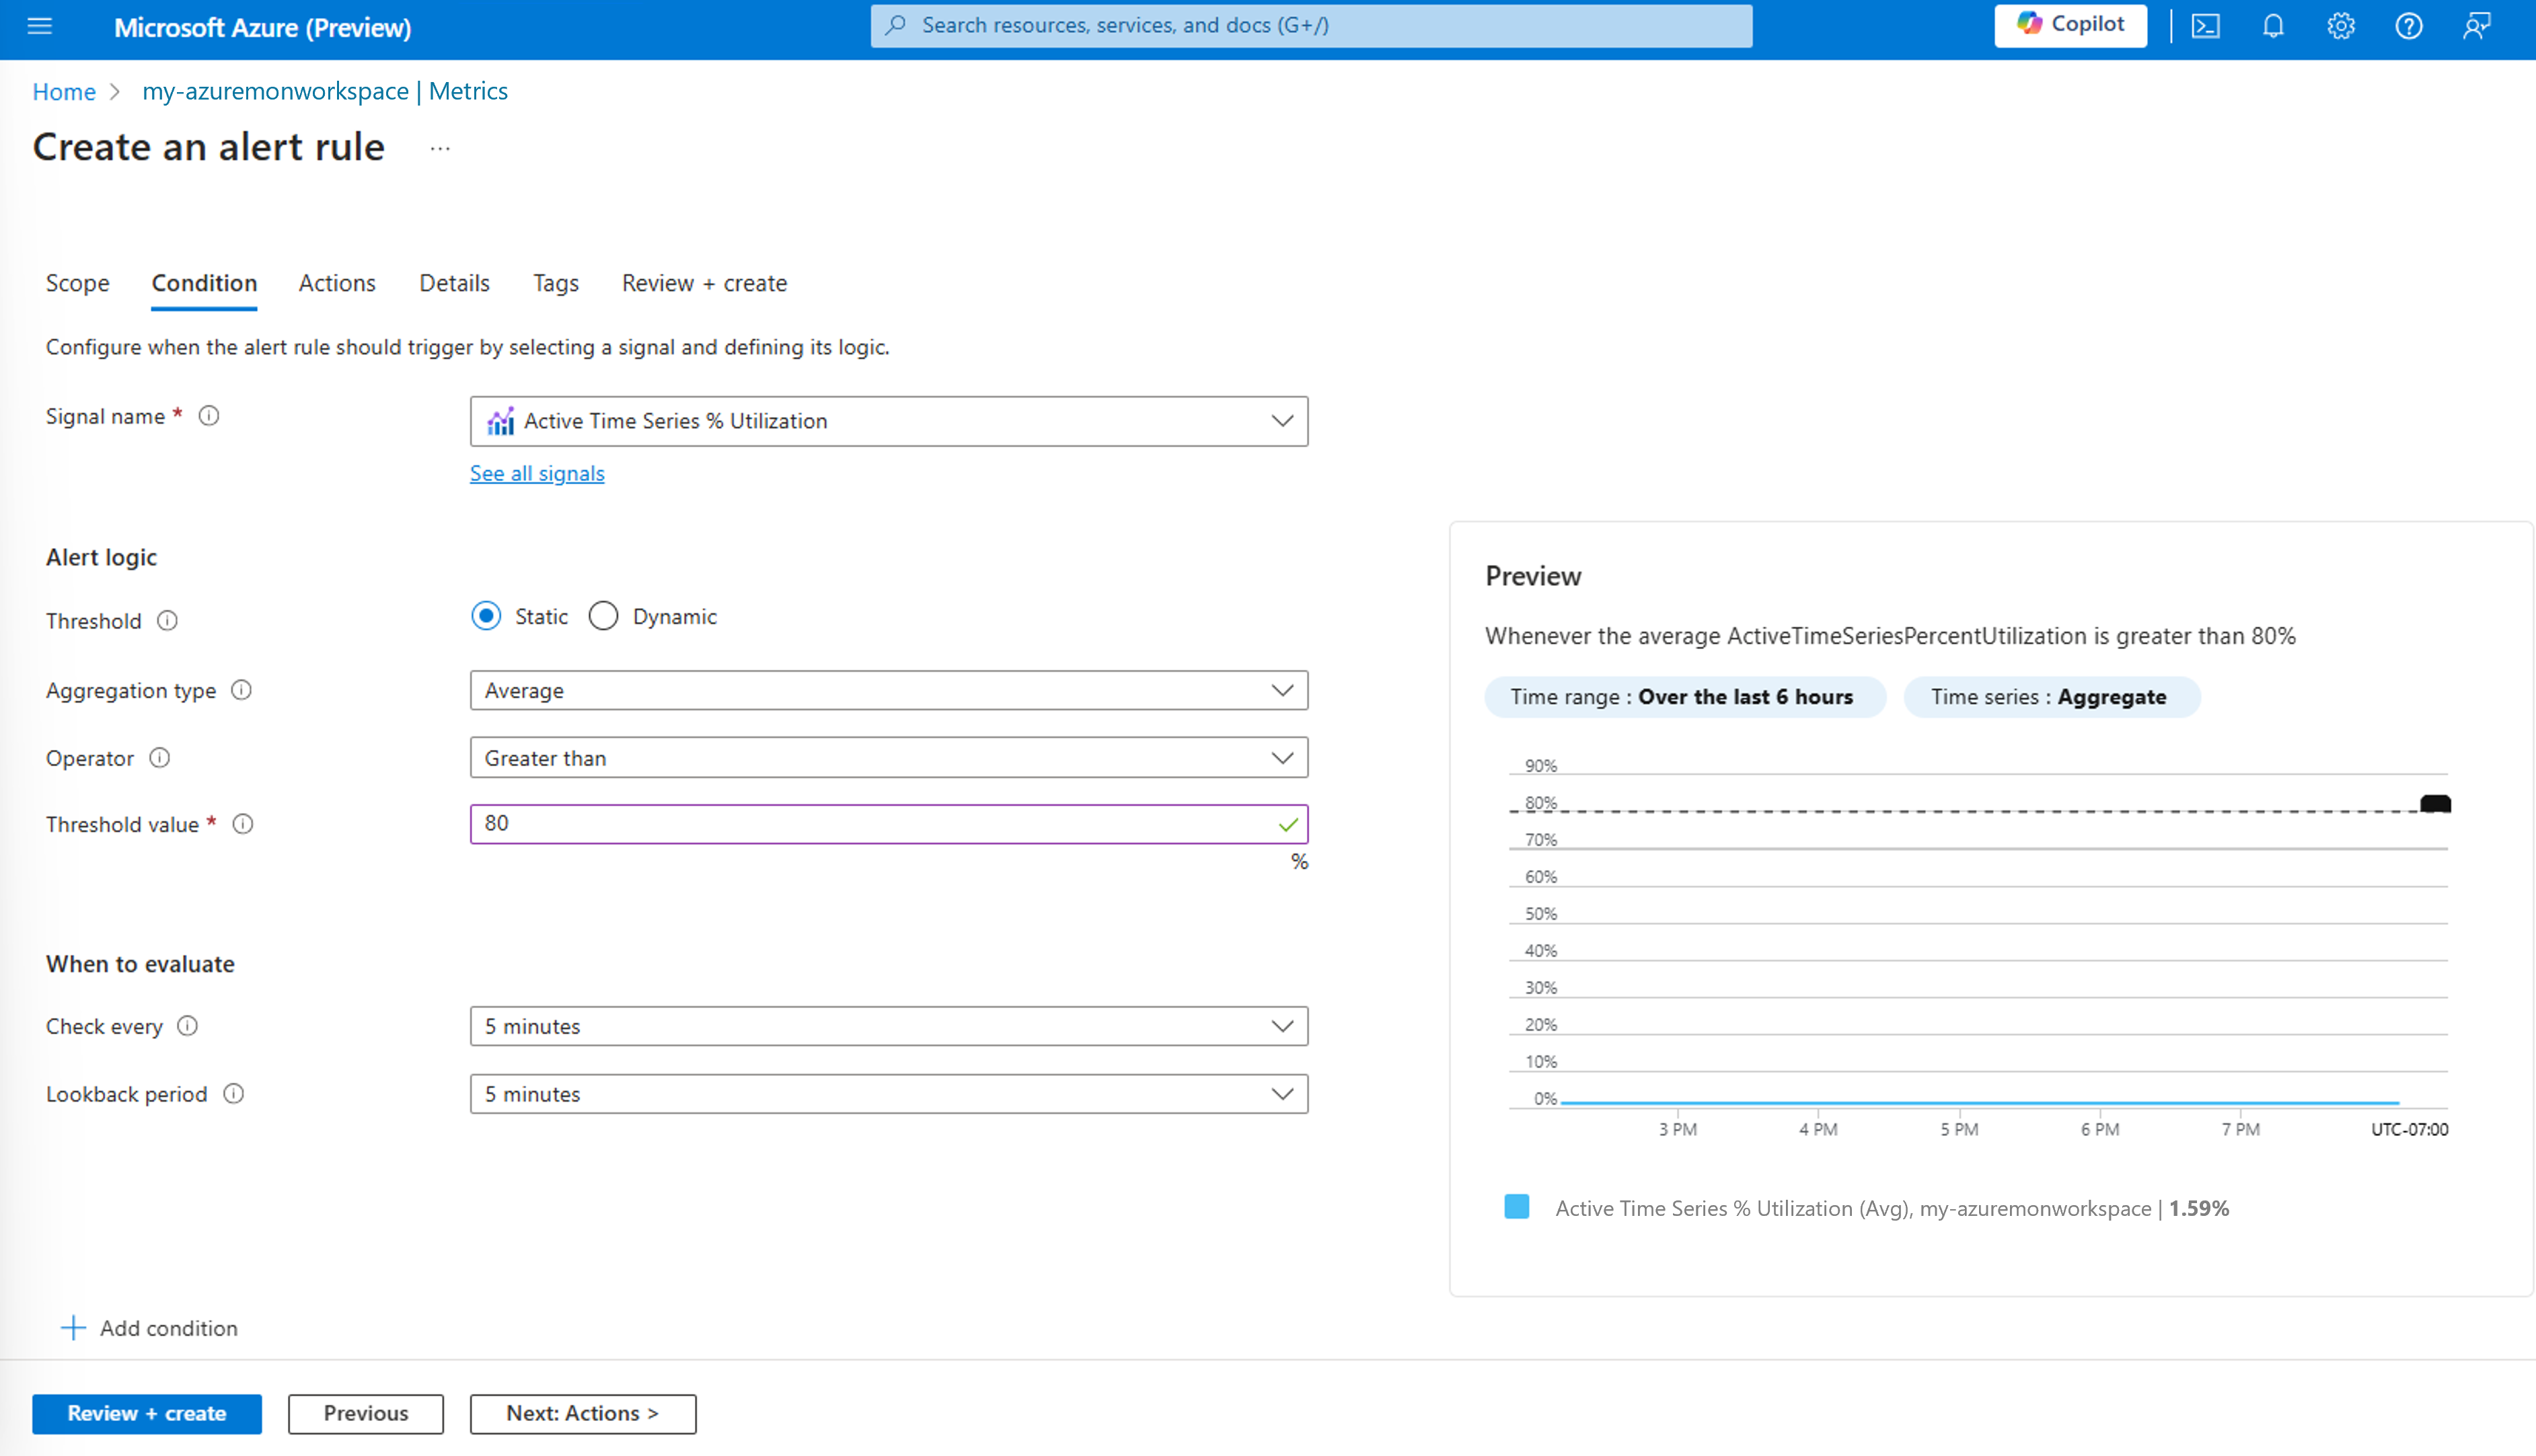
- You can set an Azure Alert to monitor the utilization and fire an alert when the utilization is greater than a certain threshold (eg. 80% of the limit). Click on "New alert rule" to create an Azure alert for the same.
If the alert is fired i.e. the ingestion utilization is more than the threshold, you can request an increase in these limits by creating a support ticket.
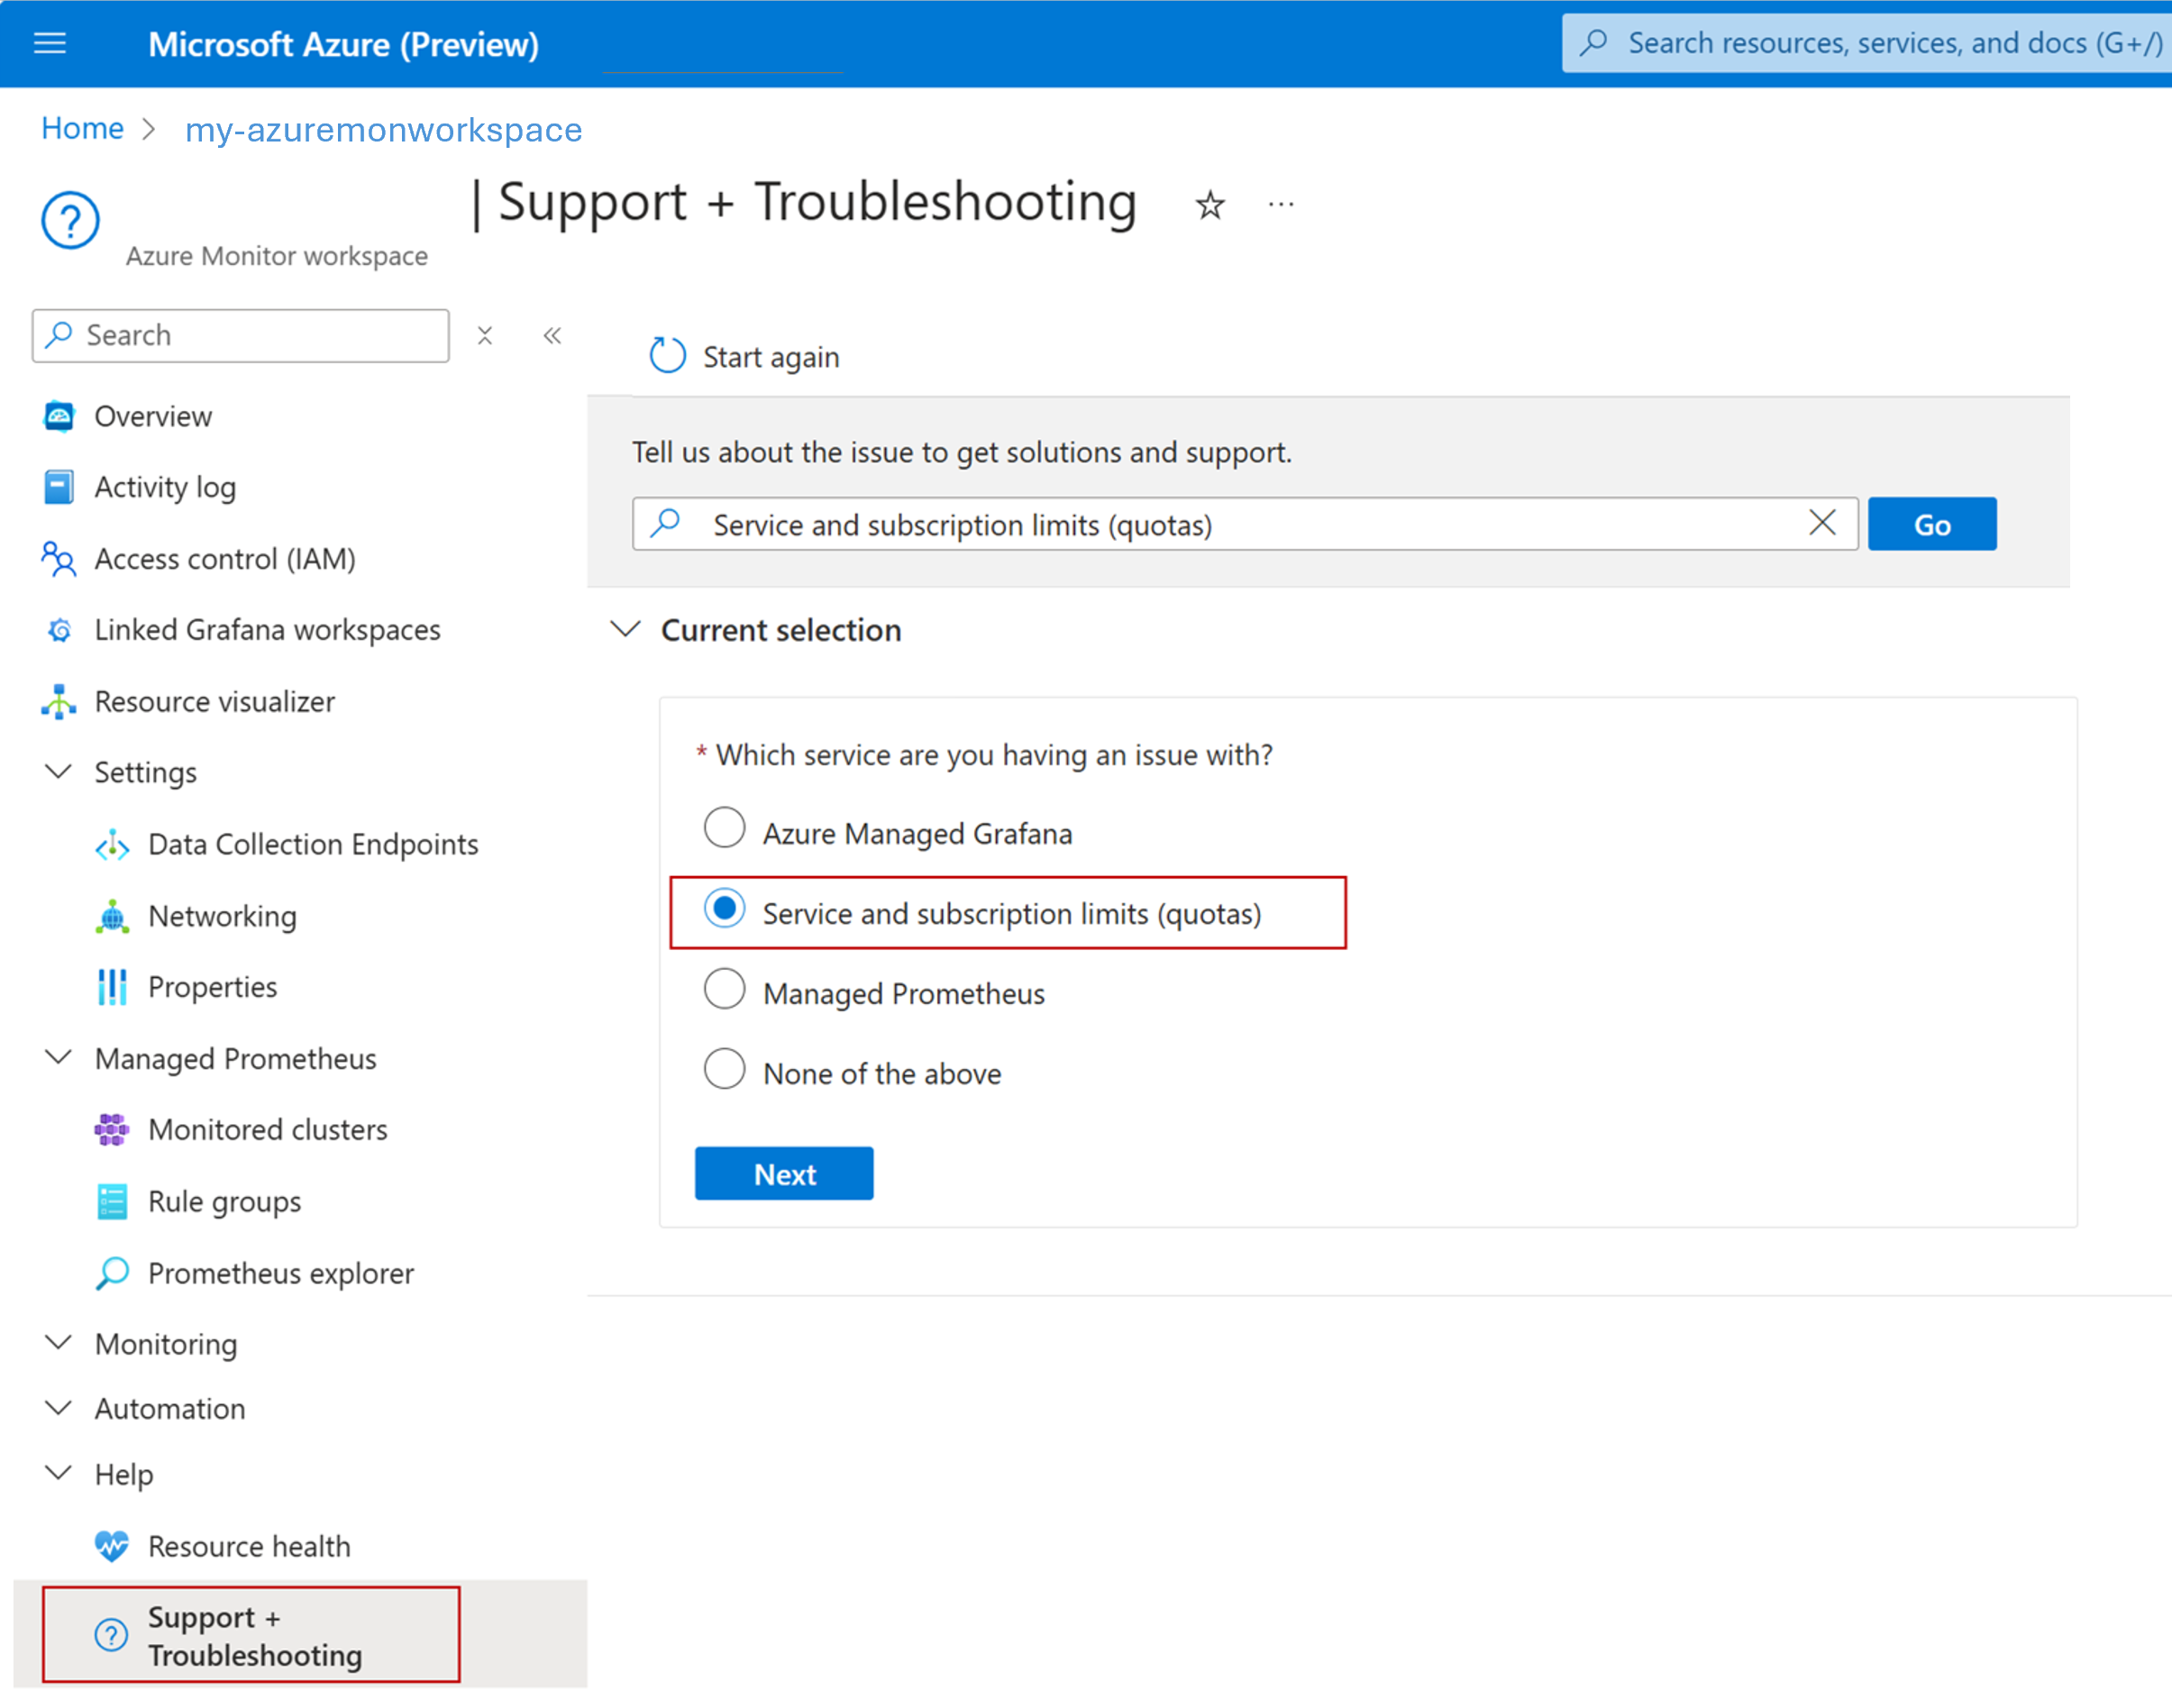
- In the Azure portal, navigate to your Azure Monitor Workspace, click on Support + Troubleshooting.
- Type the issue eg. "Service and subscription limits (quotas)", then select Service and subscription limits (quotas) and click "Next".
- In the next screen, select your subscription and then select Managed Prometheus as the Quota type.
- Provide additional details to create the support ticket.
Next steps
Palaute
Tulossa pian: Vuoden 2024 aikana poistamme asteittain GitHub Issuesin käytöstä sisällön palautemekanismina ja korvaamme sen uudella palautejärjestelmällä. Lisätietoja on täällä: https://aka.ms/ContentUserFeedback.
Lähetä ja näytä palaute kohteelle


